The level of organizational communication satisfaction and job satisfaction of global customer fulfilment workers
I. Sualman, F.H.A. Razak & M.I.S. Hamzah
Universiti Teknologi MARA Shah Alam, Selangor, Malaysia
Y. Darwis
Universitas Andalas, Padang, Indonesia
ABSTRACT: Organizational communication satisfaction and job satisfaction are important to people and to organization as to improve workers and company performance.
Failing to communicate may affect the company day process. The purpose of this study was to examine the relationship between organizational communication satisfaction and job satisfaction among International Business Machine (IBM) Malaysian Workers. The methods used were Communication Satisfaction Questionnaire by Downs and Adrian, and Minnesota. 80 respondents participated in this study. The selection of the samples was drawn based on the convenient sampling technique. The results found that, level of organisational satisfactions of the respondents showed moderate satisfaction of all dimensions. Moderate satisfaction level was also found on job satisfaction of the respondents. From the eight communication satisfaction dimensions (personal feedback, supervisor communication, subordinate communication, horizontal communication, organizational integration, corporate information, communication climate and media quality), ‘communication climate’ was found to be the highest correlation with job satisfactions. There was significant correlation between organizational communication satisfaction and job satisfaction among IBM workers. Hence, the company should maintain the organizational communication process applied within the company as to improve performance.1 INTRODUCTION
In an organisation, employees, managers, or clients communicate with each other using either verbal or non-verbal (gesture or facial expression) communication. The combination of both verbal and nonverbal also happen and often came with emotion.
Eze (1998) defined communication as an interaction between humans that involves the process of sharing ideas, thought, experience, or information from one person to another person. This includes written communication which uses tools such as memos, letters, email, slideshow, and so on. According to Crosling & Ward (2002), workplace oral communication reflects the pervasive and powerful role of language and communication in human society.Richason (2012) stated that the key of effective communication in an organisation is based on interpersonal relationship, which means how good and attractive the process of communication and also how good the listeners are in the organisation. A good listener will react on certain issues or information accordingly. In order to communicate effectively, a good communication process needs to be developed. This is to ensure the information is transmitted fluently and can be understood and accessible to the employees. Pettit Jr (1997) stated that job satisfaction can be influenced by lots of things such as salaries, promotion, relationship between subordinate and upper level management, working environment and so on.
The outcomes that a person or in this case an employee gets from the transaction process between their self-demand and expectation of employees that matches the company’s objectives are called job satisfaction. In completing a company task or business, the management team and also employees need to work as a unit. Thus, managers should be alert with their employees’ need and try to meet their demands. The same thing goes with the employees as they need to prove to the company with a good performance so that the company may achieve its objectives and of course increase the revenues. According to Okpara (2004), job satisfaction in work place is a condition whereby positive emotion or positive feelings that occurs result from good or comfortable occupational experience. It is believed that employees’ happiness often leads to the company’s success.
According to Chiang et al. (2008), communication between employers and workers have to be accurate, complete, clear and consistent to be effective. Communication breakdown will occur when all the principles are not met. Examples of this are poor listening skills, poor communication medium or when communication gets mixed up with sender or receiver’s emotional feeling and so on.
In communication, receivers and senders must understand what the information is all about and everyone must focus on the ideas of the messages. Failing to do so may lead to miscommunication which will affect the company’s day to day process. This situation makes sense why communication must be a two-way process, receivers can always ask for clear information if they are not clear with the messages that the senders sent to them.
There are few barriers in communication such as language, different personalities, cultural differences and physical factors. When communication difficulty exists, workers communication satisfactions have a tendency to drop off, resulting in decrease of job satisfaction, commitment and also employee performance. Thus, leaders in the certain organisation must always look up and try to provide a good communication medium or communication method in information delivery to their workers.
The key of effective communication in the organisation is based on interpersonal factor, which means how good and attractive the process of communication and also how good the listeners are in the organisation. The absence or lack of communication in the organisation may decrease workers communication satisfaction and lead to decrease of leadership, productivity of the organisation and the most important is workers job satisfaction.
These issues are harmful to the organisations and will impact the quality and services given to their customers. It is critically important for an organisation or employer to be aware of the barriers of communication within the organisation or workplace and how satisfied the workers with the communication process occurred in their organisation.
Therefore, this research is undertaken to study the relationship between organisational communication satisfaction and job satisfaction in Global Customer Fulfillment department in IBM Malaysia. More specifically, this study is to assess the level of organisational communication satisfaction and job satisfaction and its relationship as well. Effective organisational communication is very crucial in any organisation in this world. Therefore, it is the responsibility of all categories of workers to build an imperative communication with other subordinates and also clients. The results from this research may help the workers to know their level of communication and job satisfaction. This study investigates the relationship between organisational communication satisfaction and job satisfaction of workers. The results from this study can be beneficial to the organisation to help them to improve their communication and to increase workers’ job satisfaction. Moreover, the results from this study may be beneficial as a reference for future research on communication satisfaction and job satisfaction. The purpose of this study is to examine the relationship between organisational communication satisfaction and job satisfaction among IBM Malaysian workers. The specific objectives are:- To identify the workers’ level of communication satisfaction in the organisation.
- To identify the workers’ level of job satisfaction in the organisation.
- To analyse the relationship between organisational communication satisfaction and job satisfaction.
The hypothesis of this study were developed as follow:
- H1: There is a significant relationship between good organisational communication and job satisfaction among IBM workers.
- H2: There is a relationship organisational integration and job satisfaction.
- H3: There is a relationship between communicate climate and job satisfaction.
2 RESEARCH METHOD
The research of organisational communication satisfaction and job satisfaction in IBM Malaysia, was conducted in quantitative approaches.
In the quantitative research, the aim was to determine the relationship between another (outcome variable) and one thing (an independent variable) in a population. For a precise estimation of the relationship between variables, a descriptive study usually needs a sample of hundreds or even thousands of subjects. Therefore, the research method used was survey research.The method of data collection that was used in this study was survey and a simple random sampling was used to select the sample. It is a non-representa- tive subset of some larger population. This type of sampling is more convenient and economical compared to other sampling technique. The number of workers (population) who work in IGF department, IBM Malaysia Private Limited was 100 so the sample size was 80. The questionnaire was adapted from Communication Satisfaction Questionnaire (CSQ) of Downs and Hazen (2004) and Minnesota Satisfaction Questionnaire (MSQ) (Weiss & Cropan- zano (1996). Downs and Hazen identified three main contexts that should be measured by a communication satisfaction questionnaire which are interpersonal communication, communication in group context, and communication in the organisational context. The Minnesota Satisfaction Questionnaire (MSQ) was designed to measure an employee’s satisfaction towards their job. Rather than analysing general measures of job satisfaction, the MSQ provided more specific information on the aspects of a job that an individual find rewarding. The MSQ is also useful in exploring client vocational needs, in counseling follow-up studies, and in generating information about reinforces in jobs. The Likert scale range 1- very satisfied, 2- Dissatisfied, 3 Neutral, 4- Satisfied and 5 Very Satisfied were used to measure the level of satisfaction.
3 RESULTS
3.1 Level of communication satisfaction
Table 1 shows communication satisfaction scores of IBM workers. The highest score dimensions were corporate information (M=4.25) followed by organisational integration (M=4.14) and subordinate communication (M=4.09).
The second lowest score dimension was communication climate (M=3.80) and the lowest were personal feedback (M=3.49). Based on the Table 1, the level of organisational communication satisfaction of IBM workers is satisfied.3.2 Level of job satisfaction
Table 2 represents job satisfaction scores of IBM workers. The highest score dimensions were responsibility (M=4.30) followed by extrinsic reward dimensions (M=3.93) and leadership dimensions (M=3.83). The lowest score was working condition (M=3.59). The Likert scale for job satisfaction range 1- very satisfied, 2- Dissatisfied, 3 Neutral, 4- Satisfied and 5 Very Satisfied. Based on the table, the level of job satisfaction of IBM workers is satisfied.
3.3 Relationship between organisational communication and job satisfaction
Table 3 indicated moderate positive linear correlation between organisational communication and job satisfaction. This moderate positive linear correlation coefficient between organisational communication and job satisfaction (r=.50, phypothesis 2 was accepted.
3.5 Relationship between communication climate and job satisfaction
Table 5 indicated moderate positive linear correlation communication climate and job satisfaction.
Table 1. Communication satisfaction.
| Dimensions | Mean | SD* |
| Personal feedback | 3.49 | .771 |
| Supervisor communication | 3.91 | .522 |
| Subordinate communication | 4.09 | .717 |
| Horizontal communication | 3.86 | .490 |
| Organisational integration | 4.14 | .532 |
| Corporate information | 4.25 | .479 |
| Communication climate | 3.80 | .582 |
| Media quality | 4.04 | .516 |
| *Standard Deviation |
Table 4. Correlation between organisational integration and job satisfaction.
Correlations
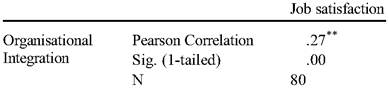
**. Correlation is significant at the 0.05 level (2-tailed).
Table 2. Job Satisfaction scores.
| Dimensions | Mean | SD* |
| Working condition | 3.59 | .677 |
| Leadership | 3.83 | .684 |
| Responsibility | 4.30 | .538 |
| Extrinsic reward | 3.93 | .366 |
*Standard Deviation
Table 5. Correlation between communication climate and job satisfaction.
Correlations
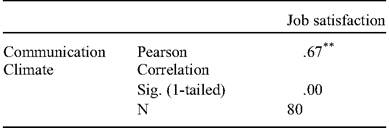
**. Correlation is significant at the 0.05 level (2-tailed).
This moderate positive linear correlation coefficient between communication climate and job satisfaction (r=.62, pfor sellers to market their products through online stores, including for the sellers of luxury goods. The difference between luxury shoppers and regular shoppers is luxury shoppers willing to pay premium for prestigious products to show their social status. The purpose of this research is to analyze whether there is a difference in shopping behavior between online luxury shoppers and in-store luxury shoppers. The number of samples in this research were 124 respondents. This research uses independent sample t-test. The result shows there is no difference between online luxury and in-store luxury shoppers towards luxury goods.
1 INTRODUCTION
The traditional in-store, which is the out of date marketing application is a direct and tangible interaction between the seller and the buyer. The up to date marketing has begun to shift from traditional in-store to online store. The invention of the internet could become as important as the invention of the automobile in shaping people's daily activities (Farag 2006). The use of Information and Communication Technologies (ICT) has been increasing in recent decades (Mokhtarian 2004). Information technology has played an important role in influencing the scale and nature of retail. In the past few decades we have seen smartphones and other electronic devices used for business transactions. Searching product information and buying goods online are becoming increasingly popular activities (Farag 2006). Online shopping is emerging as one of the most important vehicles for transactions between buyers and sellers (Su 2008).
Based on Google Indonesia survey results in 2016, the trend of online shopping in Indonesia is the highest in Asia with an estimated 71 percent of Indonesians using smartphones for online transactions is 136 minutes per day and uses about 52 minutes of desktop per day. The bestselling products in Indonesia's online shopping are travel products (airfare and hotel), fashion (clothes and accessories), gadgets (smartphones and tablets), electronic products, and e-books (The Daily Oktagon 2017). The products are included in the category of non-luxury goods products. Do shoppers in Indonesia dare or not to buy luxury goods through online channels? As we know luxury goods are expensive goods and considered risky when buying through online channels. Shopping online is not easy to do for all types of product such as luxury goods.
The business of luxury goods has become one of the fastest growing business segments in today's world, this is not confined to any country or segment but is spreading to all groups and countries, especially emerging economies (Sun 2011). The market for luxury goods and services has been enlarging, steadily, and strongly, since the early 1990s (Truong et al. 2008, Truong 2010, Roux et al. 2016), economic recovery in most of the western countries and unshackled economic growth in Southeast Asian countries triggered the purchase of luxury goods (Vigneron & Johnson 1999). The luxury market grew by 5% to an estimated ˆ1.2 trillion globally in 2017 (D'Arpizio et al. 2017).
In the world of luxury brands, it may appear intuitive to think that some brands are more conspicuous than others because they hold more materialistic values, or are more fashionable (Truong et al. 2008). Luxury goods enable consumers to satisfy psychological and functional needs. The consumption of luxury goods involves buying a product that represents values to both the individual and significant others (Wiedmann et al. 2009). Grossman and Shapiro (1986) stated that owning and using luxury goods can convey the owners' perceived social status and prestige.
The difference between luxury shoppers and regular shoppers is luxury shoppers willing to pay premium for prestigious products to show their social status (Veblen 2017). Factors that influence online luxury shoppers and in-store luxury shoppers according to Liu et al. (2013) are price consciousness, product availability, trust, risk aversion, employee attitude, and shopping interaction.
According to Liu et al. (2013), online luxury shoppers are more price consciousness than in-store luxury shoppers. The Internet makes it easy for online luxury shoppers to compare prices from some online stores first and find the cheapest prices. In
addition, online luxury shoppers can easily view and compare items from several online stores of a kind, high variety they are looking for and they expect product availability. For in-store luxury shoppers, it is difficult to compare prices and see the availability of products because in-store luxury stores are very few in each region, so their tendency is not too price consciousness and variety seeking. Thus, we present the following hypotheses:
H1: There is a difference of price consciousness between online luxury shoppers and in-store luxury shoppers.
H2: There is a difference of value product availability between online luxury shoppers and in-store luxury shoppers.
According to Liu et al. (2013), in-store luxury shoppers feel that shopping in the in-store is safer because they can ensure that the goods do exist and are genuine goods. While they make payments by credit card too, they feel safe because the money spent on luxury goods quite a lot. When online luxury shoppers want to buy luxury goods, they will find a seller with good reviews and ratings to avoid unwanted incident. Thus, we present the following hypotheses:
H3: There is a difference of level of trust between online luxury shoppers and in-store luxury shoppers.
H4: There is a difference of level of risk aversion between online luxury shoppers and in-store luxury shoppers.
According to Liu et al. (2013), in-store luxury shoppers prefer to able to see and touch the products. Good customer service and courteous store employees are important to the in-store luxury shoppers while online luxury shoppers enjoy shopping online because of the lack pressure from the salesperson. The in-store luxury shoppers feel that they are not only high valued, but also financially successful through the interaction between in-store luxury shoppers and store employees help in-store shoppers. Thus, we present the following hypotheses:
H5: There is a difference value of personal store service (employee attitude) between online luxury shoppers and in-store luxury shoppers.
H6: There is a difference of value shopping interactions between online luxury shoppers and in-store luxury shoppers.
2 RESEARCH METHOD
The current research method replicates and adopts the Liu et al. (2013) research. We used qualitative and quantitative methods. This research used 24 measurement items. 5 items to measure conspicuous consumption motive (CCM), 3 items to measure price consciousness (PC), 3 items to measure product availability (PA), 4 items to measure trust (TR), 3 items to measure risk aversion (RA), 3 items to measure employee attitude (EA), and 3 items to measure shopping interaction (SI).
We referred adult respondents who were at least twenty one years old and live in Bandung and its surroundings. Non-probability sampling used in this research. The numbers of samples were 124 respondents. The age of respondents ranged from 21 to 45 above, there were 60 males and 64 females.
We used a qualitative method to identify which respondents belonged to the category of luxury shoppers. There are two questions asked. First: ‘In the last three years, have you bought any luxury brand products?” The second question is about luxury consumption tendency, five scale items were included to measure the construct of conspicuous consumption motive (CCM). Those respondents whose average scores were higher than three were deemed to display a high luxury consumption tendency. Only those respondents who answered “yes” to the first question about their experience in luxury shopping and also scored higher than three on the CCM scale were categorized as luxury consumers. The final sample consisted of 56 respondents, there were 31 males and 25 females.
Next, we divided the 56 luxury shoppers into online and in-store groups. In our surveys, we asked the respondents how frequently they purchased luxury goods online. The respondents needed to select one of six options: “never”, “once in two or three years”, “once a year”, “twice a year”, “three times a year”, and “over three times a year”. The respondents who selected “never” or “once in two or three years” were assigned to the in-store group. The rest of the shoppers were put in the online group. After applying this grouping method, we identified 33 online luxury shoppers and 23 in-store ones.
A quantitative method is used to examine the hypotheses. Hypotheses was tested with independent sample t-test, it compares the means are significantly different.
3 RESULTS
3.1 Validityandreliability
The results of the validity test show the KMO results of 0.717 with a significance level of 0.000, meaning the number of samples in this research is adequate. A common rule of thumb for validity test suggests that a KMO score above 0.5 is adequate and a high Bartlett score with a significance level of 0.5 is significant (Hair et al. 1998). Table 1 presents the results of factor loadings. Based on these results, all items are valid.
Based on Table 2, all items are reliable because the cronbach’s alpha value is greater than 0.600.
Table 1. Validity test results.
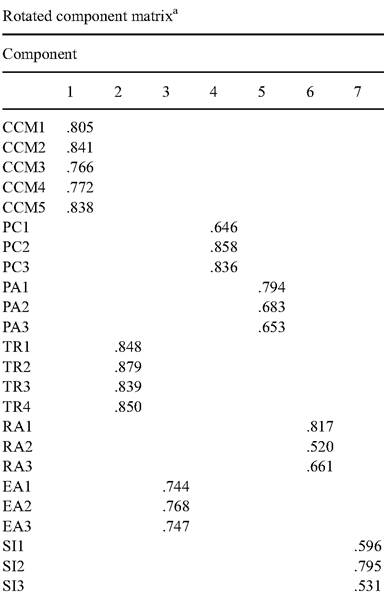
Extraction Method: Principal Component Analysis. Rotation Method: Varimax with Kaiser Normalization.
a. Rotation converged in 7 iterations.
Source: Results of SPSS processed data (2018)
Table 2. Reliability test results.
| Variable/indicator | Cronbach’s alpha | Status |
| CCM | 0.870 | Reliabel |
| PC | 0.746 | Reliabel |
| PA | 0.660 | Reliabel |
| TR | 0.896 | Reliabel |
| RA | 0.619 | Reliabel |
| EA | 0.743 | Reliabel |
| SI | 0.612 | Reliabel |
Source: Results of SPSS processed data (2018)
Rule of thumb for reliability test suggests that the value of cronbach’s alpha should be greater than 0.700 (Hair et al. 1998), but other authors say that a value of 0.600 is still acceptable (Sekaran & Bougie 2013).
Table 3. In-store luxury shoppers versus online luxury shoppers.
| Hypothesis number | In-store luxury shoppers average | Online luxury shoppers average | Sig. (p value) |
| H1: Price consciousness | 4.3913 | 4.1515 | 0.214 |
| H2: Product availability | 4.0290 | 3.8081 | 0.194 |
| H3: Trust | 4.0978 | 3.9015 | 0.325 |
| H4: Risk aversion | 4.3478 | 4.4949 | 0.283 |
| H5: Employee attitude | 4.1159 | 4.0404 | 0.662 |
| H6: Shopping interaction | 3.8406 | 3.8889 | 0.727 |
Source: Results of SPSS processed data (2018)
3.2 Independent sample t-test
Results are shown in Table 3. All hypotheses are not supported because the value of p value is greater than 0.05. First, we did not find support for H1 online and in-store luxury shoppers showed no significant difference in their behavior towards price consciousness. This results reveals that online and in-store luxury shoppers demonstrate the same behavior towards price consciousness. Second, we did not find support for H2 online and in-store luxury shoppers showed no significant difference in their behavior towards product availability. This results reveals that online and in-store luxury shoppers demonstrate the same behavior towards product availability.
Third, we did not find support for H3 online and in-store luxury shoppers showed no significant difference in their behavior towards level of trust. This results reveals that online and in-store luxury shoppers demonstrate the same behavior towards level of trust. Fourth, we did not find support for H4 online and in-store luxury shoppers showed no significant difference in their behavior towards level of risk aversion. This results reveals that online and in-store luxury shoppers demonstrate the same behavior towards level of risk aversion.
Fifth, we did not find support for H5 online and instore luxury shoppers showed no significant difference in their behavior towards value of personal store service (employee attitude). This results reveals that online and in-store luxury shoppers demonstrate the same behavior towards value of personal store service (employee attitude). Sixth, we did not find support for H6 online and in-store luxury shoppers showed no significant difference in their behavior towards value shopping interactions. This results reveals that online and in-store luxury shoppers demonstrate the same behavior towards value shopping interactions.
This means there is no difference behavior between in-store luxury shoppers with online luxury shoppers towards price consciousness, product availability, trust, risk aversion, employee attitude, and shopping interaction.
4 DISCUSSION AND CONCLUSION
The results of this research differ from previous research results from Liu et al. (2013). In this research there is no different behavior between instore luxury shoppers with online luxury shoppers towards price consciousness, product availability, trust, risk aversion, employee attitude, and shopping interaction. This occurs due to cultural differences between samples in previous studies (Western) and this research (Asian). Some researchers claim that there are differences in behavior between Western and Asian related to luxury goods (Dubois & Laurent 1994, Wong & Ahuvia 1998, Wong & Zaich- kowsky 1999, Zhang & Schavitt 2003, Veblen 2017, Hofstede et al. 2010, Sun 2011, Hofstede 2011, Hennigs et al. 2012).
Asian shoppers buy luxury goods to elevate their social status, more famous and expensive the brand, more recognition they will get and emphasize to others that they have the ability to afford expensive products. Wearing or using luxury brands, an individual can bring glory and respect to the family and to the wider community as a clear sign of his or her/ his success. In addition, Asian shoppers are strongly influenced by the collectiveness and social pressure to conform, they tend to hide their personal opinions, conform to the group and obey manners that are believed to be socially acceptable. Purchase luxury branded products to look the same as their peers.
Thus, Asian shoppers do not really care whether they buy the luxury goods through in-store or online store; therefore, the result of this research did not find the difference of behavior between instore luxury shoppers with online luxury shoppers towards price consciousness, product availability, trust, risk aversion, employee attitude, and shopping interaction.
Considering the aforementioned facts, we cannot generalize the results of this research because there are only a few samples used and the research area is only in Bandung and its surroundings, not all of Indonesia and even Asia. These are limitations in our research. For further research, it is better to expand the research area and increase the number of samples.
References
D'Arpizio, C., Levato, F., Kamel, M.A. & Montgolfier, J. D. 2017. Luxury Goods Worldwide Market Study, FallWinter 2017: The New Luxury Consumer: Why Responding to the Millennial Mindset Will Be Key. Boston: Bain & Company.
Dubois, B. & Laurent, G. (1994). Attitudes towards the concept of luxury: An exploratory analysis. Asia Pacific Advances in Consumer Research 1: 273-278.
Farag, S. 2006. E-shopping and its interactions with instore shopping. Utrecht: Utrecht University.
Grossman, G.M. & Shapiro, C. 1988. Foreign counterfeiting of status goods. The Quarterly Journal of Economics 103(1): 79-100.
Hair, J.R., Anderson, R.E., Tatham, R.L. & Black, W.C. 1998. Multivariate Data Analysis. 5th Edition, Upper Saddle River. NJ: Prentice-Hall, Inc.
Hennigs, N., Wiedmann, K.P., Klarmann, C., Strehlau, S., Godey, B., Pederzoli, D. & Taro, K. 2012. What is the value of luxury? A cross-cultural consumer perspective. Psychology & Marketing 29(12): 1018-1034.
Hofstede, G. 2011. Dimensionalising cultures: The Hof- stede model in context. Online readings in psychology and culture 2(1): 1-26.
Hofstede, G., Hofstede, G.J. & Minkov, M. 2010. Cultures and organizations: Software of the mind: Intercultural cooperation and its importance (pp. 6527).
Liu, X., Burns, A.C. & Hou, Y. 2013. Comparing online and in-store shopping behavior towards luxury goods. International Journal of Retail & Distribution Management 41(11/12): 885-900.
Mokhtarian, P.L. 2004. A conceptual analysis of the transportation impacts of B2C e-commerce. Transportation 31(3): 257-284.
Roux, E., Tafani, E. & Vigneron, F. 2017. Values associated with luxury brand consumption and the role of gender. Journal of Business Research 71: 102-113.
Sekaran, U. & Bougie, R. 2013. Research methods for business: A skill-building approach. 6th Edition. New York: John Wiley & Sons, Ltd.
Su, B.C. 2008. Characteristics of consumer search on-line: How much do we search?. International Journal of Electronic Commerce 13(1): 109-129.
Sun, M.W. 2011. Consumption of luxury fashion brands: The motives of generation y consumers in China. Auckland: Auckland University of Technology.
The Daily Oktagon. 2017. Perilaku hedonism pada peng- guna smartphone, apakah anda salah satunya?. [Online]. Retrieved from https://daily.oktagon.co.id/perilaku-hedo nisme-pada-pengguna-smartphone-apakah-anda-salah- satunya/ Accessed on 2018- 06-29.
Truong, Y. 2010. Personal aspirations and the consumption of luxury goods. International Journal of Market Research 52(5): 655-673.
Truong, Y., Simmons, G., McColl, M. & Kitchen, P.J. 2008. Status and conspicuousness - are they related? Strategic marketing implications for luxury brands. Journal of Strategic Marketing 16(3): 189-203.
Veblen, T. 2017. The theory of the leisure class. London: Routledge.
Vigneron, F. & Johnson, L.W. 1999. A review and a conceptual framework of prestige-seeking consumer behavior. Academy of Marketing Science Review 1(1): 1-15.
Wiedmann, K.P., Hennigs, N. & Siebels, A. 2009. Valuebased segmentation of luxury consumption behavior. Psychology & Marketing 26(7): 625-651.
Wong, N.Y. & Ahuvia, A.C. 1998. Personal taste and family face: Luxury consumption in confucian and western societies. Psychology & Marketing 15(5): 423-441.
Wong, A.C.Y & Zaichkowsky, J.L. 1999. Understanding luxury brands in Hong Kong. European Advances in Consumer Research 4: 310-316.
Zhang, J. & Shavitt, S. 2003. Cultural values in advertisements to the Chinese x-generation: Promoting modernity and individualism. Journal of Advertising 32(1): 2131.