METHODOLOGY AND DATA
3.1. Method
We construct a panel regression model to study the effects of price-based and quantitative monetary policy instruments on bank risks as follows:
RKt = β0 + β1ResRatiot + β2IRt + β3ln Opent +βiGDPGt + β5INFt + β6 ln(PRIt + β7 ln(SIZEt) +β8ERtt + β9Ownershipt + β ln(Regulationt) + ε
(1) where the risk variable, RK, of bank i at time t is a function of monetary policy instrument variables (ResRatio, IR and Open); a set of macroeconomic, regulatory control variables(GDPG, INF, RPI and Regulation) and a set of bank-level control variables(SIZE, ER, and Ownership).
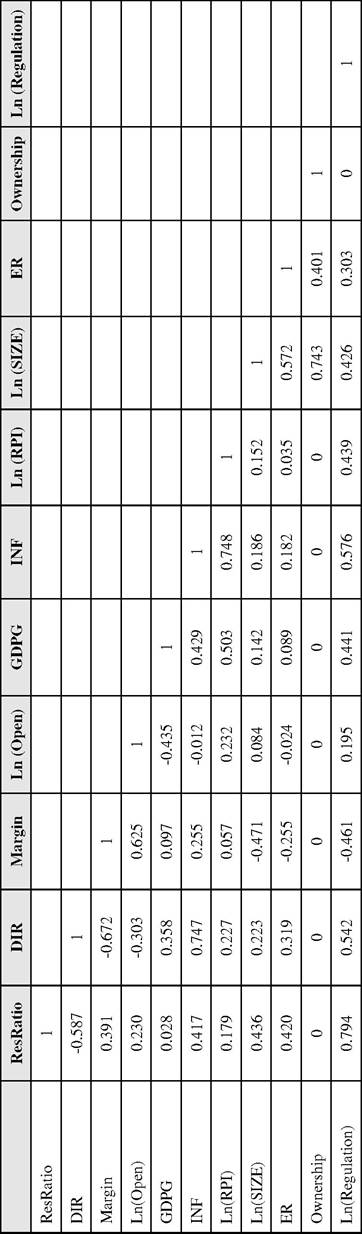
β0 represents the constant term. β,(∕=1,2,...,10) denotes the parameters. ε means the random disturbance. Before carrying out the empirical analysis, we should discuss the variables used and the dataset.Table 5 provides descriptive statistics for all the variables used in the empirical analysis. Table 6 reports correlation coefficients between these variables. According to Damodar N.Guj arati(2000),if zero-order correlation coefficient of each two regressors is over 0.8, the multi-collinearity problem will be a severe problem. Correlations in our study are acceptable levels as shown in Table 6. In what follows, we analyze the choice of our dependent and explanatory variables.
We proxy the risk behavior of banks using RiskAsset, LoanRatio and InvRatio. RiskAsset, a dependent variable, measures banks’ risks and is defined as the ratio of risk assets for bank i to total assets at time t. Bank risk assets are the assets that fluctuate with the money market or credit market and include all bank assets except cash, the deposits with Central Bank, the deposits with banks and interbank lending.
Naturally, an increase in RiskAsset demonstrates a more risky position of banks. Since 2006, the mean of RiskAsset has basically maintained a declining trend.ResRatio represents the reserve requirement ratio, a main quantitative instrument used in China. We adopt the reserve requirement ratio for the large financial institutions with the reason that large financial institutions is the majority of Chinese banking industry and the reserve requirement ratios for the large, small and medium-sized financial institutions have a basically uniform trend. As the reserve requirement ratio and the interest rate may be changed for several times within one year, the daily weighed means of the both is used. Since 2000, ResRatio has kept a rising
Table 5. Descriptive statistics
| Variable | Mean | Standard Deviation | Maximum | Minimum |
| RiskAsset | 0.8498 | 0.041 | 0.907 | 0.692 |
| ResRatio | 10.269 | bgcolor=white>4.51016.84 | 6.000 | |
| DIR | 2.699 | 0.868 | 5.030 | 1.980 |
| Margin | 3.304 | 0.290 | 3.610 | 2.518 |
| Ln (Open) | 10.363 | 0.732 | 12.210 | 9.272 |
| GDPG | 10.480 | 1.715 | 14.200 | 7.600 |
| INF | 2.1600 | 2.150 | 5.900 | -0.800 |
| Ln (RPI) | 4.661 | 0.025 | 4.695 | 4.605 |
| Ln (SIZE) | 27.884 | 1.274 | 30.231 | 25.512 |
| ER | 4.312 | 1.633 | 8.412 | 1.465 |
| Ownership | 0.417 | 0.495 | 1.00 | 0.000 |
| Ln (Regulation) | 0.024 | 0.403 | 0.405 | -0.693 |
Note: RiskAsset is the ratio of risk assets for bank i to total assets at time t.
ResRatio represents the reserve requirement ratio. DIR denotes the RMB 1-year benchmark deposit rate. Margin equals the RMB 1-year benchmark loan rate less DIR. Open means open market operation, measured by the turnover of T-Bond trading (including spot trading and repo.trading). GDPG means real GDP growth rate and INF denotes inflation rate, mesured by CPI growth rate. RPI demotes real estate price index. SIZE represents size of the bank. ER denotes equity ratio that is defined as the ratio of shareholders’ equity and total assets. Ownership represents the bank ownership. Regulation denotes the banking regulation intensity. Ln means the natural logarithm.Table 6. Correlation matrix
trend from 6.0 percent in 2000 to 21.0 percent for the large financial institutions and 17.5 percent for small and medium-sized financial institutions in December 2011.
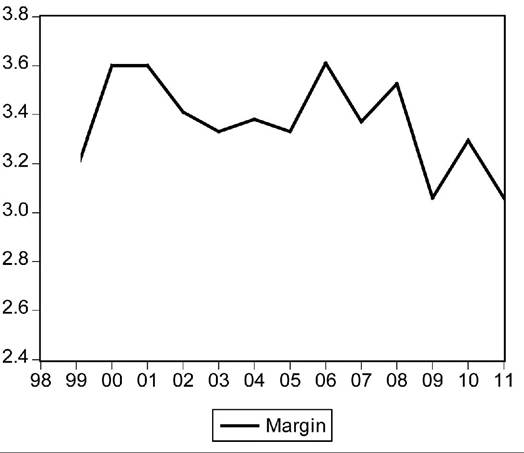
IR denotes the variables that relate to interest rate, the price-based instrument. We use two variables: DIR and Margin. DIR denotes the RMB 1-year benchmark deposit rate. Margin equals LIR (i.e. the RMB 1-year benchmark loan rate) less DIR. Figure 1 and Figure 2 shows the changes of DIR-LIR and Margin. The years of 1998-1999, 2000-2006, 2007-2008, 2009-2010 and 2011 are respectively high interest rate regime, low interest rate regime, high interest rate regime, low interest rate regime and high interest rate regime. The years of 1998-1999, 2000-2008 and 2009-2011 are respectively the periods of low interest rate margin, high interest rate margin and low interest rate margin.2
Open means open market operation, another main quantitative instrument in China. We use the turnover of T-Bond trading (including spot trading and repo.trading) to measure open market operation. Since 2006, total turnover of trading of T-Bond had been rising continually from 1063.35 billion Yuan in 2006 to 20084.133 billion Yuan in 2011.
We have chosen several control variables for our regression analysis. These variables are defined and discussed below, while summary statistics are reported in Table 5.
GDPG (realGDP growthrate) and /.∙V√∙'(ιnl'lalιon rate, denoted by CPI growth rate) is used to measure the macroeconomic situation that may have an impact on bank assets and debts, thus affecting bank risk.
RPI, real estate price index, is used to measure the situations of real estate market. The real estate loans account for a large proportion of Chinese bank credits. Too much bank credits are input into the real estate market, which may give reasons to the potential risk.
SIZE represents size of the bank, which is measured by total asset of the bank. Banks with
Figure 1. The changes of the interest rates: Changes of LIR and DIR
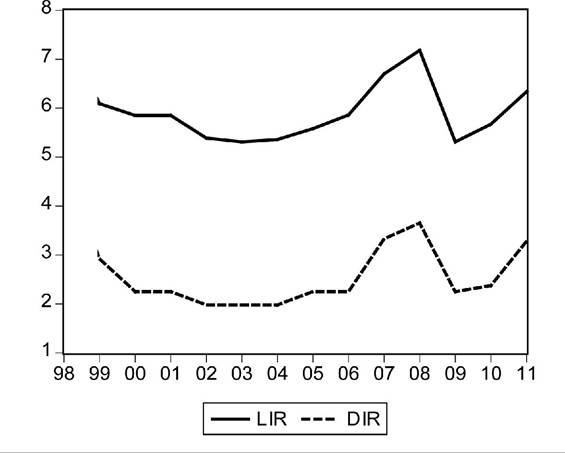
Figure 2. The changes of the interest rates: The changes of Margin
the different sizes may have distinct motivation to engage in risky activities.
ER denotes equity ratio that is defined as the ratio of shareholders’ equity and total assets, which represent banks’ asset-liability structures.
Banks with the different asset-liability structures face different risk.
Ownership represents the bank ownership. Considering the differences of risk-taking behaviour between state-owned banks and non-state-
owned banks, we construct a dummy variable BD on behalf of bank ownership. If the bank is state-owned (Industrial and Commercial Bank of China, Agricultural Bank of China, Bank of China, China Construction Bank and Bank of Communications), the value of BD is 1; if not, the value of BD is 0.
Regulation denotes the banking regulation intensity that is also an important factor that has an impact on bank risk. The value of the banking supervision intensity from 1998 to 2002 is 0.5, because China’s banking regulation was carried out by the People’s B ank of China before 2003 and separated regulation wasn’t implemented as well, which made the regulation relatively weak.
The value of the banking regulation intensity between 2003 and 2006 is set at 1.0 with the reason that the China Banking Regulatory Commission was established in 2003, which strengthened banking regulation. The value of banking regulation intensity during 2007-2011 is 1.5, since the third national financial work conference in 2007 reaffirmed the importance of strengthening financial regulation.3.2. Data
We use annual data of nineteen Chinese banks whose assets account for over 64% of the assets of Chinese banking industry from 1998 to 2011. The sample contains the five large commercial banks, ten joint-stock commercial banks, and four city commercial banks. Among those, the large commercial banks include the Industrial and Commercial Bank of China (ICBC), the Agricultural Bank of China (ABC), the Bank of China (BOC), the China Construction Bank (CCB) and Bank of Communications (BOCOM); the joint-stock commercial banks include CITIC Bank, Everbright Bank of China, Huaxia Bank, Guangdong Development B ank, Shenzhen Development B ank, China Merchants Bank, Shanghai Pudong Development Bank, Industrial Bank, China Minsheng Banking Co., and Evergrowing Bank; the city commercial banks include Beijing Bank, Shanghai Bank, Nanjing Bank and Ningbo Bank.
The banks’ data of risk assets, total assets, loans, investments, equity ratio and the data of real estate price index, real GDP growth rate, inflation rate measured by CPI growth rate come from DRCNET Statistical Data Database System, Almanac of China ,s Finance and Banking and the website of very bank. The data of the RMB 1-year benchmark deposit rate, the reserve requirement ratio, the total turnover of T-Bond trading comes from the website of People ,s Bank of China.
4.
More on the topic METHODOLOGY AND DATA:
- 3M Participatory Evaluation: Introducing the Methodology
- Country risk Methodology
- Epidemiologic Problem Oriented Approach (EPOA) Methodology
- APPENDIX THE HUMAN SCIENCES
- THE INTERNET OF ENTERTAINMENT AS A DRIVER FOR ACADEMIC RESEARCH
- Aggregation: The Adjusted Headcount Ratio
- This chapter provides a systematic overview of the multidimensional measurement methodology of Alkire and Foster (2007, 2011a), with an emphasis on the first measure of that class: the Adjusted Headcount Ratio or M0.
- Methodology
- PREFACE
- COLLECTING AND ANALYZING SURVEY DATA