Predictive Analysis Model
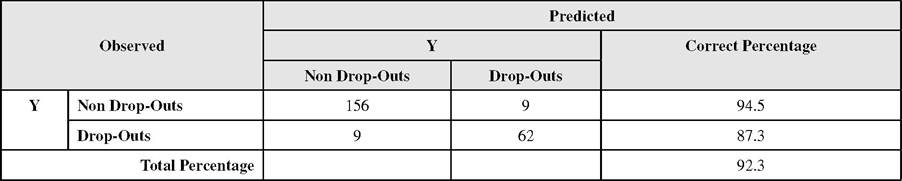
It is interesting to assess the predictive ability or efficacy of the model, which is carried out from the classification presented in Table 10, where the observed values for the dependent variable are listed, distinguishing between customers who drop out of the bank (0) and customers who are loyal to the company (1), as well as the values predicted by the estimated model, which are applied to customers who were kept for the validation sample.
As said, the correct classification rate obtained in the validation process was 92.3%, measuring the accuracy with which the model achieves to discriminate both groups among the cases (customers who are loyal to the bank and dropouts). We can also identify a similar percentage after applying the expressions taken from Table 6 to the holdout sample for validation.The values of sensitivity and specificity are the coordinates of the ROC curve. It is necessary to keep in mind that its value ranges from 0.5 to 1, so that the best possible prediction method would be placed at the left upper corner, or coordinate (0,1) of the ROC space, representing 100% sensitivity
Table 9. Classification matrix
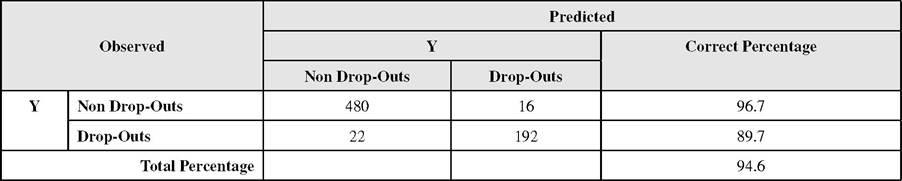
Table 10. Classification matrix model validation process
(no false negatives) and also 100% specificity (no false positives).
This point (0.1) is also called a perfect classification. In this line, as can be seen in Figure 3, the ROC curve of the model approaches the left upper corner of the chart, which confirms that the model has a correct capacity of discrimination between the two groups of customers.
More on the topic Predictive Analysis Model:
- THE VALUE OF A CONCEPTUAL MODEL
- REVIEW OF FORENSIC ASSESSMENT INSTRUMENTS
- FIVE COMPONENTS OF LEGAL COMPETENCIES
- XAT 2009