ECOLOGICAL TOOLKIT 1.1
Designing Ecological Experiments
A key step in any ecological experiment occurs well before it is performed: the experiment must be designed carefully. In a controlled experiment, an experimental group, which has the factor being tested, is compared with a control group, which does not.
Different levels of the factor being tested are often referred to as different treatments. For example, in the experiment by Johnson et al. (1999) discussed earlier in this chapter, the control group received a treatment of 0 parasites per container, while members of the experimental group were assigned to one of three other treatments (16, 32, or 48 parasites per container).
The design of many ecological experiments includes three additional steps: replication, random assignment of treatments, and statistical analyses. Replication and random assignment of treatments are used to reduce the chance that variables not under the control of the experimenter will unduly influence the results of the experiment. Once the experiment has been completed, statistical analyses are used to assess the extent to which the results from the different treatments differ from one another.
Several features of experimental design can be illustrated by the layout used in field studies performed by Richard B. Root, Walter Carson, and colleagues at Cornell University. In one such study, Carson and Root (2000) examined how herbivorous (plant-eating) insects affected a plant community dominated by the goldenrod Solidago altissima. Their first step was to define their research question: Does plant abundance, growth, or reproduction differ between insecticide-treated and control plots? To find out, they divided a field of goldenrods into the grid of 5 ? 5 m plots shown in FIGURE A. The experiment ran for 10 years and used two treatments: a control, in which natural processes were left undisturbed, and an insect removal treatment, in which an insecticide was applied annually to reduce the numbers of herbivorous insects.
Carson and Root selected 30 plots at random for use in the experiment; half of those plots were then selected at random to receive the insecticide treatment, while the remainingplots served as controls. Thus, there were 15 replicates for each treatment. Statistical analyses of the results indicated that herbivorous insects had major effects on the plant community, as is also suggested by the photograph in FIGURE B.
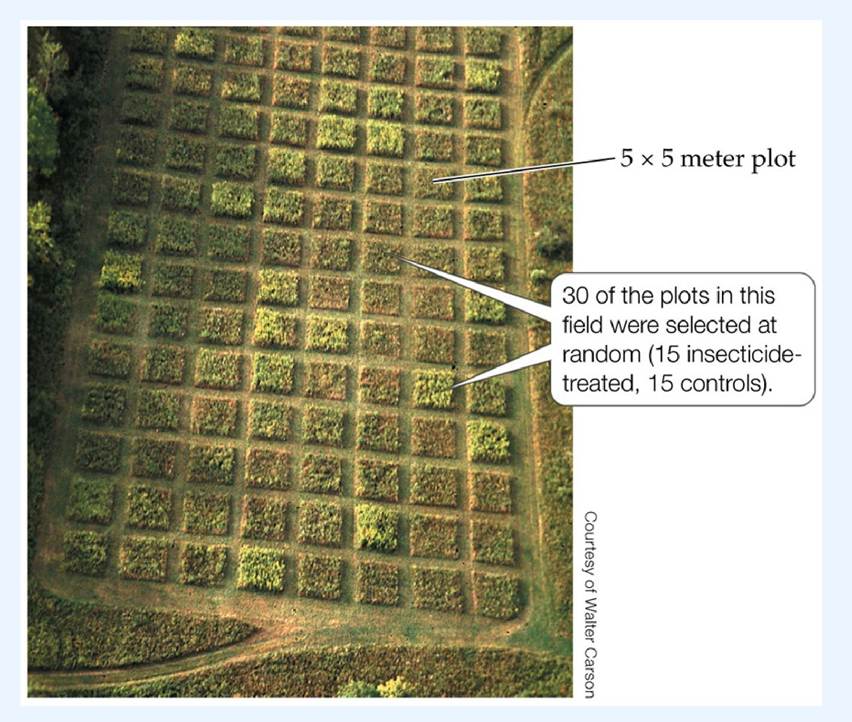
FIGURE A Carson and Root's Field Experiment This aerial photograph shows the field divided (by mowing) into 112 plots, each 5 ? 5 m. Thirty of these plots were used in the experiment described here; the rest of the plots were used in other experiments. View larger image
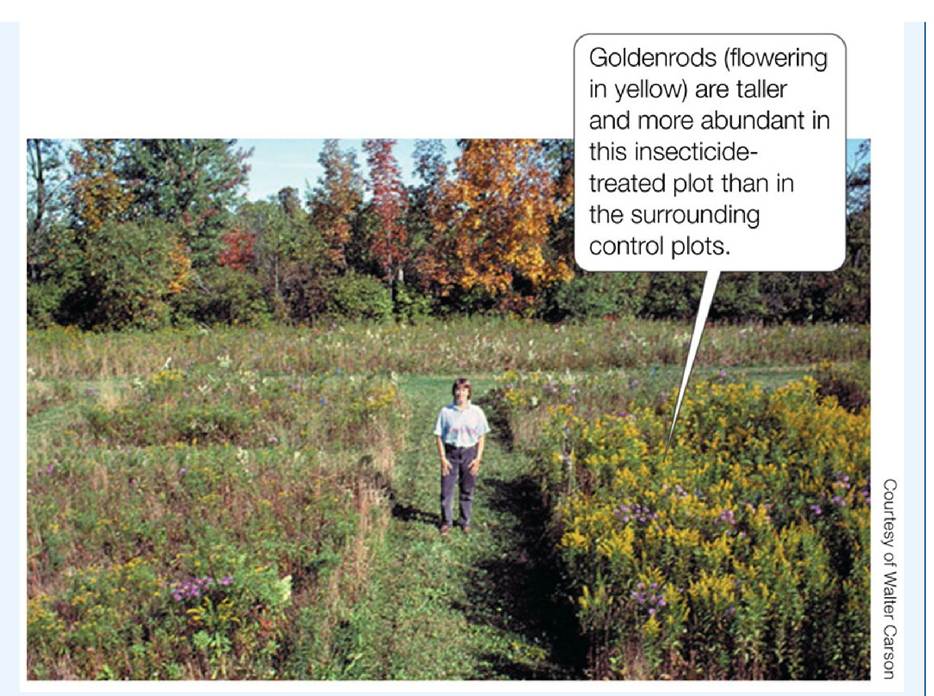
FIGURE B Carson and Root's Results A plot sprayed with insecticide (right) is shown surrounded by several control plots. View larger image
Replication means that each treatment, including the control, is performed more than once. An advantage of replication is that as the number of replicates increases, it becomes less likely that the results are due to a variable that was not measured or controlled in the study. Imagine that Kiesecker had performed his field experiment with only two ponds, one with detectable levels of pesticides and the other without. Suppose he had found that frog deformities were more common in the single pond that contained pesticides. While pesticides might have been responsible for this result, the two ponds could have differed in many other ways, too, one or more of which might have been the real cause of the deformities. By using three ponds with pesticides and three ponds without pesticides, Kiesecker made it less likely that each of the three ponds with pesticides also contained something else—some variable not controlled in his experiment—that increased the chance of frog deformities.
In his experiment, Kiesecker accounted for the possible effects of some uncontrolled variables: he showed, for example, that the number of snails and the frequency of their infection by Ribeiroia were similar in all six ponds, thus making it unlikely that the ponds with pesticides had many more Ribeiroia than the ponds without pesticides.Ecologists also seek to limit the effects of unmeasured variables by assigning treatments at random. Suppose an investigator wanted to test whether insects that eat plants decrease the number of seeds the plants produce. One way to test this idea would be to divide an area into a series of plots (see Ecological Toolkit 1.1), some of which would be sprayed regularly with an insecticide (the experimental plots) while others would be left alone (the control plots). The decision about whether a particular plot would be sprayed (or not) would be made at random at the start of the experiment. Assigning treatments at random would make it less likely that the plots that receive a particular treatment share other characteristics that might influence seed production, such as high or low levels of soil nutrients.
Finally, ecologists use statistical analyses to determine whether their results are “significant.” To understand why, let's turn again to Kiesecker's experiment. It would have been surprising if Kiesecker had found that rates of frog deformities in ponds with pesticides were exactly equal to those in ponds without pesticides. But how different would those rates have to be to show that the pesticides are having an effect? Since the results of different experimental treatments will rarely be identical, the investigator must ask whether an observed difference is due to the experimental treatments and not to chance. Statistical methods are often used as a standardized way to help make this decision. There are many different types of statistical analyses; books such as those by Zar (2009), Sokal and Rohlf (2011), and Gotelli and Ellison (2013) provide examples of which statistical methods to use under various circumstances.