Introduction
In this chapter we will broaden the spatial scale of our view of ecology to take a landscape perspective. This broader view is facilitated by a powerful assemblage of tools that permit us to monitor the environment in multiple dimensions and at many scales.
For example, the emergence of aerial photography gave ecologists a technique to examine “the big picture.” Similarly, our ability to acquire images of Earth through remote sensing, from drones to satellites, has permitted the interpretation of many large-scale ecological patterns, including global patterns of net primary production (see Ecological Toolkit 20.1). The use of geographic information systems (GIS), methods used to visualize and analyze spatial data, has become standard in landscape planning efforts, whether for urban development or for conservation (ECOLOGICAL TOOLKIT 24.1). In the field, handheld global positioning systems (GPS) have permitted ecologists to document precise locations and integrate them with other landscape variables through GIS. Radiotelemetry and animal-borne GPS tracking devices have greatly enhanced our ability to follow animal movements and migration patterns, again with the help of GIS. Our ability to analyze all this information is constantly growing, thanks to better computers and new statistical methods of spatial analysis.ECOLOGICAL TOOLKIT 24.1
Geographic Information Systems (GIS)
Geographic information systems (GIS) are computer-based systems that allow the storage, analysis, and display of data pertaining to
specific geographic areas. The data used in GIS are derived from multiple sources, including aerial photographs, satellite imagery, and ground-based field studies (FIGURE A). Examples of such data include rainfall, elevation, and vegetation cover at specific locations. Each of these and many other variables may be used in a particular application of GIS—but whatever variables are used, the data are keyed to or referenced by spatial or geographic coordinates so that they can be assembled into a multilayered map.
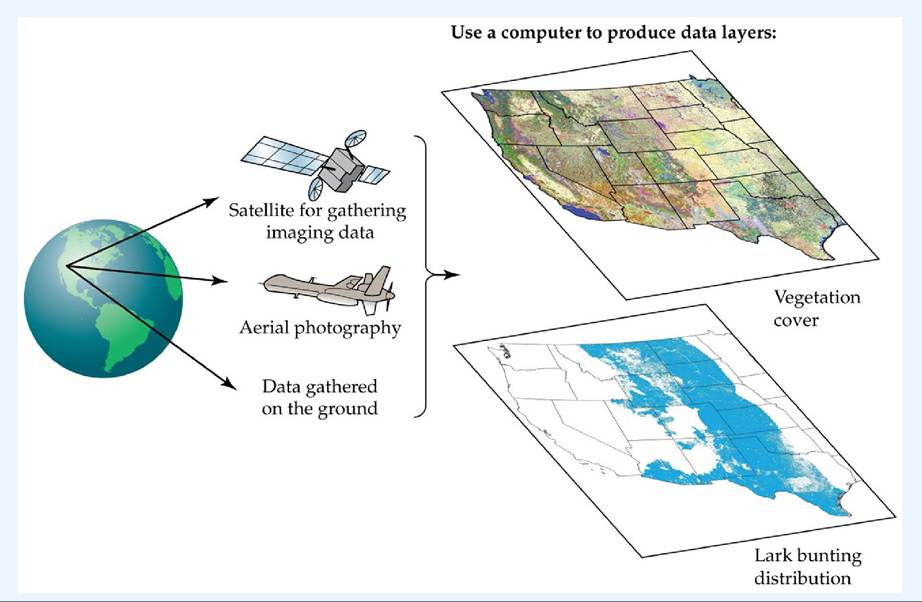
FIGURE A GIS Integrates Spatial Data from Multiple Sources View larger image
Layers of mapped data can be put together in ways that help to address particular questions. We'll illustrate this process with an approach often used in conservation biology, called gap analysis.
The acronym GAP refers to the Gap Analysis Program, a U.S. Geological Survey program whose mission is to help prevent biodiversity decline by identifying species and communities that are not adequately represented on existing conservation lands.
The lark bunting (Calamospiza melanocorys) is one such species. It depends on prairie habitat for its breeding grounds, but much of this habitat has been destroyed by conversion to agriculture. As a result, populations of the lark bunting have been declining by an average of 1.6% per year over the past 40 years, making it a species of conservation concern (U.S. Fish and Wildlife Service 2008).
For the lark bunting, or any other species, gap analysis is a two- step process. First, data on vegetation cover (see the top GIS layer in Figure A) and on other environmental conditions required or preferred by the lark bunting are used to predict its geographic distribution (the second GIS layer in Figure A). Next, that predicted distribution is compared with a third GIS layer showing the locations of conservation lands and protected areas. By combining these two layers, we can calculate that only a small percentage of the bird's distribution is protected (FIGURE B). Such information is critical to decisions about what lands should be protected to prevent future losses of biodiversity.
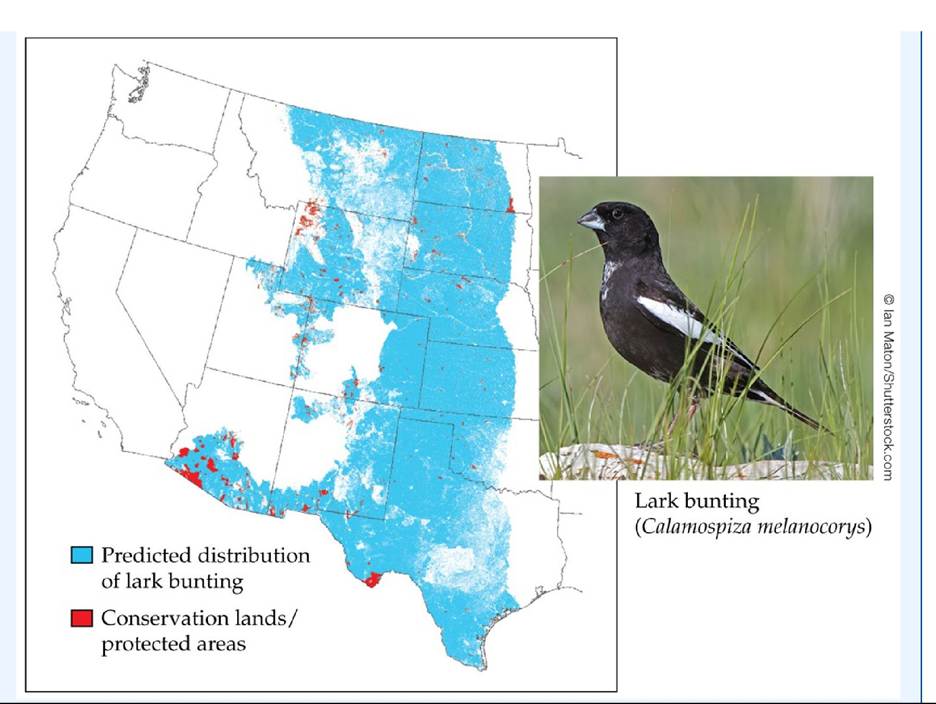
FIGUREB A Conservation Gap Less than 3% of the lark bunting's predicted distribution is in protected areas. (Maps courtesy of U.S.G.S. Gap Analysis Project. https://doi.org/10.5066/F7V122T2 and https://doi.org/10.5066/F7ZS2TM0.) View larger image
We saw in Concept 23.3 that habitat loss, fragmentation, and degradation are primary causes of the current declines in biodiversity. In this chapter, we'll see how the tools and methods of landscape ecology are used to assess the occurrence and possible causes of biodiversity declines at the landscape and ecosystem scales. Because protected natural areas are at the heart of conservation strategies, we will also consider how conservation biologists identify and design them to maximize their effectiveness. Finally, we'll examine how ecosystem management integrates ecological principles with social and economic information to help guide decisions about land and water use.
More on the topic Introduction:
- 1 Introduction
- Introduction
- Introduction
- 19 Introduction
- Introduction
- Introduction
- INTRODUCTION
- Introduction
- Introduction
- Introduction
- Introduction
- Introduction: Hegel, Marx and the Dialectic
- INTRODUCTION: OVERVIEW OF COMPLICATIONS ASSOCIATED WITH HIV THERAPY