Nutrients in lakes cycle efficiently in the water column
Lake ecosystems receive inputs of nutrients from streams, by atmospheric deposition and nitrogen fixation, and as litter falling from adjacent terrestrial ecosystems. Biological demand for nutrients is highest in the photic zone, where phytoplankton are suspended in the water column, and in the shallow zones at the margins of the lake, where rooted aquatic plants are found.
Phosphorus and sometimes nitrogen limit primary production in lakes. Nutrient transfers between trophic levels, like energy transfers (see Figure 21.5C), are very efficient in lakes. Some detritus is decomposed and mineralized in the water column and in sediments in the shallow zones, providing an internal input of nutrients. Nitrogen fixation by cyanobacteria occurs in the photic zone, particularly when demand for nitrogen by organisms is greater than for phosphorus. Rates of nitrogen fixation in lake ecosystems are similar to those in terrestrial ecosystems.Over time, nutrients are progressively lost from the photic zone of a lake. Dead organisms sink through the water column and are deposited in the sediments of the benthic zone. These sediments are characterized by hypoxic conditions that limit decomposition, and by a reducing chemical environment that may change the chemical form of some nutrients. Iron, for example, is often reduced from Fe3+ to Fe2+, contributing to the dark color of lake sediments. Denitrification is also promoted by the low oxygen concentrations in the sediments, and bacteria may reduce sulfate (SO42-) to hydrogen sulfide (H2S).
Decomposition in the benthic sediments cannot provide nutrients to the photic zone unless there is mixing of the water column. In stratified temperate-zone lakes, as we saw in Concept 2.5, this mixing occurs in fall and spring, when the lake's water becomes isothermal throughout and wind facilitates its turnover.
This seasonal turnover brings dissolved nutrients from the bottom water to the surface layers, along with detritus that may be subsequently decomposed by bacteria. Mixing of water layers is less common in tropical lakes, so external inputs of nutrients may be more important for maintaining production in those lakes.
Lake ecosystems are often classified according to their nutrient status. Nutrientpoor waters with low primary productivity are referred to as oligotrophic, while nutrient-rich waters with high primary productivity are referred to as eutrophic. Mesotrophic waters are intermediate in nutrient status between oligotrophic and eutrophic waters. The nutrient status of a lake is the result of natural processes associated with climate and with lake size and shape. For example, lakes in high mountain areas are typically oligotrophic because of their short growing season, low temperatures, and tendency to be deep with a low surface-area-to-volume ratio, which constrains the rate of nutrient input relative to the volume. In contrast, shallow lakes at lower elevations or in the tropics tend to be eutrophic because of their warmer temperatures and higher nutrient availability.
The nutrient status of a lake tends to shift naturally from oligotrophic to eutrophic over time. This process, known as eutrophication, occurs as sediments accumulate on the lake bottom (FIGURE 22.17). As the lake becomes shallower, its summer temperatures become warmer, more decomposition occurs, nutrient pools and the amount of mixing increase, and the lake becomes more productive. Human activities have accelerated the process of eutrophication in many lakes through discharges of sewage, agricultural fertilizers, and industrial wastes containing high concentrations of nitrogen and phosphorus. For example, the water of Lake Tahoe, on the border between Nevada and California, has lost much of its clarity because of increased inputs of phosphorus and nitrogen from streams, groundwater, and surface runoff from neighboring communities.
Water clarity, which is used as an indicator of a lake's nutrient status, is primarily determined by the density of plankton in the water column. It can be measured using a Secchi disk, a black-and-white circular plate that is lowered gradually into the water; the maximum depth at which the disk can be seen is referred to as the depth of clarity. Over the past 3 decades, the average depth of clarity in Lake Tahoe has risen by 10 m (Murphy and Knopp 2000). The rate at which water clarity has been declining has slowed since 2000, partly because of lower amounts of precipitation as well as lower concentrations of nutrient pollutants in streams draining into the lake.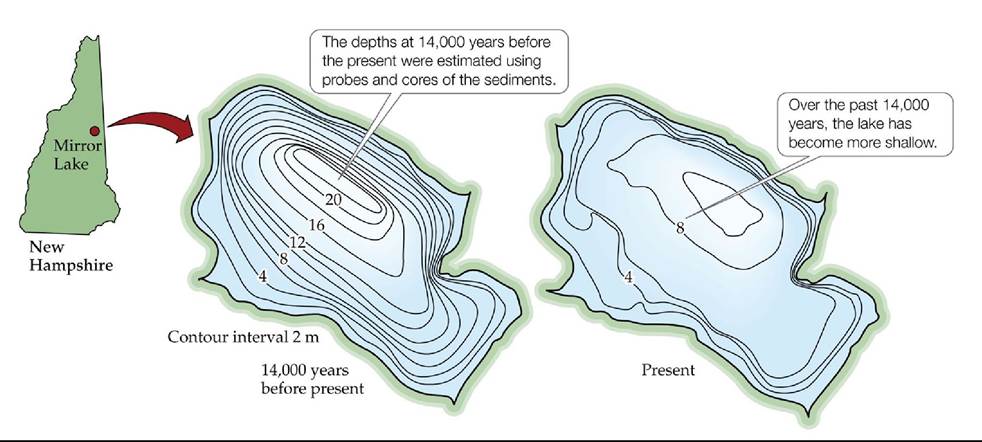
FIGURE 22.17 Lake Sediments and Depth Sediments accumulate at the bottom of a lake over time, making it progressively shallower and leading to eutrophication. Changes in the depth contours of Mirror Lake in New Hampshire show the accumulation of sediments there over the past 14,000 years. (After M. B. Davis et al. 1985. In An Ecosystem Approach to Aquatic Ecology: Mirror Lake and Its Environment, G. E. Likens [Ed.], pp. 345-366. Springer: New York.) View larger image
Anthropogenic eutrophication can be reversed if the discharge of wastes into surface waters is decreased. A classic example of such a reversal occurred in the 1960s and 1970s in Lake Washington, near Seattle. Treated sewage, containing high concentrations of phosphorus, was released into Lake Washington beginning in the late 1940s as neighborhoods and accompanying sewage
FIGURE 22.18 LakewashingtoniReversalofFortune Inputsoftreatedsewagebetween the 1940s and the 1960s caused eutrophication in Lake Washington; cessation of sewage inputs between 1963 and 1968 increased lake clarity. (A) Phosphorus inputs. (B) Measurements of water clarity made with a Secchi disk.
While the story of Lake Washington seems to be a clear “experimental” demonstration of pollution influencing the nutrient status of a lake, what would make it an even more convincing example?
(After W. T. Edmondson and A. H. Litt. 1982. Limnol Oceanogr 27: 272-293.) View larger image