AF Class Measures Used with Cardinal Variables
In this chapter, our discussion has focused on the Adjusted Headcount Ratio as many poverty indicators in practice are of ordinal scale. However, if all indicators are cardinal, we can go beyond the Adjusted Headcount Ratio to measures that additionally reflect the depth of deprivations poor people experience below the deprivation cutoff in each dimension.
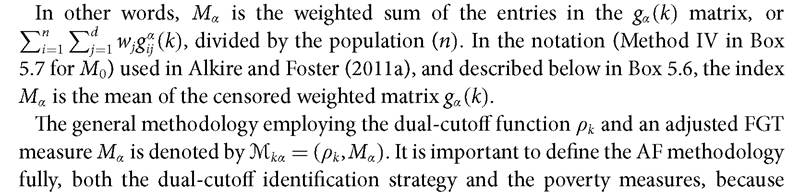
The identification step proceeds in exactly the same way as with M0. The difference is in the aggregation step. This section introduces the normalized gap matrix, which is used for the aggregation step for all the Mα class of measures with a > 0. The section also presents the two most common members of the Mα class with a > 0: M1 and M2.5.7.1 Thenormalizedgapmatrix
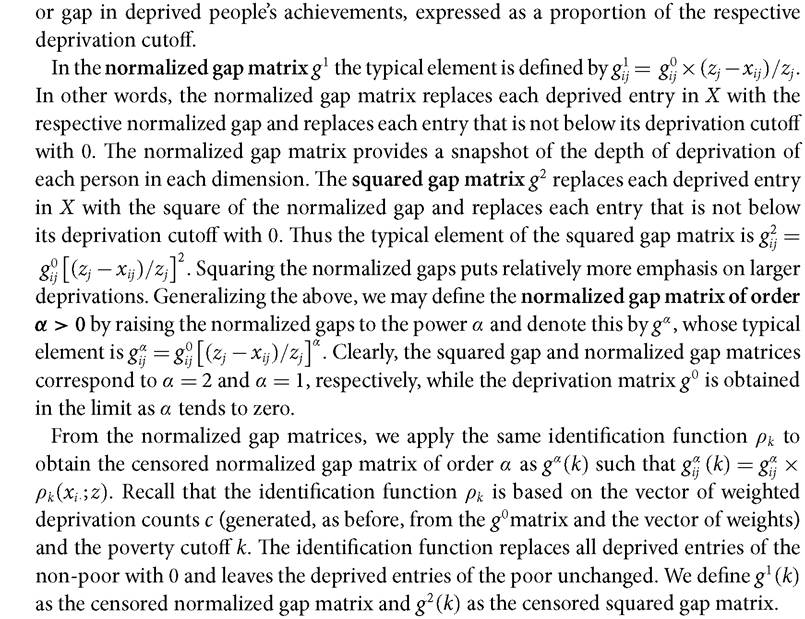
The basic matrix for measures drawing upon cardinal data is the normalized gap matrix, which, like the deprivation matrix, is constructed from the achievement matrix and the vector of deprivation cutoffs. The entries in the normalized gap matrix are the shortfall
5.7.2 THE ADJUSTED POVERTY GAP, ADJUSTED FGT, ANDMα MEASURES
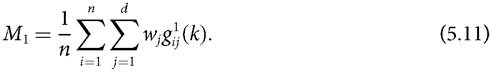
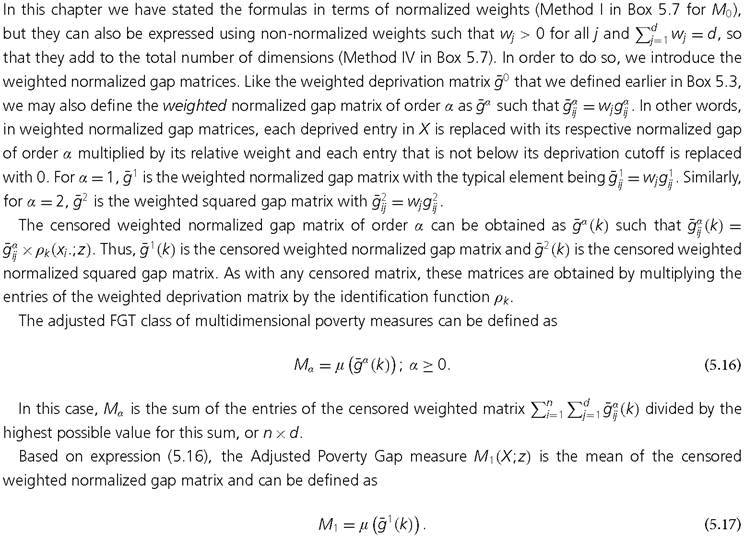
The Adjusted Poverty Gap measure M1 (X; z) can be defined as
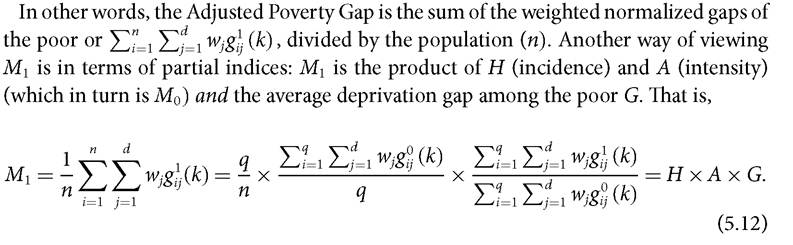
In words, G is the average value of the normalized gap among all instances in which any poor person is deprived (and hence where the censored normalized gap is positive). Thus, G provides information on the average depth of deprivations across all poor and deprived states.
As in the case of M0, the partial indices greatly aid in comparing multidimensional poverty across time and space.
Suppose for example that M1 is higher in one region than in another. It could be useful to examine the extent to which the difference is due to a higher H, or to higher values of A or G. It is also possible to examine the average gaps for each dimension to identify the dimensions in which normalized gaps tend to be higher.Under methodology (ρk,M1), if the deprivation of a poor person deepens in any dimension, then the respective g1 (k) will rise and hence so will M1. Consequently, (ρk, M1) satisfies the property of monotonicity.
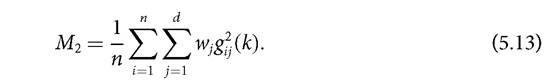
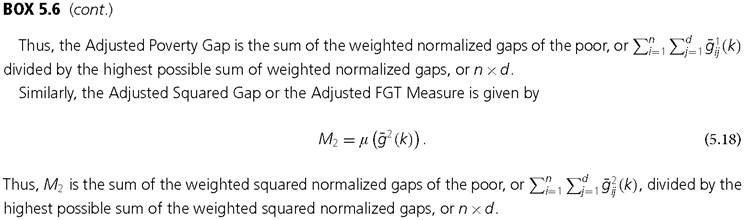
To incorporate sensitivity to one form of inequality among the poor, as embodied by the transfer property defined in section 2.5, we turn to the censored matrix g2(k) of squared normalized shortfalls. The Adjusted Squared Gap measure or Adjusted FGT Measure M2 (X; z) can be defined as
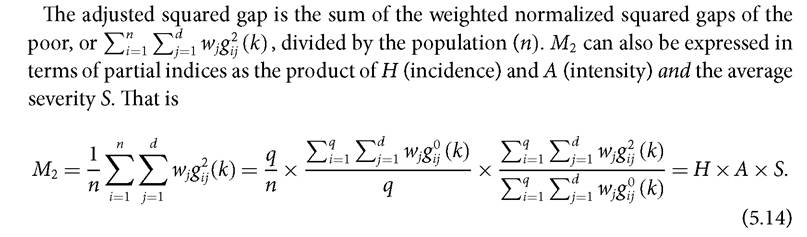
S is the average squared gap (or severity) among all instances where a poor person is deprived (and hence where the censored squared gap is positive). By taking the square of the normalized gaps, S places relatively greater emphasis on the larger gaps. Therefore, under (ρk, M2), a given-sized increase in a deprivation of a poor person will have a greater impact the larger the initial level of deprivation. Consequently, the methodology satisfies the weak transfer property and is sensitive to the inequality with which deprivations are distributed among the poor. 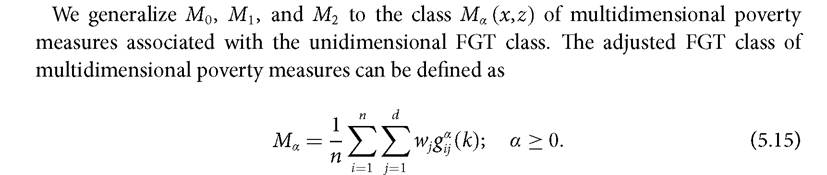
it is this combined methodology which assures that the resulting measures satisfy the principles here specified.
As stated in section 3.6.1 and as a way to wrap up this chapter, it is worth recalling that all measures in the AF family satisfy symmetry, replication invariance, scale invariance, poverty focus, deprivation focus, normalisation, non-triviality, weak and dimensional monotonicity, population subgroup decomposability, weak deprivation rearrangement, and dimensional breakdown. For α = 0, the measure satisfies the ordinality property, making it suitable for implementation when at least some of the indicators used are of ordinal scale. For α > 0, the measures require all indicators to be cardinal. When α > 0, the measures satisfy monotonicity. When α ≥ 1, the measures satisfy weak transfer. When the union criterion is used for identification and a > 0, the measures satisfy continuity.
BOX 5.6 AN ALTERNATIVE PRESENTATION OF M MEASURES USING NON-NORMALIZED WEIGHTS
5.8