CONCLUSION AND FUTURE RESEARCH
Putting the literature on the distribution of (individual) wages in the context of the (household) income distribution we are struck by the disconnect between the two. There is an extensive literature with a long tradition on each of them but very little on both, despite the fact that wage earnings are by far the most important source of income in modern society.
The strong shift from single-earner to dual-earner households that has come about with the rapid growth of female and in many cases part-time employment and the growing attention paid to the phenomenon of household joblessness make this an important lacuna. Significant policy implications may be suspected. The debate on household joblessness has already put into question the workings of labor market policies. The important debate on job polarization ignores how households may be affected or, alternatively, how they may offer compensation for the process. The interlinking of the two distributions raises doubts about the policies of redistribution. Traditional instruments found on each of the two sides, such as the minimum wage or income taxation, expectedly work out differently in a dual-earner world where household labor supply can involve low-paid jobs or low (part-time) earnings even at high levels of household income. As a result, the effects of these instruments will change and their political support in society may also be altered. Future research will require improved and systematic fact finding, the analysis will generate a better understanding of earnings as well as hours of work on an annual basis, consistent with incomes, and also broaden to include other, often newly minted institutions that affect joint household labor supply, such as child care provisions. There is no shortage of detailed research on various issues; however, the broad picture of the distributions as such is lacking. Connections run in both directions, from earnings to incomes as much as the other way around, and household formation and concomitant household labor supply cannot be taken as a given but are affected by both. Importantly, often the national work force has also doubled over recent decades, as a result of rapidly rising educational attainment and female labor market participation, and not only the global work force after the demise of communism.Subsequently turning to the distribution of wages alone we have gone back to the origins of the debate in the early 1980s and sketched developments toward what is now a large and complex literature. We find that the unanticipated rise in earnings inequality in the United States over the 1970s put LMIs, such as (declining) unionization, as one possible explanation among others, such as demography or deindustrialization, on the research agenda. During the 1990s, the debate gave rise to the thesis of skill-biased technological change but also to international comparisons. The former approach has focused on market forces of supply and demand, the latter deemed those insufficient because of the growing international divergence in wage-inequality trends and has put the limelight on the role of national LMIs. After some leapfrogging of the two approaches from one consensus explanation to another during the 1990s, the two seem to be increasingly growing apart during the 2000s when important new contributions were made to the disadvantage of an integrated approach that could give each its proper place. Both sides may be at risk of creating “Ptolemaic epicycles” aimed to incorporating new observations. The supply-and-demand approach is challenged by the need for finding better empirical measures of technological change aimed at dispelling doubts that the relative demand of skills may be a tautology. It has added “tasks,” “offshoring,” and even “consumer preferences,” which risk being ad hoc additions,1 without realizing their
150
Compare Autor’s (2013, 25) remark “that there are almost as many distinct task classifications as there are papers in the task literature.”
institutional preconditions.
The institutional approach, on the other side, faces an abundance ofinstitutions and ever new ones are added. It lacks a sufficiently clear-cut concept of institutions, ranging from laws, regulations, and habits to actual policies, and of their interactions—be they mutually reinforcing or compensating—on the one hand, and a clear criterion for delineating the institutional scope on the other hand.In light of this, the double aim of future work on both sides should be to foster itself and to integrate the other side into its own framework at the same time. Pursuing this may seem more a problem of empirical method for the institutional side, although by contrast on the demand and supply side the problem may be more one of theoretical method as long as institutions keep being viewed as bodies alien to the market and to theorizing. For both sides there is a perspective of work to do at the firm level. Matched employer— employee data can help enlighten the role of both institutions as well as labor supply and demand. Such data are increasingly becoming available. This brings us back to the availability and quality of the data in addition to the earnings/incomes fact-finding already mentioned. Data and analysis shall move beyond the commonly used earnings data for full-time workers only, which are less and less representative especially at the margins of earnings and incomes. Therefore, more needs to be done regarding individuals’ and households’ work efforts and earning outcomes on an annual basis. In addition, though much attention has been paid to data quality, a better grasp of the customary use of inequality measures—currently, each of the two approaches has its own rather exclusive preferences—seems desirable.
Finally, we have set up a simple model accounting for the correlation of the different components of inequality (between and within) with LMIs. We find indeed that unionized labor markets are ceteris paribus less unequal in terms of annual earnings, because both hourly wages and worked hours are more evenly distributed.
We improve on existing approaches with the help of a pseudo-longitudinal approach linking workers cohort-wise to the change in institutions over their working life in three different ways. Empirical results of three cross-country exercises focusing on different inequality measures and covering the United States and all European countries in 2010-2011, suggest inequality-reducing effects of unionization for hours, and of minimum wages for both hours and earnings.ACKNOWLEDGMENTS
We are grateful to Christina Haas, John Schmitt, Thomas Lemieux, Nicola Fuchs-Schiindeln for their help with the data and Anna Salomons for some useful suggestions. We thank in particular our editors, Tony Atkinson and Francois Bourguignon, for their very helpful comments and suggestions.
APPENDIX A. COUNTRY CODES
| ISO alpha-3 and alpha-2 country codes | ||
| AUS | AU | Australia |
| AUT | AT | Austria |
| BEL | BE | Belgium |
| BGR | BG | Bulgaria |
| CAN | CA | Canada (BC: British Columbia, ON: Ontario) |
| CHE | CH | Switzerland |
| CYP | CY | Cyprus |
| CZE | CZ | Czech Republic |
| DEU | DE | Germany |
| DEU-W | DE-W | West Germany |
| DNK | DK | Denmark |
| ESP | ES | Spain |
| EST | EE | Estonia |
| EU | European Union | |
| FIN | FI | Finland |
| FRA | FR | France |
| GRC | GR | Greece (also named EL by Eurostat) |
| HUN | HU | Hungary |
| IRL | IE | Ireland |
| ISR | IL | Israel |
| ITA | IT | Italy |
| JPN | JP | Japan |
| KOR | KR | Korea |
| LTU | LT | Lithuania |
| LUX | LU | Luxemburg |
| LVA | LV | Latvia |
| MLT | bgcolor=white>MTMalta | |
| NLD | NL | Netherlands |
| NOR | NO | Norway |
| NZL | NZ | New Zealand |
| POL | PL | Poland |
| PRT | PT | Portugal |
| ROM | RO | Romania |
| SWE | SE | Sweden |
| SVK | SK | Slovak Republic |
| SVN | SI | Slovenia |
| UK | UK | United Kingdom (official code GBR not used) |
| USA | US | United States |
APPENDIX B.
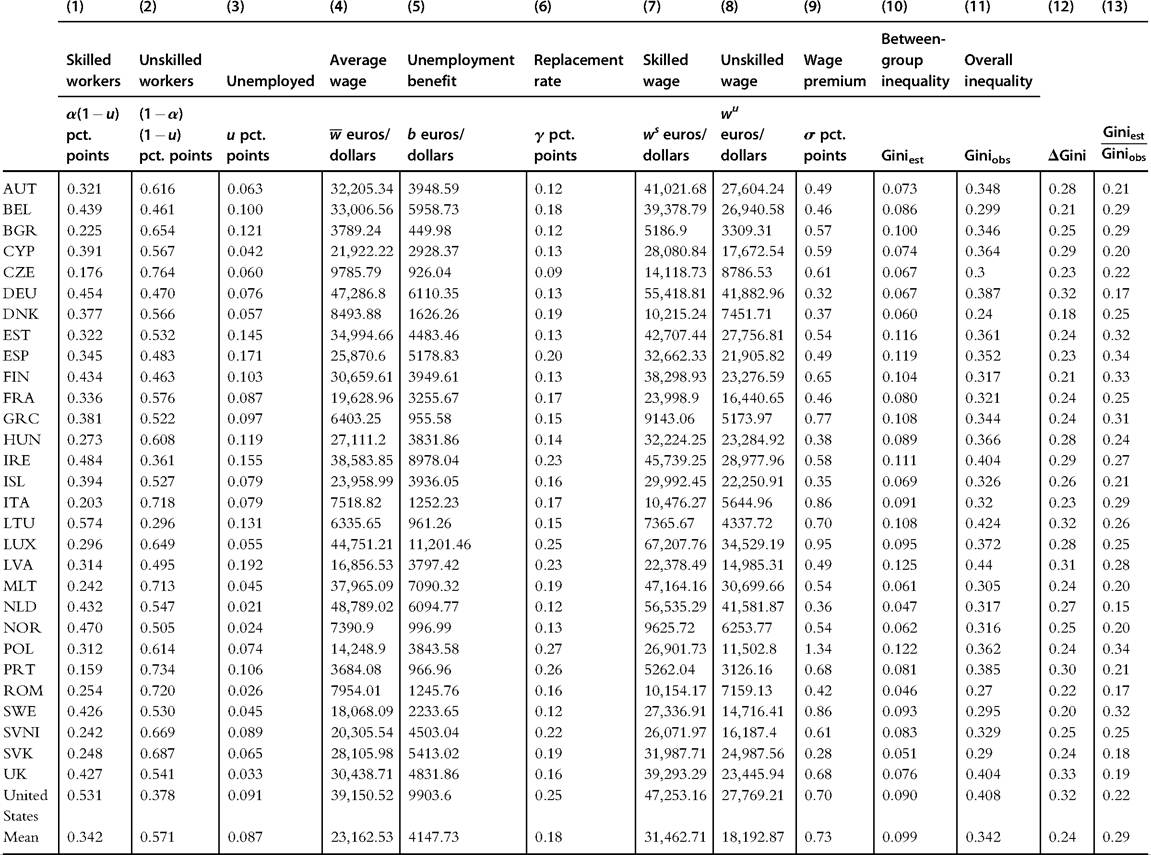
DATA SOURCES AND ADDITIONAL TABLES ON EARNINGSWe obtain data from the EUSILC survey conducted in 2010 (ver.1 dated 01/03/12), to which we added populations from Cyprus and Ireland extracted from the 2009 survey (ver.2 dated 01/08/11). Overall among European countries we consider 476,265 observations (of which 9902 Irish and 7557 Cypriots). For these individuals we know relevant demographics (age, gender, education,[239] marital status, birthplace), occupational characteristics (whether employed or self-employed, full-time or part-time, permanent or temporary contract, ISCO occupational code, workplace size, work experience).
We obtain data on the United States from participants to PSID survey conducted in 2011. Basic demographics (age, gender, education,[240] marital status, labor market status) are obtained from individual file (file ind2011er.zip downloaded on 22/07/13), which includes 24,661 observations. Information on labor earnings are collected from one respondent for each of8907 households (typically a male household head), who responds about wage and hours for himself and his spouse (file fam2011er.zip downloaded on 22/07/13).
We adopt two selection rules:
(a) population in relevant working age, which we define as being between 20 and 64 years old. This is justified to allow for secondary school completion, and to take into account different early retirement rules in different countries. This leads to the exclusion of employed youngsters aged 15—19, a fraction of which is employed with an average hourly wage that is on average half of the average wage in the adult population. Because countries differ in the duration of compulsory education as well as in institutional design, we have preferred to leave the youngster component of the labor force out of our analysis.[241]
(b) population in the labor market, who self-define as either employed (employee or self-employed) or unemployed. This takes as exogenously given the significant cross-country differences in participation/employment rates (see Table 18.A1).
These differences are even enhanced when we consider analogous rates computed at household level. Notice the high share of self-employed in Italy and Greece, which are also the countries where the share of top incomes accruing to them is largest. The final sample is made of 264,216 individuals in the labor market, among which 201,500 employees, 33,384 self-employed, and 29,332 unemployed.The labor earnings variable is defined as either “gross yearly earnings from dependent employment—cash or near cash”[242] or “gross yearly cash benefits or losses from selfemployment” (see Table 18.A2 for means and standard deviations).[243] Unemployed subsidies received by (temporarily) unemployed workers are also considered in the computation of earnings inequality.[244]
In order to distinguish between annual earnings and hourly wages, we need information about the number of hours worked. In both survey hours worked are reconstructed thanks combining answers to two questions (weekly hours usually worked in recent months—thus referred to the period of interview—and number of months worked in the previous year).[245] The gross hourly wage rate is then computed dividing the yearly earnings by the hours worked.[246] Descriptive statistics on hours worked and hourly wages are reported in Table 18.A3. Notice that there is a significant loss of information when moving from yearly data (259,500 observations with nonnegative annual earnings) to hourly wage (228,153 observations with nonmissing hourly wages), due to missing information about weekly hours worked. A probit estimate indicates that young uneducated women holding a temporary contract are more likely not to report hours.
Table 18.A1 Descriptive statistics computed from microdata—SILC 2010 and PSID 2011—labor market attachment (sample weights)
Female
| Participation rate | Employment rate | Unemployment rate | Share selfemployed | participation rate | |
| Austria | 0.734 | 0.676 | 0.079 | 0.124 | 0.596 |
| Belgium | 0.732 | 0.650 | 0.112 | 0.106 | 0.597 |
| Bulgaria | 0.800 | 0.670 | 0.163 | 0.096 | 0.620 |
| Cyprus | 0.754 | 0.710 | 0.058 | 0.139 | 0.644 |
| Czech | 0.752 | 0.675 | 0.103 | 0.167 | 0.582 |
| Republic Denmark | 0.782 | 0.715 | 0.085 | 0.094 | 0.702 |
| Estonia | 0.783 | 0.647 | 0.173 | 0.074 | 0.648 |
| Finland | 0.765 | 0.673 | 0.121 | 0.135 | 0.650 |
| France | 0.754 | 0.672 | 0.109 | 0.099 | 0.637 |
| Germany | 0.792 | 0.711 | 0.102 | 0.055 | 0.659 |
| Greece | 0.736 | 0.644 | 0.125 | 0.304 | 0.553 |
| Hungary | 0.687 | 0.595 | 0.134 | 0.124 | 0.542 |
| Iceland | 0.789 | 0.731 | 0.073 | 0.125 | 0.685 |
| Ireland | 0.707 | 0.592 | 0.162 | 0.149 | 0.532 |
| Italy | 0.682 | 0.607 | bgcolor=white>0.1090.219 | 0.485 | |
| Latvia | 0.791 | 0.602 | 0.239 | 0.071 | 0.593 |
| Lithuania | 0.804 | 0.649 | 0.193 | 0.100 | 0.662 |
| Luxembourg | 0.739 | 0.692 | 0.063 | 0.078 | 0.609 |
| Malta | 0.632 | 0.593 | 0.063 | 0.136 | 0.423 |
| Netherlands | 0.760 | 0.732 | 0.037 | 0.154 | 0.660 |
| Norway | 0.797 | 0.771 | 0.033 | 0.073 | 0.741 |
| Poland | 0.716 | 0.640 | 0.105 | 0.214 | 0.571 |
| Portugal | 0.788 | 0.672 | 0.148 | 0.144 | 0.617 |
| Romania | 0.689 | 0.653 | 0.053 | 0.265 | 0.547 |
| Slovak | 0.764 | 0.660 | 0.137 | 0.108 | 0.603 |
| Republic Slovenia | 0.737 | 0.633 | 0.141 | 0.096 | 0.587 |
| Spain | 0.787 | 0.624 | 0.207 | 0.161 | 0.546 |
| Sweden | 0.823 | 0.776 | 0.057 | 0.043 | 0.751 |
| United | 0.768 | 0.728 | 0.052 | 0.122 | 0.677 |
| Kingdom United | 0.791 | 0.709 | 0.104 | 0.109 | 0.683 |
| States Average | 0.752 | 0.671 | 0.108 | 0.138 | 0.605 |
Table 18.A2 Descriptive statistics computed from microdata—SILC 2010 and PSID 2011-labor earnings (sample weights)
Gross
| Country name | Gross earnings from dependent employment (mean) | earnings from dependent employment (SD) | Gross earnings from selfemployment (mean) | Gross earnings from selfemployment (SD) | No. of observations with nonmissing values on yearly earnings |
| Austria | 26,461.08 | 25,858.63 | 4096.55 | 17,355.84 | 6116 |
| Belgium | 26,723.36 | 20,772.17 | 2717.21 | 11,508.15 | 6387 |
| Bulgaria | 3024.31 | 2925.93 | 446.67 | 2378.81 | 7731 |
| Cyprus | 18,748.41 | 16,532.35 | 3139.14 | 13,762.04 | 3970 |
| Czech | 7499.50 | 6937.02 | 1752.81 | 6380.98 | 9489 |
| Republic Denmark | 38,504.27 | 26,550.36 | 2017.71 | 18,497.89 | 7005 |
| Estonia | 7507.27 | 6367.43 | 122.38 | 959.08 | 5891 |
| Finland | 27,382.17 | 21,351.46 | 2076.83 | 10,272.64 | 12,705 |
| France | 22,219.13 | 19,263.07 | 2110.23 | 15,184.50 | 11,518 |
| Germany | 24,586.15 | 22,526.16 | 1968.18 | 14,598.60 | 12,693 |
| Greece | 12,219.81 | 14,306.38 | 5645.76 | 18,567.37 | 7163 |
| Hungary | 5038.98 | 5062.23 | 777.84 | 3393.05 | 10,240 |
| Iceland | 23,832.86 | 17,620.38 | 818.24 | 3899.32 | 4075 |
| Ireland | 26,624.65 | 28,929.35 | 4520.33 | 19,799.64 | 4766 |
| Italy | 17,593.58 | 17,522.40 | 7017.56 | 24,495.35 | 19,637 |
| Latvia | 5942.19 | 6430.71 | 207.53 | 1370.13 | 6742 |
| Lithuania | 4979.52 | 5607.18 | 447.30 | 2589.25 | 6097 |
| Luxembourg | 42,588.71 | 38,248.88 | 2896.52 | 22,171.74 | 5717 |
| Malta | 13,787.59 | 11,406.58 | 2393.88 | 8493.19 | 3678 |
| Netherlands | 31,138.58 | 26,156.98 | 3186.18 | 16,507.76 | 11,621 |
| Norway | 42,686.63 | 32,290.34 | 3409.42 | 23,335.28 | 6269 |
| Poland | 5567.64 | 6017.03 | 1020.09 | 3613.49 | 14,693 |
| Portugal | 10,768.63 | 12,283.16 | 1432.51 | bgcolor=white>6260.985655 | |
| Romania | 2664.20 | 2452.14 | 333.46 | 1338.79 | 7342 |
| Slovak | 6322.45 | 8057.32 | 683.42 | 2971.25 | 8071 |
| Republic Slovenia | 14,493.82 | 12,900.63 | 1125.57 | 4699.40 | 14,085 |
| Spain | 14,620.40 | 14,235.10 | 1305.97 | 7504.83 | 16,812 |
| Sweden | 25,384.12 | 18,901.72 | 753.78 | 5208.48 | 8355 |
| United | 24,787.20 | 28,023.56 | 3654.77 | 26,042.01 | 7818 |
| Kingdom United | 51,786.79 | 840,084.88 | 7103.13 | 35,807.86 | 7159 |
| States Average | 18,819.88 | 32,903.78 | 2627.03 | 16,288.20 | 259,500 |
Note: Data in 2010 Euros except US where data are in 2011 US dollars.
Table 18.A3 Descriptive statistics computed from microdata—SILC 2010 and PSID 2011—hours and wages (sample weights)
| Hours worked (mean) | Hours worked (SD) | Hourly wage (mean) | Hourly wage (SD) | No. of observations with nonmissing values of hourly wages | |
| Austria | 1801.05 | 648.58 | 17.14 | 25.54 | 5689 |
| Belgium | 1742.40 | 630.42 | 18.74 | 16.46 | 5662 |
| Bulgaria | 1924.69 | 413.00 | 1.83 | 1.67 | 6381 |
| Cyprus | 1844.24 | 527.32 | 10.67 | 8.73 | 3743 |
| Czech | 1979.71 | 489.53 | 4.23 | 3.29 | 8685 |
| Republic Denmark | 1752.24 | 449.20 | 24.02 | 15.45 | 6615 |
| Estonia | 1761.99 | 498.25 | 5.22 | 5.93 | 4795 |
| Finland | 1718.94 | 558.07 | 19.46 | 21.05 | 11,479 |
| France | 1746.34 | 617.55 | 15.20 | 18.75 | 10,223 |
| Germany | 1746.93 | 619.15 | 15.24 | 11.98 | 11,569 |
| Greece | 1829.68 | 553.70 | 7.96 | 8.64 | 6212 |
| Hungary | 1844.58 | 403.42 | 3.05 | 2.71 | 8876 |
| Iceland | 1914.37 | 642.18 | 14.38 | 19.49 | 3783 |
| Ireland | 1637.80 | 693.63 | 22.17 | 29.44 | 3917 |
| Italy | 1829.60 | 474.38 | 11.17 | 10.77 | 17,248 |
| Latvia | 1816.58 | 487.95 | 4.07 | 4.06 | 5092 |
| Lithuania | 1784.31 | 415.07 | 3.38 | 3.41 | 4995 |
| Luxembourg | 1833.12 | 576.49 | 25.13 | 20.55 | 5311 |
| Malta | 1863.97 | 517.44 | 8.22 | 7.08 | 3353 |
| Netherlands | 1582.64 | 553.61 | 21.33 | 19.91 | 11,212 |
| Norway | 1765.72 | 504.90 | 25.81 | 21.14 | 6043 |
| Poland | 1894.65 | 517.62 | 3.40 | 4.36 | 13,077 |
| Portugal | 1866.69 | 470.88 | 7.02 | 7.65 | 4281 |
| Romania | 1950.27 | 352.44 | 1.46 | 1.24 | 6589 |
| Slovak | 1913.54 | 395.13 | 3.81 | 4.11 | 7180 |
| Republic Slovenia | 1897.84 | 415.46 | 8.76 | 7.16 | 12,131 |
| Spain | 1821.19 | 536.07 | 10.32 | 10.42 | 12,783 |
| Sweden | 1516.64 | 496.22 | 19.80 | 24.18 | 7755 |
| United | 1785.60 | 637.22 | 15.39 | 19.19 | 7328 |
| Kingdom Unites States | 1937.14 | 848.38 | 8.65 | 26.66 | 6146 |
| Average | 1793.65 | 564.99 | 12.37 | 15.44 | 228,153 |
Note: Data in 2010 Euros except US where data are in 2011 US dollars.
Table 18.A4 Estimates of model relevant parameters—employed or unemployed individuals—SILC 2010 and PSID 2011
APPENDIX C. DATA SOURCES AND DESCRIPTIVE STATISTICS ON LMIs
Data on institutional measures were collected over a time interval spanning half a century, from 1960 to 2010.
Union density
It measures the fraction of wage and salary earners who are members of trade unions. It excludes unemployed and retired workers (net version). Source: ICTWSS database version 2 (Database on Institutional Characteristics of Trade Unions, Wage Setting, State Intervention and Social Pacts in 34 countries between 1960 and 2007—see Visser, 2009—variable Ud—downloaded on 04/04/13).[247]
Coverage
It measures the fraction of employees covered by wage-bargaining agreements over all wage and salary earners in employment with the right to bargaining. Source: ICTWSS database version 2 (variable AdjCov).
Wage centralization
It represents a summary measure (ranging between 0 and 1) of centralization and coordination of union wage bargaining, taking into account both union authority and union concentration at multiple levels—source: ICTWSS database version 2 (variable CENT).
Strike activity
It measures the days not worked for strikes and lockouts divided by participant worker—total economy. Source is ILO (downloaded on 04/04/13).
Minimum wage
It takes the ratio of the statutory minimum wage relative to mean wage of full-time workers (sometimes known as “Kaitz index”—see Dolado et al., 1996). However this measure does not consider the possibility of differentiation across workers types. For this reason, Aghion et al. (2011) have combined the ratio of the minimum wage to the GDP per capita with an index of stringency derived from ILO.[248] Forthis reason, the variable is set to zero when minimum wage provision is absent. Data are downloaded from the OECD Stats website (except than in the case of Iceland, whose values are taken from Table 5.5 of Danish Technological Institute. Assessment of the Labour Market in Iceland. Contract no. VC/2010/038 Final report—Policy and Business Analysis—April 2011).
Employment protection legislation
The measure we use is provided by OECD, which recently have partially revised their country assessment (OECD, 2012).[249] It measures the stringency of firing regulation and is based on eighteen dimensions of the firing procedure.[250] There is a second series provided by World Bank, which has been used among others such as Botero et al. (2004).[251]
Unemployment benefit
Unemployment insurance and unemployment assistance benefits—gross replacement rate (ratio to the average wage) for a full-time adult worker. The source is OECD historical series, which is available in odd years and imputed using intermediate means in even years. It is the average between single worker and one-earner married couple with two children.[252]
Tax wedge
Average tax wedge (sum of social contributions and income taxes as ratio to the average wage). It considers the average between single worker with no child and one- earner married couple with two children. The source are the estimates from the OECD microsimulation model.
Social expenditure
It measures the expenditure for cash benefits and benefit in kind for social assistance, as percentage of GDP. The source is OECD historical series, which are available on 5-year base, and then interpolated.
Child care
It measures the enrollment rate in early child care and preprimary education (average between age 3, 4, and 5—full- and part-time students) and proxies the availability of child care facilities. Available values for years 2005 and 2010, while intermediate values are interpolated. The source is OECD, Education at a Glance 2012, Table C2.1.
Parental leave
It captures the possibility of reconciling work and fertility, by measuring weeks of paid leave for childbirth. The series is available since 1970. The source is Thevenon and Solaz (2013). Further documentation can be found at http://www.oecd.org/social/ soc/oecdfamilydatabase.htm
Tax treatment of household incomes
This variable aims to capture the potential favorable tax treatment of working couples vis-a-vis individual taxation. It is constructed as the ratio between the average tax rate of single earner family (earning 170% of average wage) and the average tax rate of a two earners family (main earner at average wage and second earner making 67% of average wage). The reported variable consists of a further averaging between two household situation with respect to children (zero children and two children families). A higher value would indicate a favorable treatment of labor market participation of a second earner. Data available since 2001. The underlying data is obtained from the OECD microsimulation model, available at http://stats.oecd.org/Index.aspx? DataSetCode=FIXINCLSA.
Active and passive labor market policies
It considers the public expenditure on active or passive labor market policies as percentage of GDP. It combines two data sources: when available we have been using OECD statistics for homogeneity with other series; otherwise we have resorted to Eurostat, which classifies as actives expenditure categories from 2 to 7 (2. Training—3. Job rotation and job sharing—4. Employment incentives—5. Supported employment and rehabilitation—6. Directjob creation—7. Start-up incentives) and passive expenditure categories 8 and 9 (8. Out-of-work income maintenance and support—9. Early retirement).
Overall means and standard deviations for these variables are reported in Table 18.A5. Country means are reported in table with reference to the most recent decade.
Table 18.A5 Descriotive statistics for institutional measures, sample period 1960-2010, 30 countries
| Variable | No. of observations | Mean | SD | Minimum | Maximum |
| Union density | 1123 | 45.99 | 22.97 | 6.67 | 100.00 |
| Coverage | 931 | 70.70 | 21.74 | 7.50 | 100.00 |
| Centralization | 1016 | 0.42 | 0.19 | 0.08 | 0.98 |
| Strike activity | 730 | 5.09 | 7.29 | 0.00 | 61.14 |
| Minimum wage | 1179 | 0.19 | 0.21 | 0.00 | 0.71 |
| Employment protection | 506 | 2.37 | 0.88 | 0.26 | 5.00 |
| legislation | |||||
| Unemployment benefit | 918 | 27.02 | 15.48 | 0.00 | 70.00 |
| Tax wedge | 294 | 25.32 | 7.75 | 8.17 | 41.88 |
| Social expenditure | 615 | 2.07 | 1.00 | 0.20 | 4.40 |
| Child care | 144 | 81.73 | 16.46 | 24.70 | 101.13 |
| Parental leave | 887 | 40.82 | 43.57 | 0.00 | 214.00 |
| Tax treatment of household | 228 | 1.93 | 1.47 | 0.26 | 8.21 |
| incomes | |||||
| Active labor market policies | 560 | 0.70 | 0.52 | 0.03 | 3.04 |
| Passive labor market policies | 572 | 1.25 | 0.99 | 0.08 | 5.45 |
Table 18.A6 Sample means of institutional measures—recent years (average 2000-2010)
| Union density | Coverage | Centralization | Strike | Minimum wage | Employment protection legislation | Unemployment benefit | Tax wedge | Social expenditure | Child care | Parental leave | Tax treatment of household incomes | Active labor market policies | Passive labor market policies | |
| Austria | 32.37 | 98.91 | 0.90 | 1.03 | 0.00 | 2.47 | 31.67 | 31.90 | 2.72 | 78.00 | 117.09 | 0.85 | 0.66 | 1.32 |
| Belgium | 51.88 | 96.00 | 0.46 | 23.07 | 0.44 | 1.82 | 40.91 | 36.97 | 2.63 | 99.54 | 28 | 1.93 | 1.17 | 2.23 |
| Bulgaria | 24.01 | 32.50 | 0.31 | na | 0.00 | na | 46.40 | 21.43 | na | na | na | na | 0.30 | 0.25 |
| Cyprus | 61.63 | 57.35 | 0.25 | 2.33 | 0.00 | na | 60.40 | 8.50 | na | na | na | 0.56 | 0.13 | 0.58 |
| Czech | 20.74 | 43.77 | 0.25 | na | 0.31 | 3.21 | 6.14 | 17.74 | 1.87 | 82.01 | 185.64 | 0.33 | 0.23 | 0.27 |
| Republic Denmark | 71.62 | 81.87 | 0.47 | 3.49 | 0.00 | 2.13 | 52.72 | 39.19 | 3.55 | 91.91 | 48.91 | 2.26 | 1.72 | 2.06 |
| Estonia | 9.69 | 25.06 | 0.36 | 0.21 | 0.30 | 2.43 | 50.00 | 17.60 | 1.79 | 87.08 | na | 0.67 | 0.11 | 0.39 |
| Finland | 71.84 | 87.13 | 0.40 | 2.16 | 0.00 | 2.19 | 34.56 | 32.57 | 2.98 | 51.29 | 42.35 | 2.69 | 0.90 | 1.84 |
| France | 7.84 | 90.00 | 0.21 | 22.47 | 0.47 | 2.42 | 39.88 | 24.90 | 3.02 | 100.99 | 32.55 | 0.69 | 1.02 | 1.46 |
| Germany | 21.44 | 64.40 | 0.48 | 1.60 | 0.00 | 2.80 | 25.85 | 36.73 | 1.96 | 91.57 | 60.1 | 4.11 | 1.03 | 1.78 |
| Greece | 25.03 | 65.00 | 0.34 | na | 0.33 | 2.80 | 14.42 | 22.77 | 1.14 | 72.30 | 24.09 | 1.06 | 0.17 | 0.44 |
| Hungary | 18.01 | 37.85 | 0.23 | 1.36 | 0.36 | 2.00 | 13.31 | 34.13 | 3.26 | 86.86 | 110 | 1.11 | 0.42 | 0.44 |
| Iceland | 86.47 | 88.02 | na | 16.74 | 0.51 | 1.73 | 40.76 | 26.00 | 3.00 | 95.44 | 25.97 | 3.16 | na | na |
| Ireland | 37.55 | 49.91 | 0.52 | 6.20 | 0.45 | 1.36 | 34.95 | 11.86 | 2.70 | 53.51 | 20.91 | 2.42 | 0.75 | 1.24 |
| Italy | 34.01 | 80.00 | 0.34 | 1.01 | 0.00 | 2.76 | bgcolor=white>34.6424.59 | 1.31 | 97.71 | 48 | 4.05 | 0.50 | 0.83 | |
| Latvia | 19.41 | 19.41 | 0.48 | 4.01 | 0.33 | na | 60.00 | 25.11 | na | na | na | 1.08 | 0.19 | 0.46 |
| Lithuania | 13.93 | 12.16 | 0.30 | 2.41 | 0.36 | na | 47.62 | 23.61 | na | na | na | 2.74 | 0.18 | 0.23 |
| Luxembourg | 41.00 | 58.22 | 0.31 | na | 0.34 | 2.25 | 26.67 | 19.89 | 3.36 | 85.95 | 42 | 1.19 | 0.42 | 0.60 |
| Malta | 56.02 | 58.26 | 0.37 | 1.35 | 0.00 | na | 30.63 | 14.94 | na | na | na | 1.13 | 0.04 | 0.36 |
| Netherlands | 20.69 | 82.63 | 0.57 | 2.58 | 0.43 | 2.87 | 41.74 | 32.36 | 1.67 | 68.02 | 20.73 | 1.40 | 1.31 | 1.74 |
| Norway | 54.44 | 72.94 | 0.51 | 11.38 | 0.00 | 2.33 | 51.80 | 28.46 | 2.93 | 91.93 | 37.91 | 5.97 | 0.65 | 0.44 |
| Poland | 19.18 | 39.00 | 0.23 | 3.48 | 0.34 | 2.23 | 10.89 | 28.74 | 1.13 | 49.00 | 122.55 | 0.70 | 0.43 | 0.74 |
| Portugal | 20.92 | 60.07 | 0.34 | 1.35 | 0.36 | 4.45 | 42.23 | 18.55 | 1.15 | 81.19 | 18.65 | 1.75 | 0.64 | 1.11 |
| Romania | 36.28 | 70.00 | 0.25 | 13.27 | 0.29 | na | 32.20 | 27.34 | na | na | na | na | 0.08 | 0.38 |
| Slovak | 24.34 | 44.70 | 0.50 | 0.01 | 0.35 | 2.30 | 9.50 | 18.22 | 1.89 | 72.53 | 164 | 0.99 | 0.30 | 0.46 |
| Republic Slovenia | 35.96 | 97.40 | 0.40 | na | 0.43 | 2.65 | 61.64 | 29.09 | 1.07 | 80.67 | na | 1.00 | 0.29 | 0.41 |
| Spain | 15.60 | 87.84 | 0.36 | 2.55 | 0.34 | 2.36 | 34.98 | 16.41 | 1.16 | 98.68 | 16 | 0.65 | 0.79 | 1.78 |
| Sweden | 74.40 | 93.17 | 0.51 | 3.58 | 0.00 | 2.62 | 37.62 | 31.25 | 3.29 | 90.39 | 59.95 | 3.50 | 1.20 | 1.06 |
| United | 28.74 | 34.64 | 0.11 | 2.20 | 0.36 | 1.20 | 15.99 | 25.87 | 3.14 | 91.88 | 28.55 | 1.84 | 0.36 | 0.23 |
| Kingdom United | 12.07 | 13.88 | 0.18 | na | 0.26 | 0.26 | 18.05 | 18.16 | 0.70 | 63.01 | 0 | 1.49 | 0.15 | 0.49 |
| States |
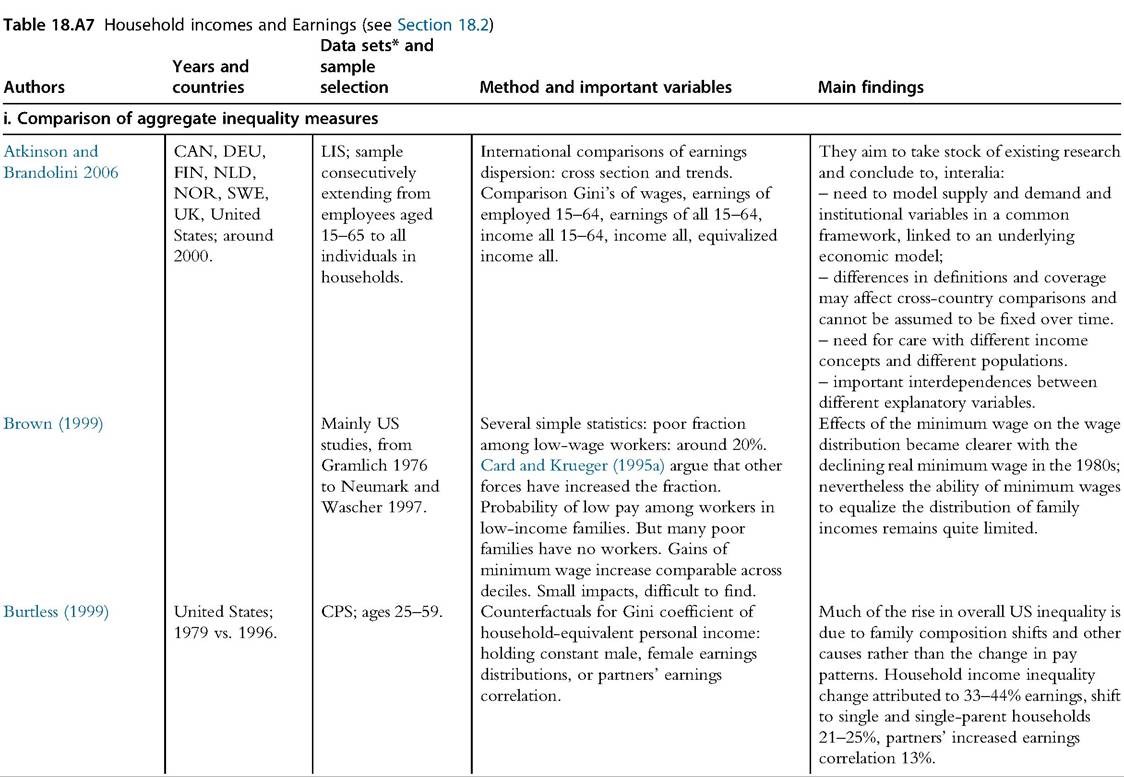
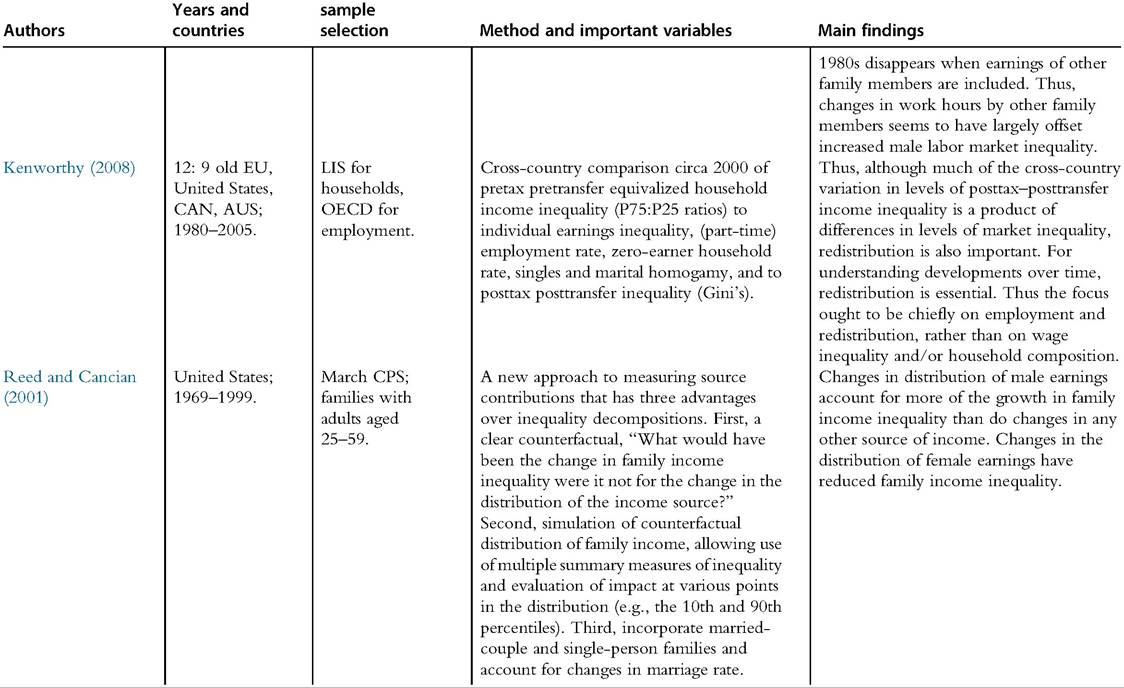
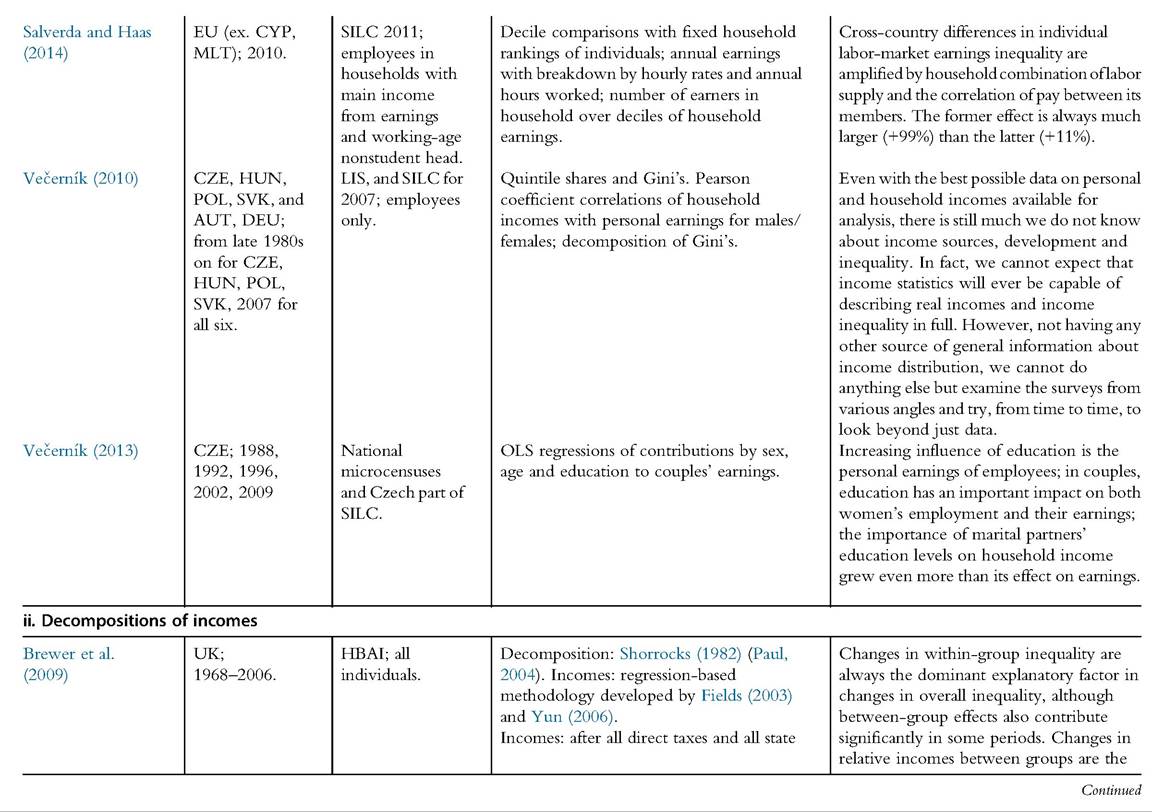
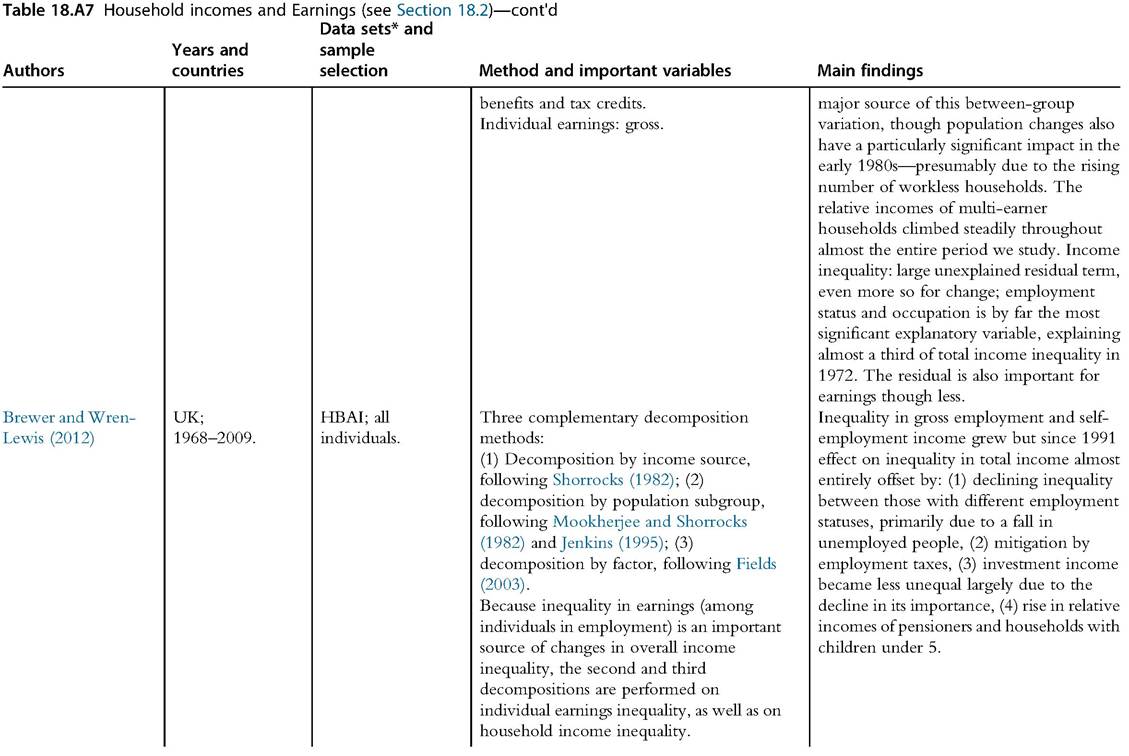
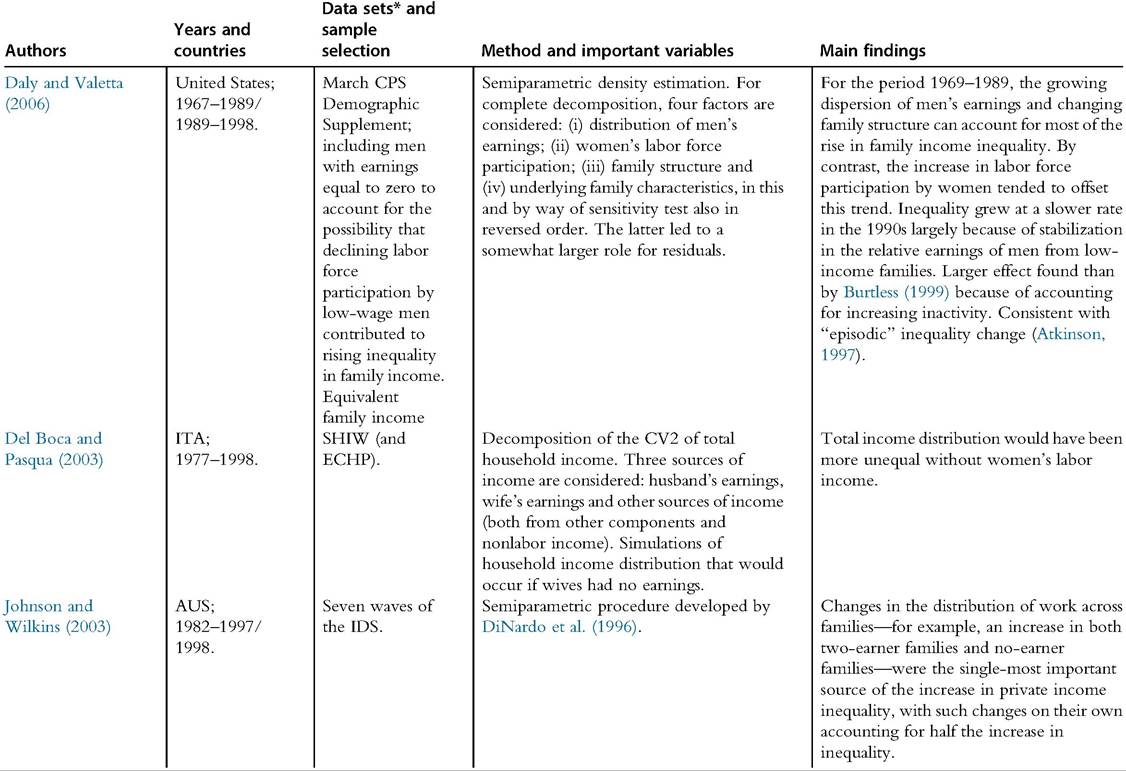
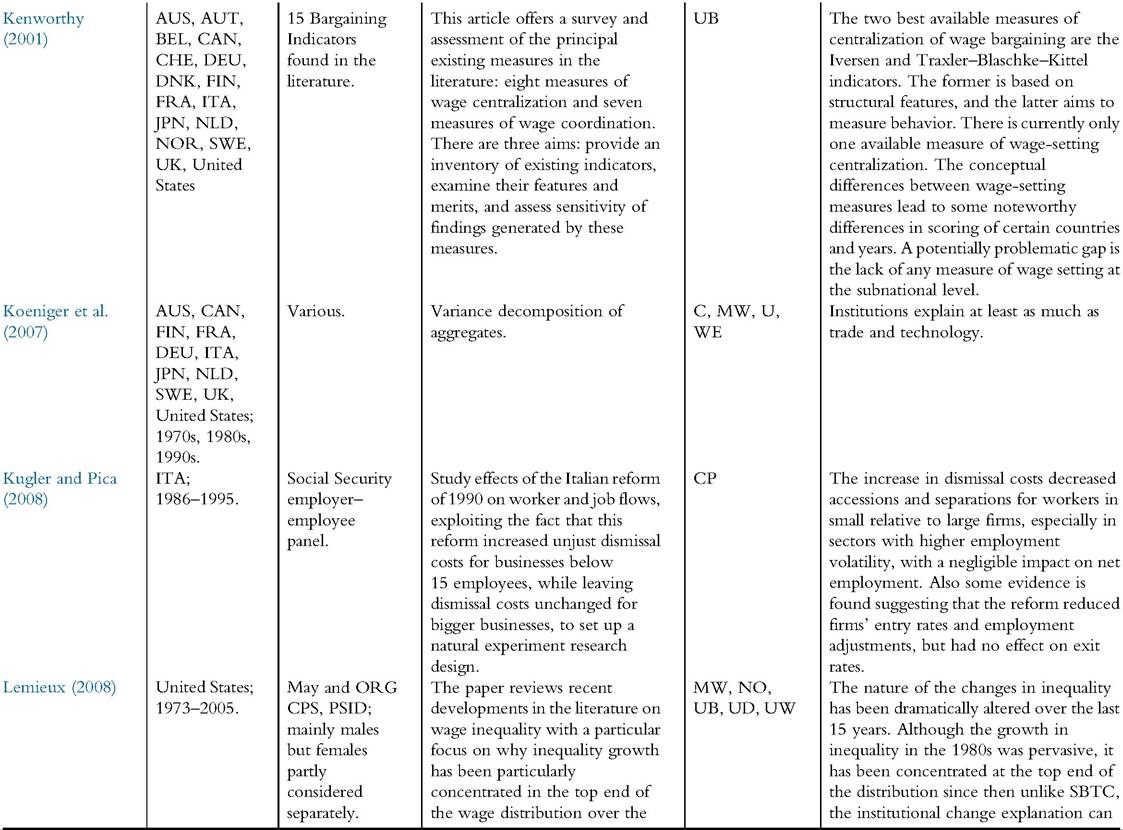
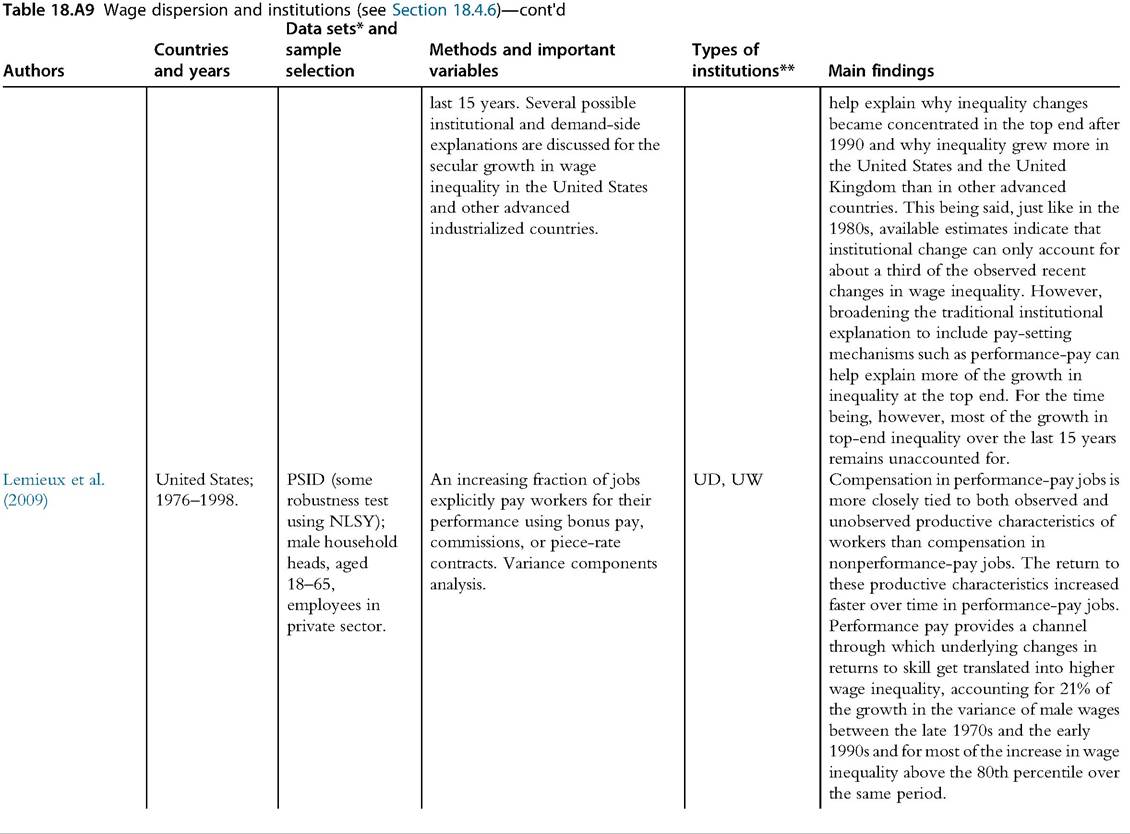
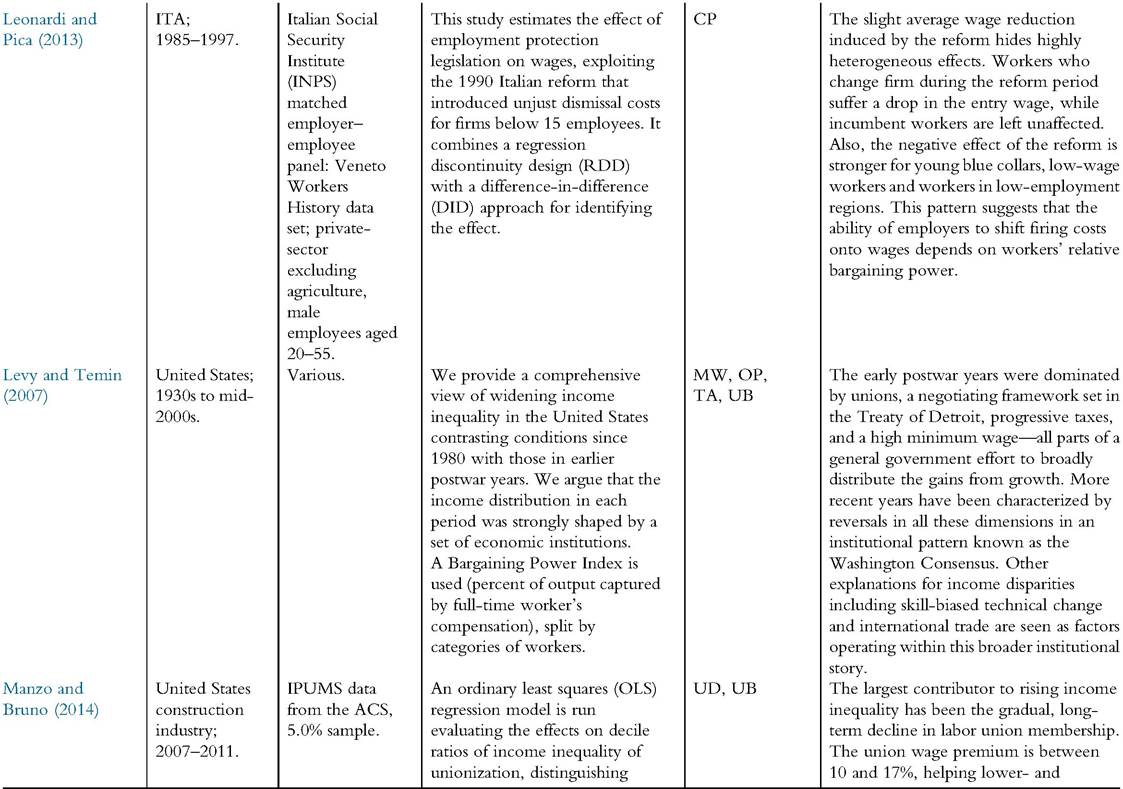
APPENDIX D. LITERATURE SUMMARY TABLES: HOUSEHOLD INCOMES AND EARNINGS AND WAGE DISPERSION AND INSTITUTIONS165
165
Tables A7 and A8 make generous use of summaries, abstracts, introduction and conclusions of the underlying papers.
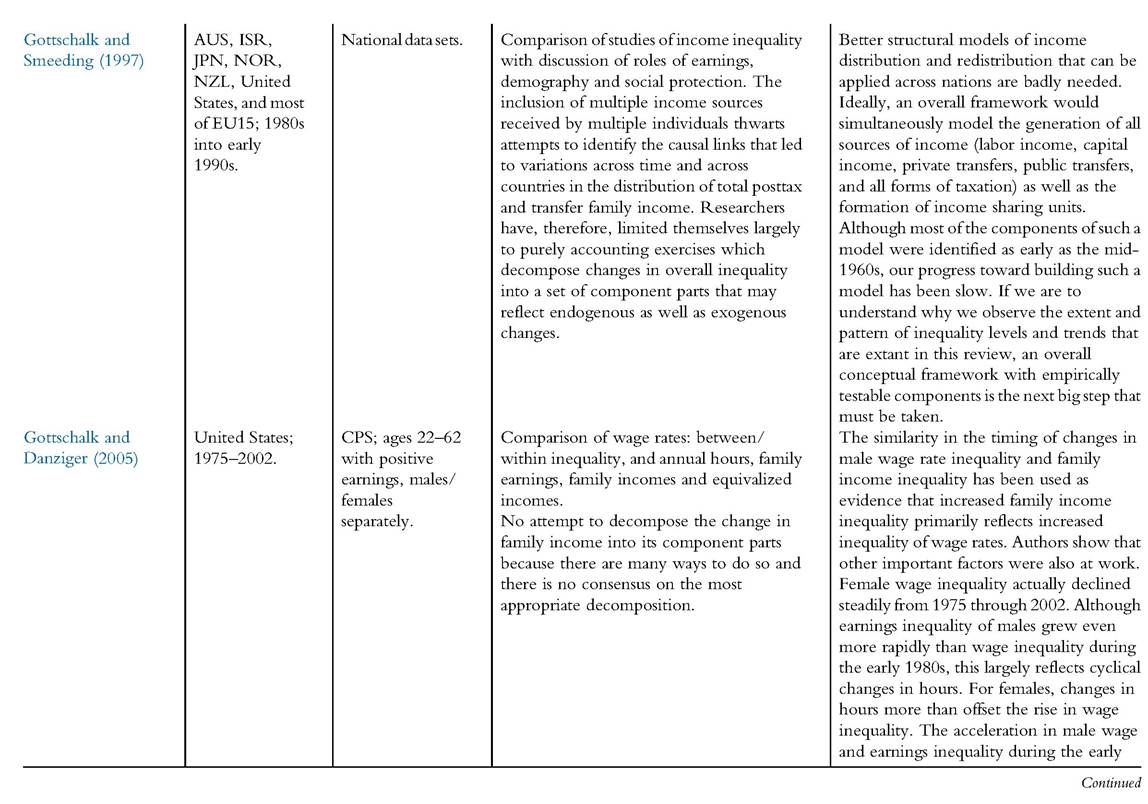
Table 18.A7 Household incomes and Earnings (see Section 18.2)—cont'd
Data sets* and
id="Picutre 398" class="lazyload" data-src="/files/uch_group77/uch_pgroup315/uch_uch7350/image/image398.jpg">
Table 18.A7 Household incomes and Earninas (see Section 18.2)—cont'd
| Karoly and | United States; | Census and | Decompose changes in Gini coefficient | Increase in proportion of single-head |
| Burtless (1995) | 1959, 1969,1979, 1989. | March CPS; Personal equivalent income distribution. | following Lerman and Yitzhaki (1984). | families boosted inequality over entire period. Forty percent reduction in income inequality in the 1960s because of the decline in earnings inequality among male heads of families; more than one-third of increase in inequality after 1969 because inequality in male earnings soared. Since 1979 females’ gains in earnings have increased inequality because these gains have been concentrated increasingly in families with high incomes. |
| Larrimore (2013) | United States; 1979-2007 | March CPS, log incomes and Theil index by several | exists between employment subgroups | |
| ITA, NLD, UK; 1979. | 1982); net household income. | socioeconomic characteristics. | (employees, self-employed, and not- working). Other important characteristics are age and education of the main breadwinner. The place of living household appeared to be of minor importance, and number of breadwinners is only of secondary importance. |
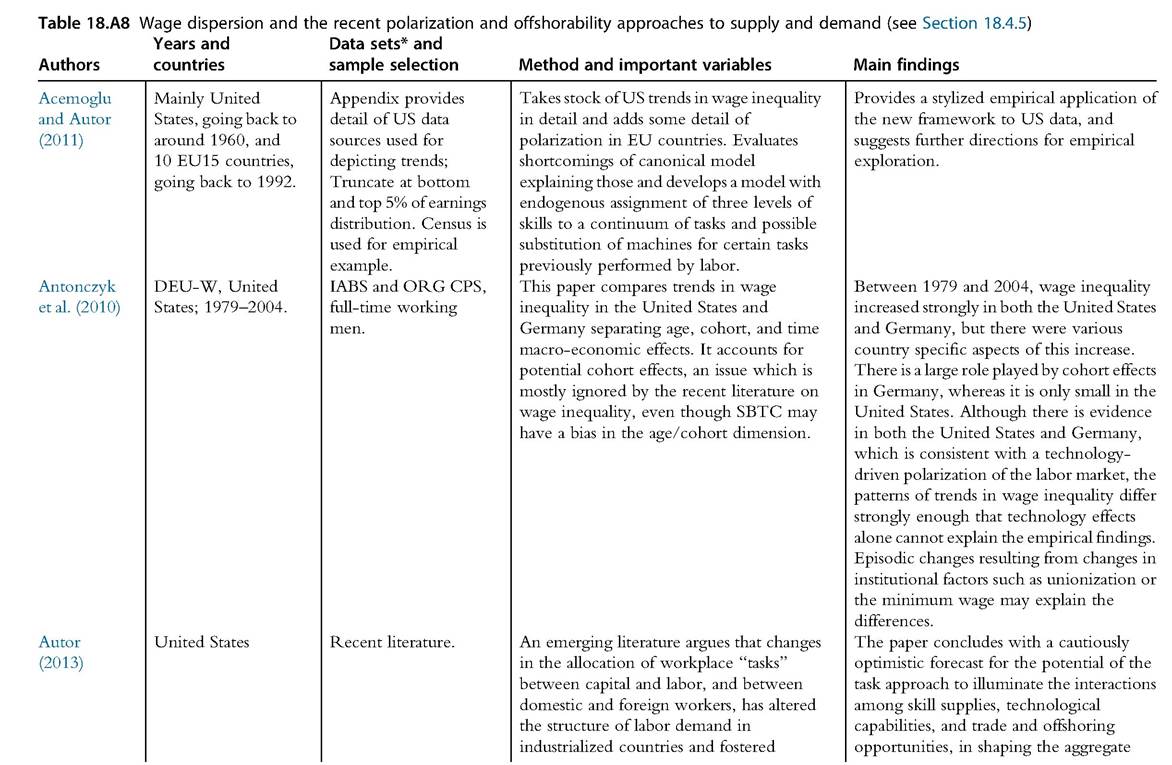
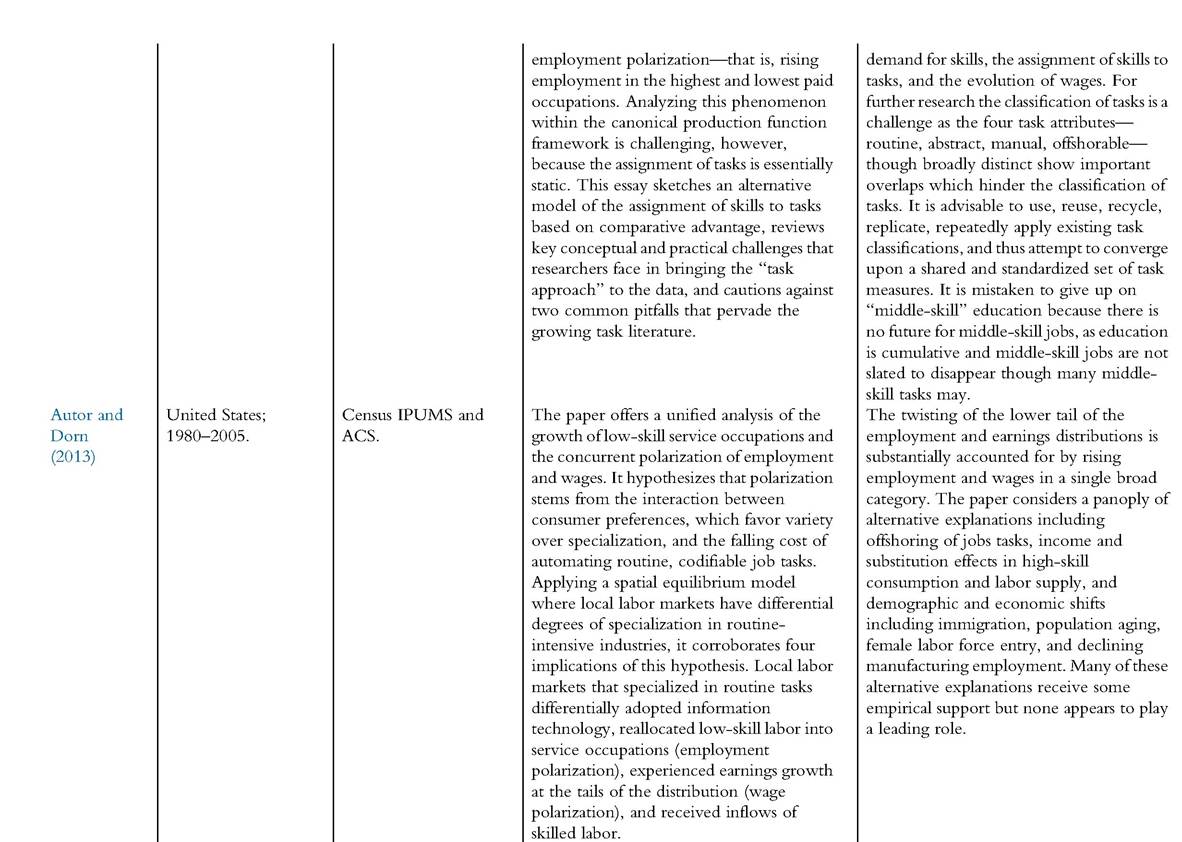
Table 18.A8 Wage dispersion and the recent polarization and offshorability approaches to supply and demand (see Section 18.4.5)—cont'd
| Authors | Years and countries | Data sets* and sample selection | Method and important variables | Main findings | |
| Autor et al. | United States; | DOT occupational | The paper argues that computer capital | Within industries, occupations, and | |
| (2003) | 1960-1998. | characteristics appended to Census IPUMS 1960-1990 and ORG CPS 1980-1998; employees aged 18-64, FTE weights. | (1) substitutes for workers in performing cognitive and manual tasks that can be accomplished by following explicit rules; and (2) complements workers in performing nonroutine problem solving and complex communications tasks. Provided that these tasks are imperfect substitutes, the model implies measurable changes in the composition of job tasks. | education groups, computerization is found to be associated with reduced labor input of routine manual and routine cognitive tasks and increased labor input of nonroutine cognitive tasks. Translating task shifts into education demand, the model can explain 60% of the estimated relative demand shift favoring college labor during 1970-1998. Task changes within nominally identical occupations account for almost half of this impact. | |
| Blinder (2007) | United States; 2004. | O*NET. | Using detailed information on the nature of work done in over 800 BLS occupational codes, this paper ranks those occupations according to how easy/hard it is to offshore the work—either physically or electronically. | Using that ranking, it estimates that somewhere between 22% and 29% of all US jobs are or will be potentially offshorable within a decade or two. Because the rankings are subjective, two alternatives are presented—one objective, the other is an independent subjective ranking. It is found that there is little or no correlation between an occupation’s “offshorability” and the skill level of its workers (as measured either by educational attainment or wages). However, it appears that, controlling for education, the most highly offshorable occupations were already paying significantly lower wages in 2004. | |
| Blinder and Krueger (2009) | United States; 2008. | Special survey for Princeton Data Improvement Initiative (PDII). | This paper reports on a pilot study of the use of conventional household survey methods to measure something unconventional: what we call | Offshorability appears to be particularly prevalent in production work and in office and administrative jobs. By industry group, it is most common in manufacturing, | |
| “offshorability,” defined as the ability to finance and insurance, information perform one’s work duties (for the same services, and professional and technical employer and customers) from abroad. services. More educated workers appear to Notice that offshorability is a characteristic hold somewhat more offshorable jobs. But of a person’s job, not of the person. differences in offshorability by race, sex, age, and geographic region are all minor. In estimated multivariate econometric models, offshorability does not appear to have consistent systematic effects on either wages or the probability of layoff. union | |||||
| Dunne et al. (2004) | United States; 1977 and 1992. | March CPS and LRD; only plants that reported investments. | members and people in licensed positions are always less likely to hold offshorable jobs; and, perhaps surprisingly, routine work is no more likely to be offshorable than other work. Using establishment-level data, we shed The findings are (1) the between-plant light on the sources of the changes in the component of wage dispersion is an structure of production, wages, and important and growing part of total wage employment that have occurred over dispersion; (2) much of the between-plant recent decades. increase in wage dispersion is within industries; (3) the between-plant measures of wage and productivity dispersion have increased substantially over recent decades; and (4) a significant fraction of the rising | ||
| Goos and Manning (2007) (see also 2003) | UK; 1976-1999. | NES complemented by for part-time workers. | dispersion in wages and productivity is accounted for by changes in the distribution of computer investment across plants. The more nuanced version of SBTC This paper presents evidence that recently proposed by Autor et al. (2003) employment in the United Kingdom is makes a different prediction about what is polarizing into lovely and lousy jobs in happening to employment in low-wage consistence with the nuanced view. Job jobs. polarization can explain one-third of the rise in the log(50∕10) wage differential and one-half of the rise in the log(90∕50). | ||
Continued
Table 18.A8 Wage dispersion and the recent polarization and offshorability approaches to supply and demand (see Section 18.4.5)—cont'd
| Authors | Years and countries | Data sets* and sample selection | Method and important variables | Main findings | ||||
| Goos et al. | 15 EU countries; | LFS-EU, excl. | This paper develops a simple and | The routinization hypothesis of Autor et al. | ||||
| (2011) (see also 2009 and 2010) | 1996-2006. | agriculture and fishing, and OECD STAN | empirically tractable model of labor demand to explain recent changes in the occupational structure of employment as a result of technology, offshoring, and institutions. This framework takes account not just of direct effects but indirect effects through induced shifts in demand for different products. | (2003) is found to be the most important factor behind the observed shifts in employment but offshoring does also play a role. Shifts in product demand are acting to attenuate the impacts of recent technological progress and offshoring. By implication, wage-setting institutions play little role in explaining job polarization in Europe. | ||||
| Liu and | United States; | ORG CPS, O*NET; | Is the third industrial revolution indeed | The well-known increase in between- | ||||
| Grusky (2013) | 1979-2010. | nonmilitary wage and salary workers including part-time, aged 16-65. | driven by rising payoffs to skill? This simple but important question has gone unanswered because conventional models of earnings inequality are based on exceedingly weak measurements of skill. By attaching occupational skill measurements to the CPS, it becomes possible to adjudicate competing accounts of the changing returns to cognitive, creative, technical, and social skill. | occupation inequality is fully explained when such skills are taken into account, while returns to schooling prove to be quite stable once correlated changes in workplace skills are parsed out. The most important trend, however, is a precipitous increase in the wage payoff to synthesis, critical thinking, and related “analytic skills.” The payoff to technical and creative skills, often touted in discussions of the third industrial revolution, is shown to be less substantial. | ||||
| Mishel | United States; | ORG and May CPS | The influential “skill-biased technological | Principal findings include: | ||||
| etal. (2013) | 1973-2007. | (provide an independent test of earlier results based primarily on the decennial census and the American Community Survey); | change” (SBTC) explanation claims that technology raises demand for educated workers, thus allowing them to command higher wages—which, in turn, increases wage inequality. A more recent SBTC explanation focuses on computerization’s role in increasing employment in both higher-wage and lower-wage occupations, | 1. Technological and skill deficiency explanations of wage inequality have failed to explain key wage patterns over the last three decades, including the 2000s. 2. History shows that middle-wage occupations have shrunk and higher-wage occupations have expanded since the 1950s. This has not driven any changed | ||||
| Spitz- | DEU-W 1979, | wage and salary workers aged 18—64. Qualification and | resulting in “job polarization.” This paper contends that current SBTC models—such as the education-focused “canonical model” and the more recent “tasks framework” or “job polarization” approach mentioned above—do not adequately account for key wage patterns (namely, rising wage inequality) over the last three decades. A unique data set from West Germany | pattern of wage trends. 3. Evidence for job polarization is weak. 4. There was no occupational job polarization in the 2000s. 5. Occupational employment trends do not drive wage patterns or wage inequality. 6. Occupations have become less, not more, important determinants of wage patterns. 7. An expanded demand for low-wage service occupations is not a key driver of wage trends. 8. Occupational employment trends provide only limited insights into the main dynamics of the labor market, particularly wage trends. Occupations are found to require more | ||||
| Oener | 1985/1986, | Career Survey BBIB; | enables looking at how skill requirements | complex skills today than in 1979, and the | ||||
| (2006) | 1991/1992, | employees living in | have changed within occupations. Two | changes in skill requirements have been | ||||
| 1998/1999. | West Germany, German nationals, aged 18-65. | hypotheses are tested: (1) IT is a substitute for routine manual and routine cognitive activities, and (2) IT is complementary to analytic and interactive activities. | most pronounced in rapidly computerizing occupations. It occurred within occupations, within occupation-education groups, and within occupation-age groups, changes in skill requirements similar to those in the United States. The question that now arises is why similar changes in skill requirements in all of these countries have not led to similar changes in the structure of wages. | |||||
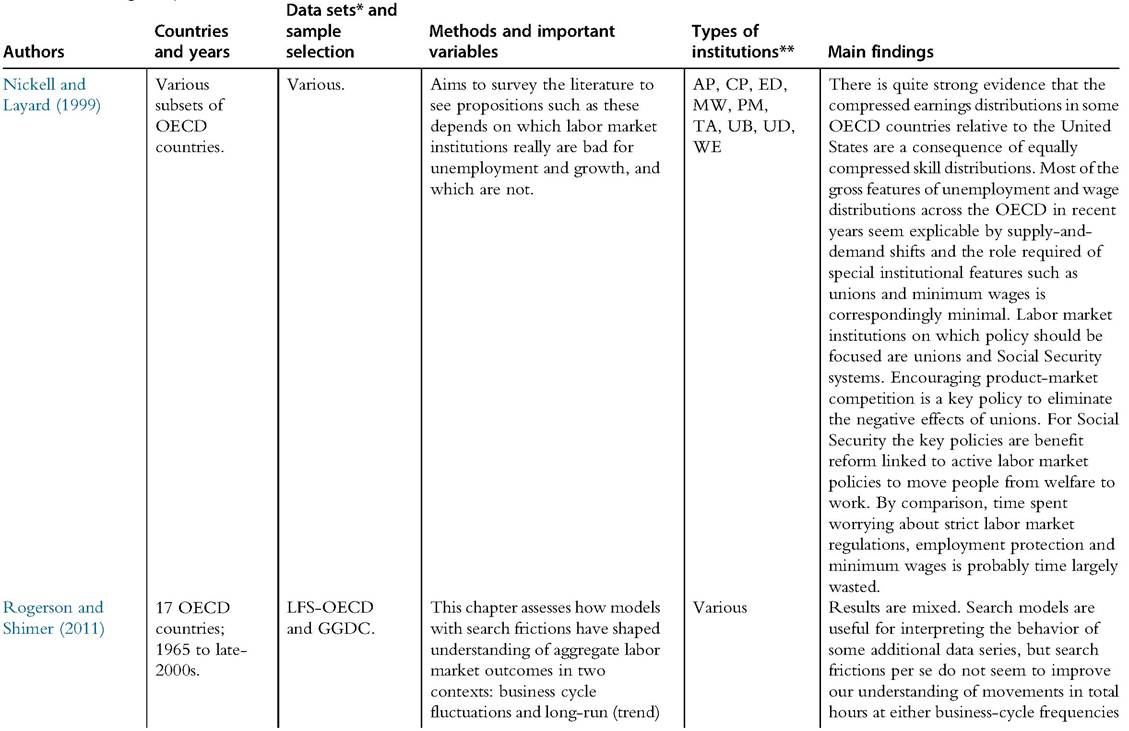
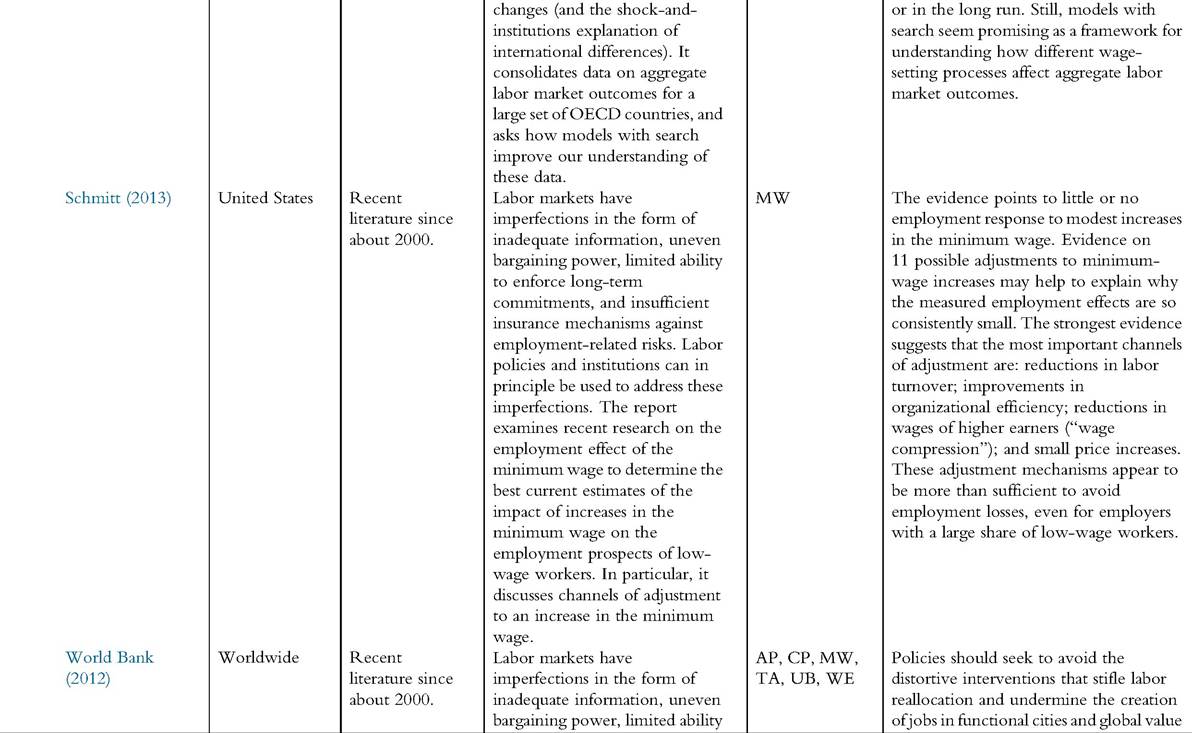
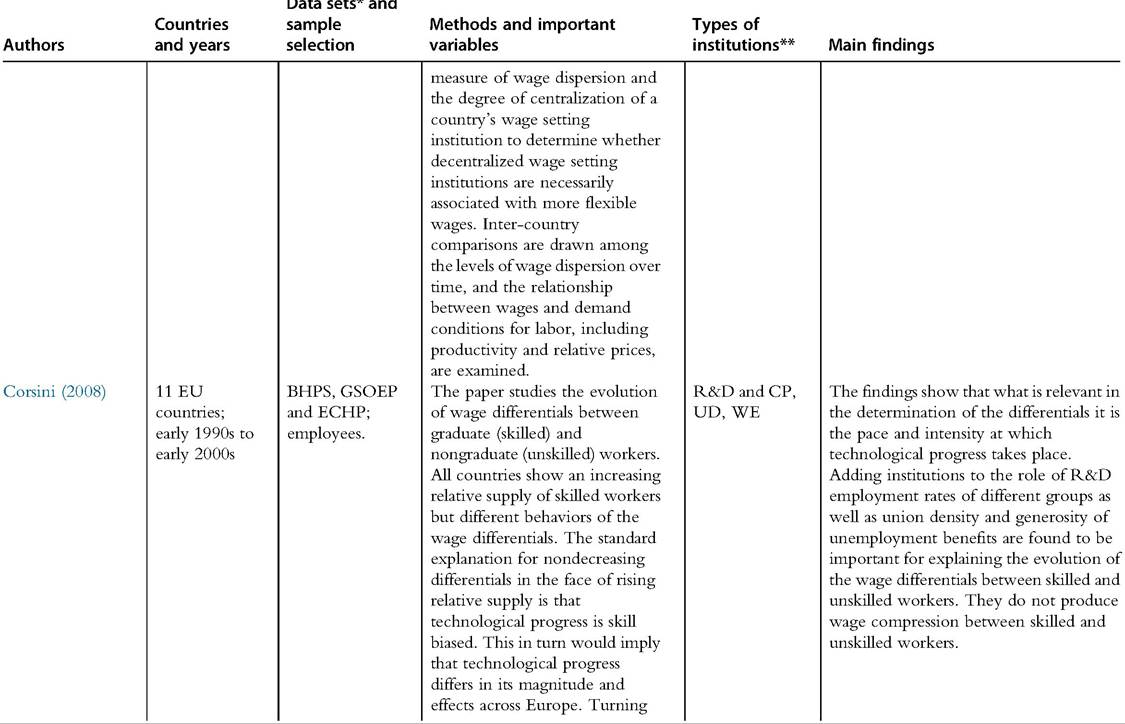
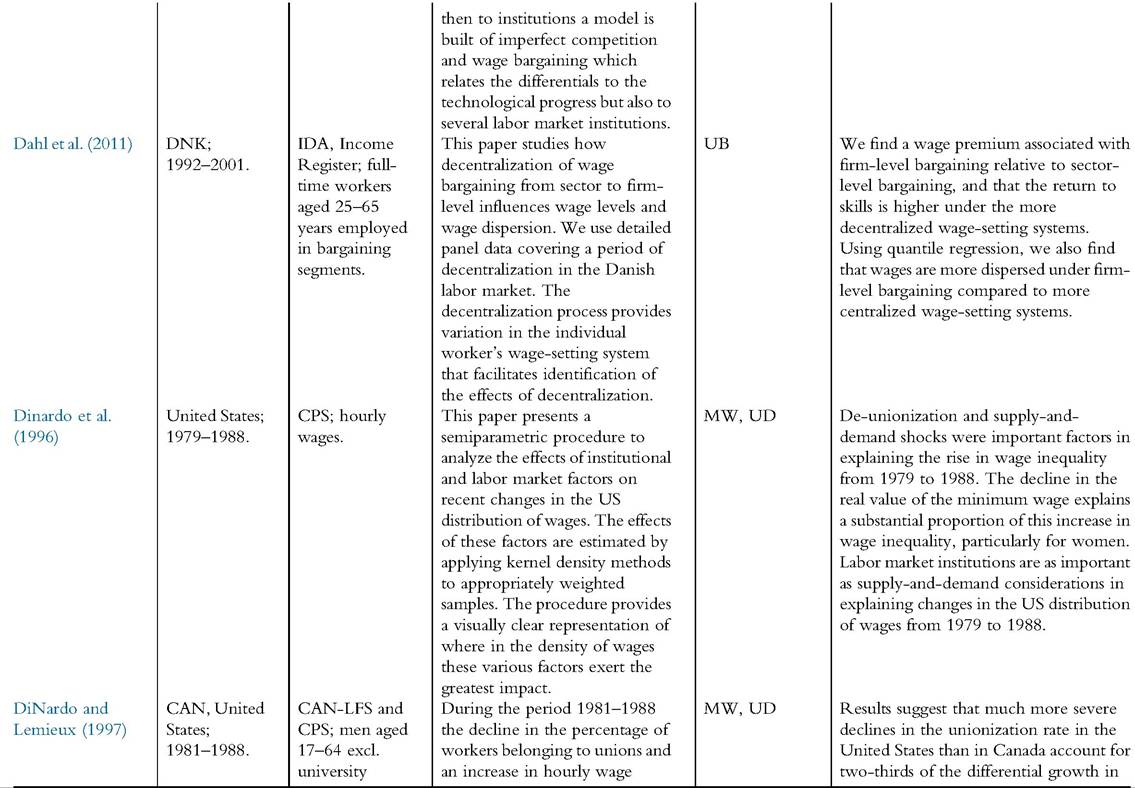
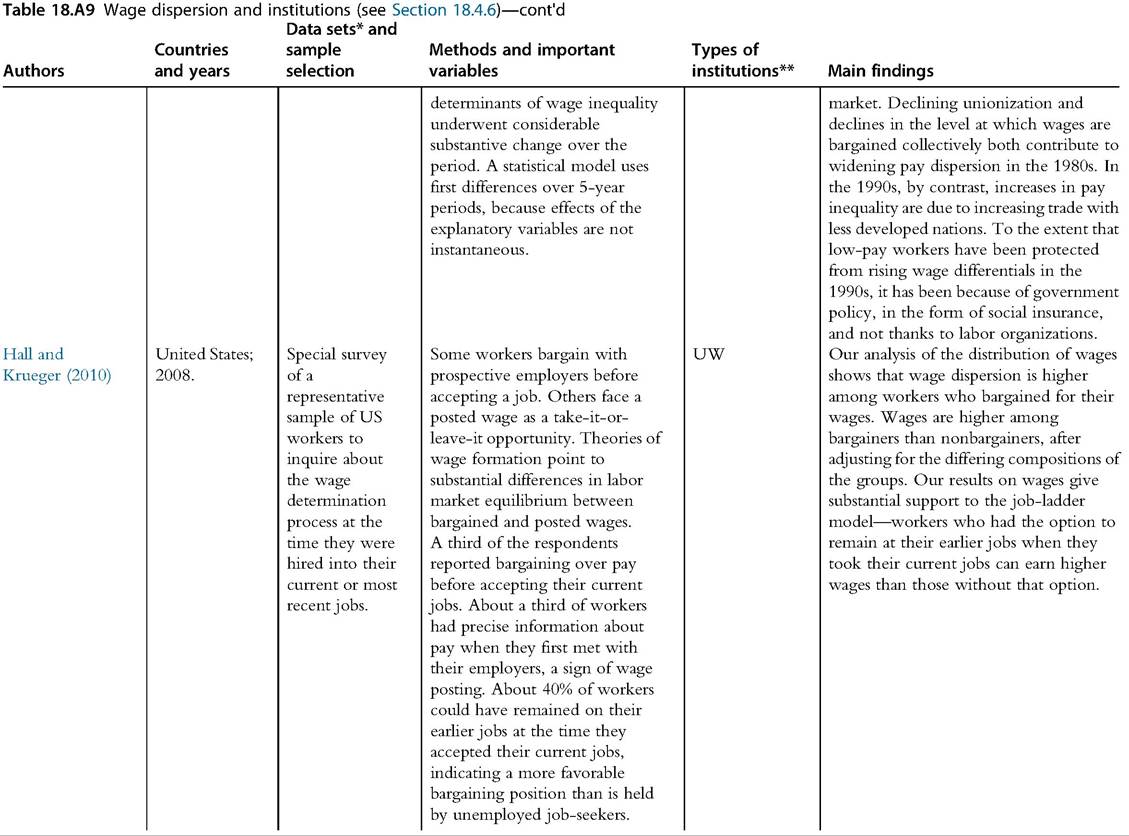
Table 18.A9 Wage dispersion and institutions (see Section 18.4.6)
| Authors i. Overviews of the Blau and Kahn | Countries and years literature 13 EU | Data sets* and sample selection Draws on | Methods and important variables This chapter examines the | Types of institutions** AP, CP, DI, | Main findings There is considerable evidence that |
| (1999) | countries and | existing | impact of wage-setting | MW, UB, | centralized collective bargaining, |
| CHE, AUS, | literature and | institutions and government | UD | minimum wages, and antidiscrimination | |
| CAN, JPN, | data sources | policies on wages and | policies raise the relative wages of the low | ||
| NZL, United | used there. | employment, focusing on the | paid. Evidence of the impact of these | ||
| States; 1970s | OECD countries. | institutions and other policies such as | |||
| to 1990s. | mandated severance pay, advance notice or unemployment insurance is more mixed with some studies finding active employment effects while others do not. This may reflect the adoption by many OECD countries of offsetting policies, such as public employment, temporary employment contracts and active labor market programs, which, although they may have reduced the adverse relative employment effects of their less-flexible labor market institutions on the low skilled, appear not to have prevented high overall unemployment. | ||||
| Blau and Kahn | IALS: | IALS, 1994, | Documents and provides | ED, HR, | International differences reflect diversity |
| (2009) | 8 countries; | 200 + annual | explanations for levels of and | MW, UB | of working population and prices, which |
| OECD: | hours and 10 + | trends in earnings inequality, | in turn are affected by supply and demand | ||
| 12 countries. | annual weeks; | focusing on international | as well as institutions. Collective | ||
| OECD | (OECD) differences. | bargaining and the minimum wage bring | |||
| Earnings | Distinguishes between wage | up the bottom, leading to employment | |||
| database, 1980, | rates, hours worked, and | losses. Offshoring deserves further | |||
| 1990, 2000. | earnings. | attention (and may actually narrow wage differentials); so do employment protection, product market regulation and norms. |
| Doucouliagos | United States | Extensive | Multivariate meta-regression | MW | Recently developed meta-analysis |
| and Stanley (2009) | literature search. | analysis accommodate a potentially complex employment effect, misspecification biases and differential propensities to report adverse employment effects. It uses employment elasticity with respect to the minimum wage as the metric. | methods applied to 64 US minimumwage studies (almost 1500 estimates) show that the minimum-wage effects literature is contaminated by publication selection bias, which is estimated to be slightly larger than the average reported minimum wage effect. Once this is corrected, little or no evidence of a negative association between minimum wages and employment remains. The results confirm those of the meta-analysis of Card and Krueger (1995b). | ||
| De Linde Leonard et al. (2013) | UK | Extensive literature search. | Multivariate meta-regression analysis of 236 estimated minimum-wage elasticities and 710 partial correlation coefficients from 16 UK studies. | MW | The study finds no overall practically significant adverse employment effect. Unlike US studies (see Doucouliagos and Stanley, 2009), there seems to be little, if any, overall reporting bias. It identifies several research dimensions that are associated with differential employment effects. In particular, the residential home care industry may exhibit a genuinely adverse employment effect. |
| Freeman (2005) | OECD | No new empirics. | This paper argues that there are two reasons for inconclusive debate over the claim that labor institutions impair aggregate performance. The first reason is that many adherents to the claim hold strong priors that labor markets operate nearly perfectly in the absence of institutions and let their priors dictate their modeling choices and interpretation of empirical results. The second reason is that the cross-country aggregate data at issue is weak—too weak to decisively reject strong prior views or to convince those with weaker priors. | Various | The debate over the influence of labor market flexibility on performance is unlikely to be settled by additional studies using aggregate data and making crosscountry comparisons. Although this approach holds little promise, microanalysis of workers and firms and increased use of experimental methods represent a path forward. Steps along this path could help end the current “lawyer’s case” empiricism in which priors dominate evidence. |
Continued
Table 18.A9 Wage dispersion and institutions (see Section 18.4.6)—cont'd
| Authors | Countries and years | Data sets* and sample selection | Methods and important variables | Types of institutions** | Main findings |
| Freeman (2007) | OECD | No new empirics. | The paper documents the large cross-country differences in labor institutions that make them a candidate explanatory factor for the divergent economic performance of countries and reviews what economists have learned about the effects of these institutions on economic outcomes. It identifies three ways in which institutions affect economic performance: by altering incentives, by facilitating efficient bargaining, and by increasing information, communication, and trust. | CP, UB | The evidence shows that labor institutions reduce the dispersion of earnings and income inequality, which alters incentives, but finds equivocal effects on other aggregate outcomes, such as employment and unemployment. Given weaknesses in the cross-country data on which most studies focus, the paper argues for increased use of microdata, simulations, and experiments to illuminate how labor institutions operate and affect outcomes. |
| Katz and Autor (1999) | United States | No new empirics. | The chapter presents a framework for understanding changes in the wage structure and overall earnings inequality. It emphasizes the role of supply- and-demand factors and the interaction of market forces and labor market institutions. Recent changes in the US wage structure are analyzed in detail to highlight crucial measurement issues that arise in studying wage structure changes and to illustrate the operation of the framework. The roles of skill-biased technological | IR, MW, UB, UD | Several directions for future research are suggested: the roles of changes in labor market institutions (the incidence of labor market rents) and changes in competitive supply-and-demand factors. A key issue model is how to model the effects of institutions on employment rates and composition as well as on wages. The extent to which institutional changes reflect exogenous political events as opposed to responses to market forces can help sort out the effects of institutions from supply-and-demand factors. Taking a longer-term historical perspective will also be helpful as the US experience for |
| Kierzenkowski | OECD | Recent | change, globalization forces, changes in demographics and relative skill supplies, industry labor rents, unions, and the minimum wage in the evolution of the US wage structure arc examined, as are differences and similarities in wage structure changes among OECD nations. Despite a general trend of | MW, UB | the 1970s, 1980s, and 1990s illustrates. Cross-country comparative work and differences across regions within a country may also provide useful variation in demand-and-supply shocks and institutional factors. SBTC (canonical view) fails to explain |
| and Koske (2012) | literature. | increasing labor income inequality, there have been differences in the timing, intensity, and even direction of these changes across OECD countries. These stylized facts have led to numerous studies about the main determinants of labor income inequality and, as a result, a significant revision of the previous consensus about the key drivers. The most researched channels include skill-biased technological change, international trade, immigration, education, as well as the role of labor market policies and institutions. | why inequality has diminished at the bottom relative to the median since the late 1980s as well as why within-group wage dispersion has grown substantially and mainly for college-educated workers. SBTC (nuanced view) explains why OECD labor markets have become polarized. International trade seems to have important implications for at least some groups of workers. Immigration has a rather small impact on native workers and sizable adverse wage or employment effects on the cohorts of previous immigrants. Education: Wage inequality is negatively correlated with the average level of educational attainment. Labor market policies and institutions: The impact of declining unionisation and of the lower relative minimum wage is most pronounced at the lower end of the wage distribution while cross-country evidence suggests that government employment reduces wage inequality. | ||
| Lemieux (2011) | AUS, CAN, | No new | Wage inequality has been | MW, UD, | Although demand factors linked to |
| United States; since 1980s. | empirics. | increasing in most industrialized countries over the last three decades. There are, nonetheless, major differences across | UW | technological change may be a leading factor behind the secular growth in wage inequality (or the more recent polarization of wages), they cannot |
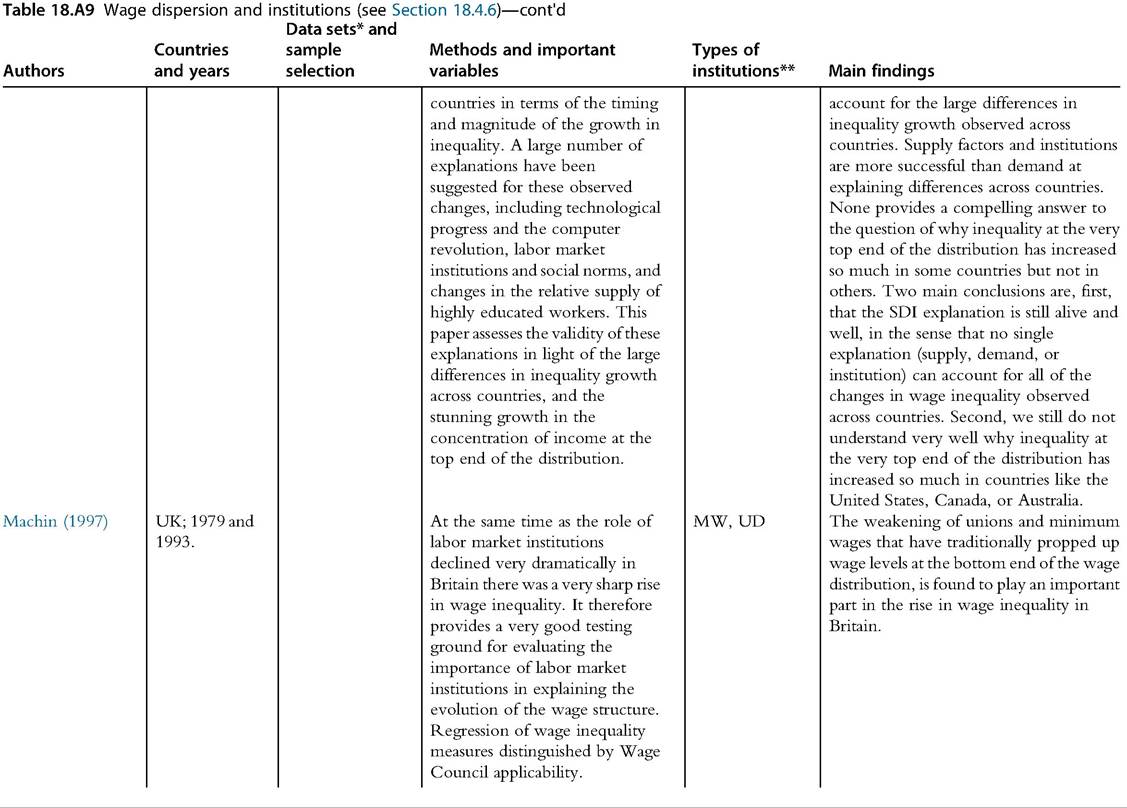
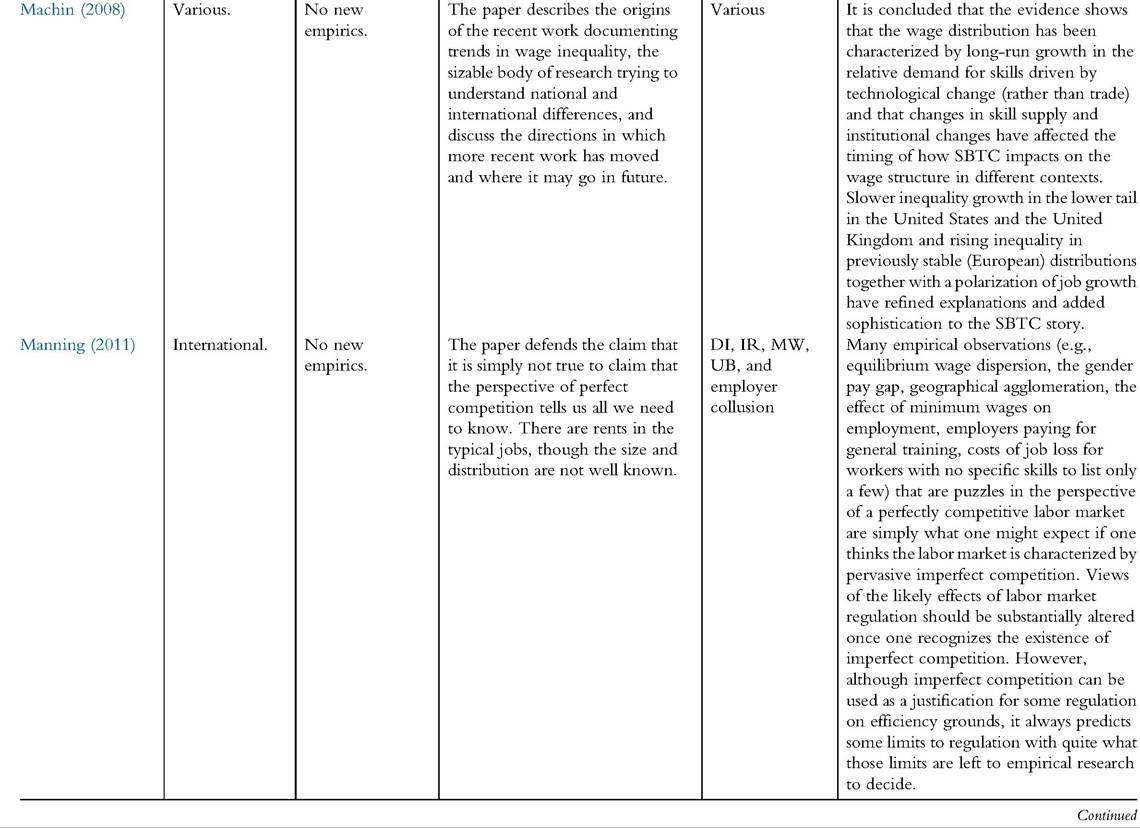
Table 18.A9 Wage dispersion and institutions (see Section 18.4.6)—cont'd
Continued
Table 18.A9 Wage dispersion and institutions (see Section 18.4.6)—cont'd
Data sets* and
| Authors | Countries and years | sample selection | Methods and important variables | Types of institutions** | Main findings |
| to enforce long-term commitments, and insufficient insurance mechanisms against employment-related risks. Labor policies and institutions can in principle be used to address these imperfections. It is important, then, to understand the role and the impacts of policies and institutions like labor market regulation, collective bargaining, active labor market programs, and social insurance. But the main constraints to the job creation often lie outside the labor market, and a clear approach is needed to support appropriate policy responses. | chains. But policies should also ensure voice and social protection, especially for the most vulnerable. Ideally, policies should aim at removing the market imperfections and institutional failures preventing the private sector from creating more of those jobs. If the constraints cannot be easily singled out or are difficult to remove, offsetting policies may be considered. | ||||
| ii. Aggregate studies (institutions may be indirect) | |||||
| Acemoglu | AUS, BEL, | CPS and LIS; | Relative-supply-demand model | MW, UW, | Relative demand for skills increased |
| (2003) | CAN, DEU, | annual earnings | to determine differential effects, | some | differentially across countries. Labor |
| DNK, FIN, ISR, NLD, NOR, SWE, UK, United States; mid80s to mid90s. | of full-time, full-year male household heads aged of 18-64. | followed by a model of Differential Technology Responses across countries (not tested). | Demographics | market institutions creating wage compression in Europe also encourage more investment in technologies increasing the productivity of less-skilled workers, implying less skill-biased technical change in Europe than the United States. | |
| Alderson and | 16 OECD; | Deininger and | Gini of incomes regressed on | OP, UD, WE | Direct investment and North-South |
| Nielsen (2002) | 1967-1992. | Squire (1996) for income inequality. | economic aggregate measures. | trade have played a role in the determination of income inequality in the contemporary period; likewise for immigration. | |
| Autor et al. | United States; | March CPS and | Extends quantile decomposition | MW | Compositional shifts in labor force have |
| (2005) | 1973-2003. | May/ORG CPS; real log hourly wages of wage and salary workers. | that nests DiNardo et al. (1996) in view of more differentiated developments over the earnings distribution after 1990s (as 90/50 and 50/10 trends diverge). | contributed to earnings inequality during the 1990s. | |
| Autor et al. | United States; | March CPS, | Kernel reweighting approach of | ED, | Upper-tail (90/50) inequality has |
| (2008) | 1963-2005. | matched with DOT; FTFY workers log earnings. Abstract, routine and manual tasks within occupations. | Lemieux used to facilitate a direct comparison. Overall 90/10, 90/50 and 50/10; between-group educational differentials; within- group 90/10, 90/50, and 50/10 residual wage gaps conditioned on measures of education, age/ experience, and gender. | occupations by mean years of schooling, MW | increased steadily since 1980 and fluctuations in the real minimum wage are not a plausible explanation; a puzzling deceleration in relative demand growth for college workers in the early 1990s potentially reconciled by a modified version of the skill-biased technical change hypothesis that emphasizes the role of information technology in complementing abstract (high-education) tasks and substituting for routine (middleeducation) tasks. Employment and wage growth by skill percentile are found to be positively correlated in each of the last two decades. |
| Blanchard and | 20 OECD; | Nickell’s and | AP, CP, | Interactions shock and institutions are | |
| Wolfers (2000) | 1960-1995. | OECD institutions data. | ED, MW, PM, TA, UB, UD, WE | essential for understanding international differences. | |
| Bedard and | AUS, BEL, | Wage data from | Compares test scores at age 13 to | ED | Wage dispersion, as summarized by Gini |
| Ferrall (2003) | CAN-BC/ ON, DEU- W, FIN, FRA, JPN, NLD, SWE, UK, United States; 1964/1982 vs. 1969...1992 | national sources; test data from IME conducted in 1964 and 1982. | wages later in life. | coefficients, is significantly related to testscore dispersion. For the United States, the United Kingdom, and Japan, with more data, evidence of skill-biased changes in wage dispersion between the early 1970s and the late 1980s is found. | |
Table 18.A9 Wage dispersion and institutions (see Section 18.4.6)—cont'd
| Authors | Countries and years | Data sets* and sample selection | Methods and important variables | Types of institutions** | Main findings |
| Bertola and | EU15; | OECD, | Institutions protective of labor | CP, TA, UD, | Labor market reforms are becoming |
| Boeri (2003) | 1982-1995. | Eurostat, ILO. | serve some intended purpose. More intense competition may increase demand for protection, and certainly calls for reforms. A stylized model of the effects of structural change and resulting reform tensions is used to examine recent evidence. | WE | relatively more frequent in EMU countries, and many of them reduce welfare system generosity and deregulate labor markets. Most reforms are marginal, however, and in many cases deregulation- oriented reforms are accompanied by measures which appear to try and offset the implications of stronger competition instead. To exploit fully the advantages of economic and monetary integration, the institutional structure of labor and other markets needs to be revised extensively. |
| Budria and Pereira (2005) | DEU, FIN, FRA, GRC, ITA, NOR, PRT, SWE, UK; 1980s, 1990s. | EDWIN microdata, private-sector males ages 18-60, 35 + hours, nonagricultural employees. | Quantile regression and OLS of returns to education. | ED | Inequality increasing effect of tertiary education, through the “within” dimension, became more acute over last years. |
| Christopoulou | AUT, BEL, | EU-SES 1995, | Split between composition effect | MW, OP, | Wage inequality growth diverges across |
| et al. (2010) iii. Specific institut Baccaro (2008) | DEU, ESP, GRC, HUN, IRL, ITA, NLD, 1995 and 2002. ions in more dep 51 Advanced, Central and Eastern European, Latin | 2002; hourly wage including regular bonuses and payment for overtime. th (see iv for jobs New ILO data set on industrial relations and labor law, various | and returns effect, and residual. polarization) Between- and within-country regressions. | UB, UD UB, UD, labor-law compliance | countries. Only minor contribution of compositional change, but association with technology and globalization, while with immigration wages decline. Mixed effect of labor market institutions. What changes from the 1990s on in advanced countries is the capacity of industrial relations institutions to reduce inequality directly by compressing market earnings. In particular, centralized |
| Barth and | American and Asian countries late 1980s to early 2000s; and analysis of 16 Advanced countries from the late 1970s. AUT, BEL, | dimensions of globalization, and controls for demand and supply ofskilled labor. EDWIN, | Model with supply and demand | CP, ED, UB, | collective bargaining seems to have become less redistributive than in the past. To the extent that industrial relations institutions continue to support and reproduce the welfare state, they reduce inequality indirectly though this channel. No evidence of increasing “over- |
| Lucifora (2006) | DEU, DNK, ESP, FIN, FRA, GRC, ITA, NOR, SWE, UK; 1973...2003. | ECHP; nonagricultural employees 18-64 15 + hours, gross hourly earnings. | for different types of labor, as well as institutions affecting the bargained relative wage. | UD | education” in Europe. Bargaining coordination and employment protection have compressing effect on wages, but at different points of the wage distribution. |
| Bassanini and | 21 OECD; | Aggregate employment and | AP, MW, | Changes in policies and institutions | |
| Duval (2006) | 1982-2003. | group-specific participation, institutional/policies interactions. | PM, TA, WE | appear to explain almost two-thirds of noncyclical unemployment changes over the past two decades. | |
| Bassanini et al. | OECD; | OECD annual | Examines effect of dismissal | CP | Empirical results suggest that mandatory |
| (2009) | 1982-2003. | cross-country aggregate data on the stringency of employment protection legislation and industry-level data on productivity. | regulation on productivity. | dismissal regulations have a depressing impact on productivity growth in industries where layoff restrictions are more likely to be binding. By contrast, no evidence is found of a productivity effect of regulations concerning temporary contracts, which suggests that partial reforms, facilitating the use of fixed-term and atypical contracts, are unlikely to have an important impact on efficiency and technological change and cannot therefore be a substitute for comprehensive reforms whereby dismissal restrictions for open-ended contracts are also weakened. |
Table 18.A9 Wage dispersion and institutions (see Section 18.4.6)—cont'd
Data sets* and
| Authors | Countries and years | sample selection | bgcolor=white>Methods and important variablesTypes of institutions** | Main findings | |
| Bertola et al. | 28 OECD | Database of | Analysis why the United States | AP, CP, TA, | Although macroeconomic and |
| (2001) | countries; 1960-1999. | Blanchard and Wolfers together with wage distributions from OECD Earnings database and labor force and population data from ILO. | moved from relatively high to relatively low unemployment over the last three decades. Institutions are largely assumed to be invariant. | UB, UD, WE | demographic shocks and changing labor market institutions explain a modest portion of this change, the interaction of these shocks and labor market institutions is the most important factor explaining the shift in the United States relative unemployment. This is consistent with Blanchard and Wolfers (2000). Controlling for country- and timespecific effects, high employment is associated with low wage levels and high levels of wage inequality. Disaggregating, the employment of both younger and older people fell sharply in other countries relative to the United States since the 1970s, with much smaller differences in outcomes among the prime-aged. |
| Bicakova (2006) | FRA, UK, United States; 1990-2002. | National LFS; 25-54; incl. self-employed; hourly wages (net in FR); skill groups: sex ? age ? education. | Focus is changes in the between- group variation in earnings, employment, unemployment, and inactivity; labor supply and demand model with heterogeneous types of labor, using a pseudo-panel of different skill-groups; three equations for wage, employment, and labor force participation as a function of exogenous supply and demand shifters, as implied by the structural model, is estimated by two-way fixed effects on group- level panel data. | Wage rigidity (MW in sideshow) | Trade-off inequality to unemployment for declining demand for low-skilled is found for FRA vs. UK and United States. |
| Bingley et al. | DNK; | LFS; males aged | Investigates the relationship | WE | Unemployment insurance is associated |
| (2013) | 1980-2003. | 21-55 working full time in private sector. | between life-cycle wages and individual membership of unemployment insurance schemes, separating permanent from transitory wages and characterise them using membership of unemployment insurance funds. | with lower wage growth heterogeneity over the life cycle and greater wage instability, changing the nature of wage inequality from permanent to transitory. Robustness checks suggest that moral hazard is relevant. | |
| Blau and Kahn | OECD; | Various, both | Discusses the literature and | AP, CP, ED, | Interventionist labor market institutions |
| (2002) (see also 1996) | 1979-1999 | macro and micro. | builds on own earlier contributions to compare US labor market performance to other countries. | TA, UB, WE | in Europe compress wages and lower wage inequality; however, jobs most be lost for some groups. Institutional and demographic change and macroeconomic policy also differs to the advantage of the United States. |
| Boeri (2011) | Europe; since 1980. | fRDB-IZA social policy reforms database. | Reviews literature building on institutional reforms as quasinatural experiments. | AP, CF, CP, TA, UB, WE | Literature is very informative but insufficiently accounts for long-lasting asymmetries between reformed and unreformed segments of the labor market. Extends Mortensen-Pissarides model with this segmentation for a theoretical approach that can help improving the identification of causal effects using reforms. Also gives empirical evidence on reforms. |
| Boeri and Jimeno (2005) | ITA; 1986-1995. | LFS rotation panel, Italian social security records (INPS archives). | Within-country exemptions to coverage of employment protection provisions allow making inferences on the impact of EPL when assessing the effects on dismissal probabilities and, using a change in EPL in 1990, on the equilibrium size distribution of firms. | CP | Results are in line with predictions of the theoretical model. Workers under permanent contracts in firms with less restrictive EPL are more likely to be dismissed. However, there is no effect on the growth of firms. |
Table 18.A9 Wage dispersion and institutions (see Section 18.4.6)—cont'd
| Authors | Countries and years | Data sets* and sample selection | Methods and important variables | Types of institutions** | Main findings |
| Bryson et al. (2012) | Europe and United States; early 2000s. | GSS 2002 and 2006, EWCS 2000 and 2005; employees with a permanent contract in private sector and in profit oriented firms only excluding managers and CEOs. | Presents new comparable data on the incidence of performance pay schemes. The percentage of employees exposed to incentive pay schemes ranges from around 10-15% in some European countries to over 40% in Scandinavian countries and the United States. Individualpay and profit/gain sharing schemes are widely diffused, whereas share ownership schemes are much less common, particularly in Europe. | UW | A number of empirical regularities are found. Incentive pay is less common in countries with a higher share of small firms. Higher product and labor market regulation are associated with lower use of incentive pay. Capital market development is a necessary requirement for a wider diffusion of incentive pay, particularly sharing and ownership schemes. Controlling for a large set of individual characteristics and company attributes, the probability that a worker is covered by an incentive scheme is higher in large firms and in high-skilled occupations, while it is much lower for females. |
| Card and DiNardo (2002) | United States; around 1970-2000. | CPS: March, May and ORG; diverging samples are compared. | Extended discussion of the measurement of technological change and of changes in the structure of wages in the U.S. labor market over the past 20-30 years, concluding to myriad shifts. | MW | Viewed from 2002, it now appears that the rise in wage inequality was an episodic event. A key problem for the SBTC hypothesis is that wage inequality stabilized in the 1990s despite continuing advances in computer technology; SBTC also fails to explain the evolution of other dimensions of wage inequality. |
| Card et al. | CAN, UK, | CAN-LFS + | Comprehensive analysis of the | UB, UD, | Unions reduce male inequality also after |
| (2004) | United States; 1973/ 1984... 2001. | supplements, UK-LFS and GHS, May and ORG CPS; hourly wages of employees aged 16-65. | evolution of unionization and wage inequality for both men and women in all three countries over the past two to three decades, as a sequel to Freeman (1980) and Freeman and Medoff (1984). The countries collect comparable data and share similar collective bargaining institutions. | MW | controlling for skill; but they increase female inequality; over time the declining unionization has eroded equalization. |
| Checchi and | 11 EU | LIS; na | Labor market institutions are a | CP, MW, TA, | The evidence indicates that stronger |
| Garcia Pefialosa (2008) | countries, AUS, CAN, NOR, CHE and United States; 1969-2004. | crucial determinant of wage inequality, the wage share in aggregate income, and the unemployment rate. Because these variables affect, in turn, the distribution of income across households, the question arises of whether stronger labor market institutions have an impact on income inequality. Institutions can in principle have conflicting effects. This paper examines what is the overall impact of labor market institutions on household income inequality. And counterfactually simulates adoption in other countries of labor standards of United States, UK or EU average. | UB, UD | institutions are associated with lower income inequality, but in some cases also with higher rates of unemployment. The magnitude of this trade-off is explored, and the changes in inequality and unemployment are quantified that would be observed if a common labor standard were imposed on members states of the European Union—results are not encouraging as a consequence of a lowering of employment protection; this could be accompanied though by a reinforcement of wage coordination and union density but these are no obvious policy targets. | |
| Checchi and | OECD; | Aggregate data | This paper argues that personal | MW, TA, | It is found that greater unionization and |
| Garcia Pefialosa (2010) | 1960-2000. | from various sources (see paper’s Appendix B). | income inequality depends on the wage differential, the labor share and the unemployment rate. Labor market institutions affect income inequality through these three channels, and their overall effect is theoretically ambiguous. | UB, UD | greater wage bargaining coordination have opposite effects on inequality, implying conflicting effects of greater union presence on income inequality. |
| Coelli et al. (1994) | 14 OECD countries; around 1970-1990. | OECD National accounts sectoral data. | This paper examines the issue of wage flexibility in an international context using sectoral wage dispersion data from 14 OECD countries. It draws comparisons between a | UB | No strong systematic relationship exists between wage dispersion and the degree of centralization of labor market institutions. |
Table 18.A9 Wage dispersion and institutions (see Section 18.4.6)—cont'd
Continued
Table 18.A9 Wage dispersion and institutions (see Section 18.4.6)—cont'd
| Authors | Countries and years | Data sets* and sample selection | Methods and important variables | Types of institutions** | Main findings |
| graduates 17-19. | inequality were much more pronounced in the United States than in Canada. Study the effect of labor market institutions on changes in wage inequality by computing simple counterfactuals such as the distribution of wages that would prevail if all workers were paid according to the observed nonunion wage schedule. | wage inequality between the two countries. | |||
| Dustmann et al. | DEU-W; | IABS | Using the kernel reweighting | UD | Wage inequality in West Germany has |
| (2009) | mid-1970s to mid-2000s. | 1975-2004, and LIAB 1995-2004; ages 21-60. | procedure (DiNardo etal., 1996) it is shown that it is important to account for changes in workforce composition, in particular at the upper end of the wage distribution. Fluctuations in relative supply explain the evolution of the wage differential between the low- and medium- skilled very well, but do a poor job in predicting the evolution of the wage differential between the medium- and high-skilled. | increased over the past three decades, contrary to common perceptions. During the 1980s, the increase was concentrated at the top of the distribution; in the 1990s, it occurred at the bottom end as well. Technological change is responsible for the widening of the wage distribution at the top. At the bottom of the wage distribution, the increase in inequality is better explained by episodic events, such as supply shocks and changes in labor market institutions. Occupations with high median wages in 1980 experienced the highest growth rate, whereas occupations in the middle of the 1980 wage distribution lost ground relative to occupations at the bottom. | |
| Eissa and | United States; | March CPS; | Simulation of 1984 and 1996 | TA | EITC family targeting can disincentivize |
| Hoynes (2004) | 1984-1996. | married couples residing in the | EITC rules on married couples labor participation. Effects estimated using both quasi- | secondary earners: 1% fall married women, strong increase for single-parent women, slight increase married men. |
| Firpo et al. | United States; | same household, ages 25-54, and less than high school in main estimates CPS and | experimental and traditional reduced-form labor supply models, with same conclusion. Changes in returns to | OP, UD | Technological change and |
| (2011) | 1976/1977, 1988/1990, 2000/2002, 2004/2004, 2009/2010. | O*Net; male employees | occupational tasks have contributed to changes in the wage distribution over the last three decades. Using a decomposition based on Firpo et al. (2009). | deunionization played a central role in the 1980s and 1990s, and offshorability became an important factor from the 1990s onward. | |
| Fortin and | United States; | CPS; workers | Show what the variance of the | MW, PM, | Historical evidence from the United |
| Lemieux (1997) | 1979 and 1988. | aged 16-65. | (log) wage distribution would have been, if each of the three institutional changes had not happened. Decompose distribution of wages using three elements: the fraction of workers “affected” by the institutional factor of interest; the mean level of log wages among affected and nonaffected workers; and the dispersion of log wages among affected and nonaffected workers. By reverting some of these measures to their previous level, simulate what would have happened if the institutional changes had not taken place. | UB, UD | States, international comparisons among industrialized countries and analyses of US data for the 1980s all yield the same conclusion: institutional forces simply cannot be overlooked in any serious attempt to understand the recent rise in wage inequality in the US labor market. |
| Golden and | 16 OECD | Examine three main hypotheses | OP, UB, UD, | Causes for pay inequality are quite | |
| Wallerstein (2006) | countries; 1980-2000. | for the rise of pay inequality: postindustrial, globalization, and institutional. Main idea is | WE | different in the 1980s than in the 1990s. In the 1980s, growing wage dispersion is due to changes in the institutions of the labor |
Continued
Continued
Table 18.A9 Wage dispersion and institutions (see Section 18.4.6)—cont'd
| Authors | Countries and years | Data sets* and sample selection | Methods and important variables | Types of institutions** | Main findings |
| between prevailing-wage-law | middle-income workers most. Right-to- | ||||
| states and right-to-work law | work laws decrease unionization by | ||||
| states, and controlling for | between 5% and 8% points and reduce the | ||||
| demographic, educational, and | average construction worker’s earnings | ||||
| work factors, including 24 distinct occupations. | by 6% in the national economy. | ||||
| Nunziata (2005) | OECD; | Various. | An empirical analysis of the | CP, MW, TA, | Labor market regulations can explain a |
| 1960-1994. | determinants of labor cost, with | UB, UD, | large part of the labor cost rise in the last | ||
| particular reference to the impact | UW, WE | few decades once we control for | |||
| of labor market institutions from | productivity. | ||||
| 1960 to 1994. The paper also discusses the econometric issues | |||||
| related to the estimation of a macro pooled model like ours: among other things, the hypothesis of poolability and the cointegration properties of the model. The explanatory power of the model is finally tested by means of a series of country by country dynamic simulations. | |||||
| Oliver (2008) | 14 OECD | Unpublished | With a series of cross-sectional | UW | The results strongly indicate that the |
| countries; | data set from | time-series analyses, this article | presence of industrywide wage scales is a | ||
| 1980-2002. | the OECD | investigates how a particular | key factor in the evolution of wage | ||
| wage-bargaining institution: the extent to which industrywide wage minima (wage scales) cover both higher and lower skilled workers, mitigates pressures from growing international competition and new production techniques and affects the degree of wage inequality growth. | inequality across OECD countries. | ||||
| Plotnick (1982) | United States; | Unpublished | This study uses newly available | UD | The major finding is that the observed |
| 1957-1977. | earnings data Henle and Ryscavage (1980), CPS (unpublished and several specific data sources; males). | time series data to analyze trends in earnings inequality. It shows that although a human capital approach fits the data well and most of its predictions on signs are correct, the model’s more exacting implications are not satisfied. A complementary more ad hoc approach retains variables found to be significant and looks beyond aggregate inequality measures into parts of the distribution which gain or lose. | slow upward trend in earnings inequality is well explained by a small number of plausible economic factors. Earnings inequality is significantly related to the level of unionization, dispersion in weeks worked, the age distribution of workers, and inequality of education. Once such factors are considered, there was no secular trend in earnings inequality over the 1958-1977 period. | ||
| Scheve and | AUS, CAN, | Top-incomes | Although explaining post-1970 | UB | Regression analysis over the 13 countries |
| Stasavage (2009) | CHE, DEU, DNK, FRA, IRL, JPN, NLD, NZL, SWE, UK, United States; 1916-2000. | data, OECD earnings database, Lydall (1968), existing data on political institutions and new political data coded by the authors. | differences in income inequality between OECD countries is an important task, it is also the case that convincing comparative political economy hypotheses should be able to account as well for inequality trends in earlier time periods. The article considers the correlation of centralized wage bargaining and government partisanship with three separate top incomes fractions. With a longer time span there has been significantly more variation within countries over time than there has been between countries. A longer time span also enables examining whether within-country changes in institutions like wage bargaining centralization have been associated with changes in inequality. | and the whole period gives little evidence that government partisanship and wagebargaining centralization can account for variation in inequality over the long run. A test of four individual countries that established a centralized system of wage bargaining in the middle of the twentieth century (DNK, IRL, NLD, SWE) also shows little evidence of an effect on inequality. This raises questions about the extent to which centralized wage bargaining is an institution that has a causal effect on inequality or alternatively whether centralized bargaining is simply an outcome that has, along with income equality, evolved over time in response to an underlying political or economic process. |
Table 18.A9 Wage dispersion and institutions (see Section 18.4.6)—cont'd
| Authors | Countries and years | Data sets* and sample selection | Methods and important variables | Types of institutions** | Main findings |
| Schivardi and Torrini (2008) | ITA; 1986-1998. | INPS comprehensive longitudinal matched employeremployees data set. | The paper studies the effects of the more stringent employment protection legislation that applies to firms with over 15 employees. It considers firms' propensity to grow when close to that threshold and changes in employment policies when they pass it. Using a the stochastic transition matrix for firm size. | CP | The probability of firms' growth is reduced by around 2% points near the threshold. The long-run effects of EPL on the size distribution of firms are quantitatively modest. Contrary to the implications of more stringent firing restrictions, workers in firms just above the threshold have on average less stable employment relations than those just below it; this might be because firms above the threshold make greater use of flexible employment contracts, arguably to circumvent the stricter regulation on open-end contracts. |
| Van der Wiel (2010) | NLD; 1997-2001. | Dutch SocioEconomic Panel SEP1984- 2002: five waves containing contractual information. | This paper empirically establishes the effect of the employer's term of notice on the wage level of employees through a fixed effects regression model. The term of notice is defined as the period an employer has to notify workers in advance of their upcoming dismissal. The wages paid during this period are an important element of firing costs and hence employment protection. To find a causal effect, the paper exploits the exogenous change in the term of notice that resulted from the introduction of a new Dutch law in 1999. | CP | Strong evidence is found that a longer “dormant” term of notice leads to higher wages. In the sample used, an additional month of notice increases wages by 3%, ceteris paribus. |
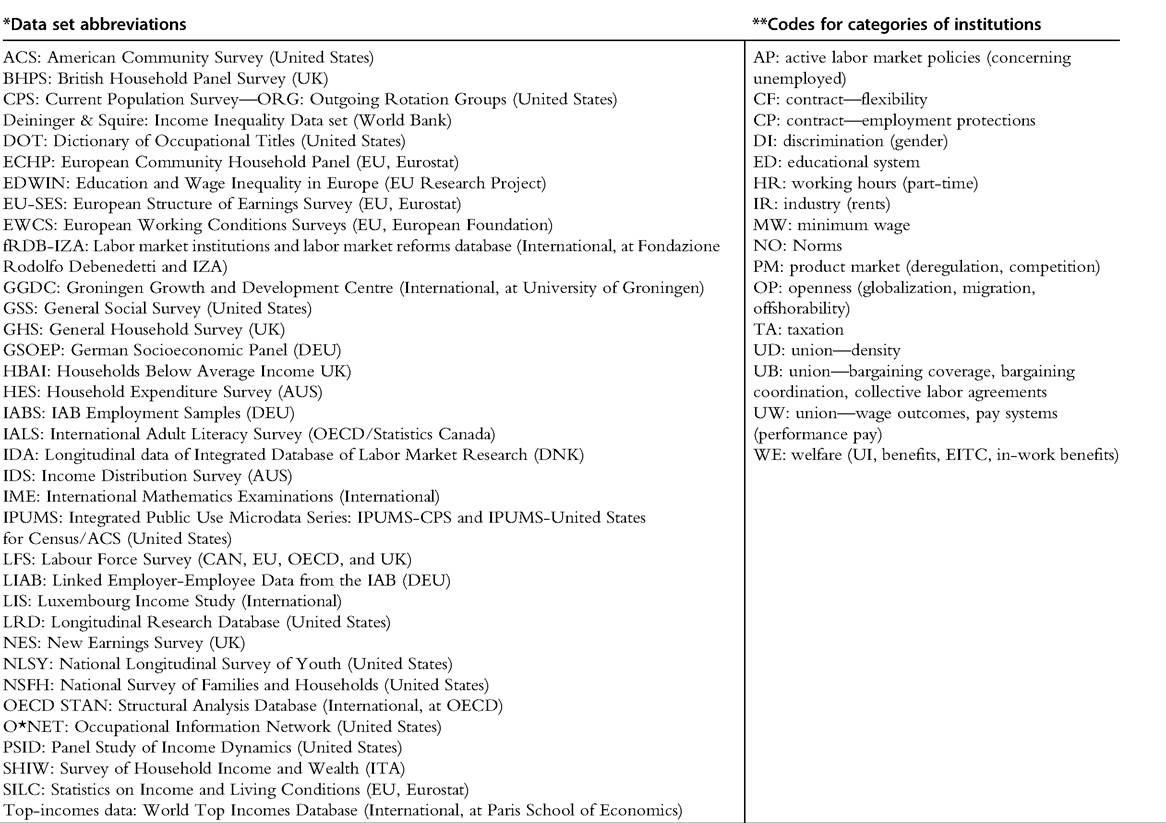
REFERENCES
Abowd, John, Kramarz, Francis, Lemieux, Thomas, Margolis, David, 1999. Minimum wages and youth employment in France and the United States. In: Blanchflower, David, Freeman, Richard (Eds.), Youth Employment and Joblessness in Advanced Countries. NBER and University of Chicago Press, Boston/ Chicago (Chapter 11).
Acemoglu, Daron, 2003. Cross-country inequality trends. Econ. J. 113, F121—F149.
Acemoglu, Daron, Autor, David, 2011. Skills, tasks and technologies: implications for employment and earning. In: Ashenfelter, Orley, Card, David (Eds.), Handbook of Labor Economics. vol. 4/B. Elsevier, Amsterdam, pp. 1043-1171.
Acemoglu, Daron, Autor, David, 2012. What Does Human CapitalDo? A Review ofGoldin andKatz’s The Race Between Education and Technology, NBER Working Paper 17820.
Agell, Jonas, Lommerud, Kjell Erik, 1992. Union egalitarianism as income insurance. Economica 59 (235), 295-310.
Agell, Jonas, Lommerud, Kjell Erik, 1993. Egalitarianism and growth. Scand. J. Econ. 95 (4), 559-579.
Aghion, Philippe, Algan, Yann, Cahuc, Pierre, 2011. Civil society and the state: the interplay between cooperation and minimum wage regulation. J. Eur. Econ. Assoc. 9 (1), 3-42.
Alderson, Arthur S., Nielsen, Francois, 2002. Globalisation andthe great U-turn: income inequality trends in 16 OECD countries. Am. J. Sociol. 107, 1244-1299.
Alesina, Alberto F., Algan, Yann, Cahuc, Pierre, Giuliano, Paola, 2010. Family Values and the Regulation of Labor, NBER Working Paper 15747.
Allegretto, Sylvia, Dube, Arindrajit, Reich, Michael, 2011. Do minimum wages really reduce teen employment? Accounting for heterogeneity and selectivity in state panel data. Indus. Relat. 50 (2), 205-240.
Alvaredo, Facundo, 2011. A note on the relationship between top income shares and the Gini coefficient. Econ. Lett. 110 (3), 274-277.
Alvaredo, Facundo, Atkinson, Anthony B., Piketty, Thomas, Saez, Emmanuel, 2013. The top 1 percent in international and historical perspective. J. Econ. Perspect. 27 (3), 3-20.
Amable, Bruno, 2003. The Diversity of Modern Capitalism. Oxford University Press, Oxford.
Andersson, Frederik, Freedman, Matthew, Haltiwanger, John, Lane, Julia, Shaw, Kathryn, 2006. Reaching for the Stars: Who Pays for Talent in Innovative Industries? NBER Working Paper 12435.
Antonczyk, Dirk, DeLeire, Thomas, Fitzenberger, Bernd, 2010. Polarization and Rising Wage Inequality: Comparing the U.S. and Germany, Discussion Paper 10-015. ZEW, Mannheim.
Ashenfelter, Orley, Card, David (Eds.), 2011. Handbook of Labor Economics, vol. 4/B. Elsevier, Amsterdam.
Atkinson, Anthony B., 1970. On the measurement of inequality. J. Econ. Theor. 2, 244-263.
Atkinson, Anthony B., 1993. What is happening to the distribution of income in the UK? Keynes lecture in economics 1992. Proc. Br. Acad. 82, 317-351, Oxford University Press.
Atkinson, Anthony B., 1997. Bringing income distribution in from the cold. Econ. J. 107 (441), 297-321.
Atkinson, Anthony B., 1999. Economic Consequences of Rolling Back the Welfare State. MIT Press and CESifo, Munich.
Atkinson, Anthony, 2007a. The long run earnings distribution in five countries: “remarkable stability,” U, V or W? Rev. Income Wealth 53 (1), 1-25.
Atkinson, Anthony, 2007b. The distribution of earnings in OECD countries. Int. Labour Rev. 146 (1-2), 41-60.
Atkinson, Anthony B., 2008. The Changing Distribution of Earnings in OECD Countries. Oxford University Press, Oxford.
Atkinson, Anthony B., 2009. Factor shares: the principal problem of political economy? Oxf. Rev. Econ. Pol. 25 (1), 3-16.
Atkinson, Anthony B., Bourguignon, Francois, 2000. Introduction. In: Handbook of Income Distribution, vol. 1. Elsevier, North Holland.
Atkinson, Anthony, Brandolini, Andrea, 2001. Promise and pitfalls in the use of secondary datasets: income inequality in OECD countries as a case study. J. Econ. Lit. 39, 771-799.
Atkinson, Anthony B., Brandolini, Andrea, 2006. From earnings dispersion to income inequality. In: Farina, F., Savaglia, E. (Eds.), Inequality andEconomic Integration. Routledge, London (Chapter2).
Atkinson, Anthony B., Morelli, S., 2012. Chartbook of Economic Inequality: 25 Countries 1911—2010. http://ineteconomics.org/sites/inet.civicactions.net/files/Note-15-Atkinson-Morelli.pdf.
Atkinson, Anthony B., Piketty, Thomas (Eds.), 2007. Top Incomes Over the Twentieth Century: A Contrast Between Continental European and English-Speaking Countries. Oxford University Press, Oxford.
Atkinson, Anthony B., Piketty, Thomas (Eds.), 2010. Top Incomes. A Global Perspective. Oxford University Press, Oxford.
Atkinson, Anthony B., Rainwater, Lee, Smeeding, Timothy, 1995. Income Distribution in European Countries, Working Paper MU 9506, Department of Applied Economics, University of Cambridge.
Atkinson, Anthony B., Piketty, Thomas, Saez, Emmanuel, 2011. Top incomes in the long run of history. J. Econ. Lit. 49 (1), 3-71.
Autor, David, 2013. The “Task Approach” to Labor Markets: An Overview, NBER Working Paper 18711.
Autor, David, Dorn, David, 2013. The growth of low-skill service jobs and the polarization of the US labor market. Am. Econ. Rev. 103 (3), 1553-1597.
Autor, David, Levy, Frank, Murnane, Richard J., 2003. The skill content of recent technological change: an empirical exploration. Q. J. Econ. 116 (4), 1279-1333.
Autor, David, Katz, Lawrence, Kearney, Melissa, 2005. RisingWage Inequality: The Role of Composition and Prices, NBER Working Paper 11628.
Autor, David, Katz, Lawrence F., Kearney, Melissa S., 2006. The polarization of the U.S. labor market. Am. Econ. Rev. Papers Proc. 96 (2), 189-194.
Autor, David, Katz, Lawrence, Kearney, Melissa, 2008. Trends in U.S. wage inequality: revising the revisionists. Rev. Econ. Stat. 90 (2), 300-323.
Autor, David, Manning, Alan, Smith, Christopher, 2010. The Contribution of the Minimum Wage to U.S. Wage Inequality Over Three Decades: A Reassessment, NBER Working Paper 16533.
Baccaro, Lucio, 2008. Labour, Globalisation and Inequality: Are Trade Unions Still Redistributive? International Institute for Labour Studies, Discussion Paper 192. ILO, Geneva.
Barth, E., Lucifora, C., 2006. Wage Dispersion, Markets and Institutions: The Effects of the Boom in Education on the Wage Structure, Discussion Paper 2181, IZA, Bonn.
Bassanini, Andrea, Duval, Romain, 2006. The determinants of unemployment across OECD countries: reassessing the role of policies and institutions. OECD Econ. Stud. 2006 (1), 7-86.
Bassanini, Andrea, Nunziata, Luca, Venn, Danielle, 2009. Job protection legislation andproductivity growth in OECD countries. Econ. Policy 24 (4), 349-402.
Bauer, Thomas, Bender, Stephan, Bonin, Holger, 2007. Dismissal protection and worker flows in small establishments. Economica 74 (296), 804-821.
Becher, Michael, Pontusson, Jonas, 2011. Whose interests do unions represent? Unionization by income in western Europe. In: Brady, David (Ed.), Comparing European workers part B: policies and institutions. Res. Sociol. Work 22, Emerald, Bingley, pp. 181-211.
Bedard, Kelly, Ferrall, Christopher, 2003. Wage and test score dispersion: some international evidence. Econ. Educ. Rev. 22 (1), 31-43.
Behar, Alberto, 2013. The Endogenous Skill Bias of Technical Change and Inequality in Developing Countries, IMF Working Paper No. 13/50.
Bell, Linda A., Freeman, Richard B., 2001. The incentive for working hard: explaining hours worked differences in the US and Germany. Labour Econ. 8, 181-202.
Belot, Michele, van Ours, Jan, 2004. Does the recent success of some OECD countries in lowering their unemployment rates lie in the clever design of their labour market reform? Oxford Econ. Papers 56 (4), 621-642.
Benassi, Chiara, 2011. The Implementation of Minimum Wage: Challenges and Creative Solutions, Global Labour University, Working Paper 12, ILO, Geneva.
Bertola, Giuseppe, 2004. A pure theory of job security and labour income risk. Rev. Econ. Stud. 71 (1), 43-61, Oxford University Press.
Bertola, Giuseppe, Boeri, Tito, 2003. Product Market Integration, Institutions and the Labour Markets, Mimeo. http://didattica.unibocconi.it/mypage/upload/48791_20090205_034431_48791_20090116_ 035648_BOERIBERTOLA14-4-03.pdf.
Bertola, Giuseppe, Blau, Francine, Kahn, Lawrence, 2001. Comparative Analysis of Labor Market Outcomes: Lessons for the US from International Long-Run Evidence, NBER Working Paper 8526.
Bertola, Giuseppe, Blau, Francine, Kahn, Lawrence, 2007. Labor market institutions and demographic employment patterns. J. Popul. Econ. 20 (4), 833—867.
Betcherman, Gordon, 2012. Labour Market Institutions. A Review of the Literature, Policy Research, Working Paper No. 6276, World Bank.
Bicakova, Alena, 2006. Marketvs. Institutions: The Trade-OffBetween Unemployment andWage Inequality Revisited, EUI Working Paper ECO No. 2006/31, Florence.
Bingley, Paul, Cappellari, Lorenzo, Westergard-Nielsen, Niels, 2013. Unemployment insurance, wage dynamics and inequality over the life cycle. Econ. J. 123 (568), 341—372.
Blackburn, McKinley, Bloom, DavidE., 1987. Earnings and income inequality in the United States. Popul. Dev. Rev. 13 (5), 575-609.
Blackburn, McKinley, Bloom, David E., 1995. Changes in the structure of family income inequality in the United States and other industrialized nations during the 1980s. Res. Labor Econ. 14, 141-170.
Blackburn, McKinley, Bloom, David E., Freeman, Richard, 1990. An era of falling earnings and rising inequality? Brookings Rev. 9 (1), 38-43.
Blanchard, Olivier, Giavazzi, Francesco, 2003. Macroeconomic effects of regulations and deregulation in goods and labor markets. Q. J. Econ. 118 (3), 879-907.
Blanchard, Olivier, Tirole, Jean, 2008. The joint design of unemployment insurance and employment protection: a first pass. J. Eur. Econ. Assoc. 6 (1), 45-77.
Blanchard, Olivier, Wolfers, Justin, 2000. The role of shocks and institutions in the rise of European unemployment: the aggregate evidence. Econ. J. 110, C1-C33.
Blanchflower, David, Oswald, Andrew, 2013. Does High Home-Ownership Impair the Labor Market? Mimeo at andrewoswald.com.
Blau, Francine, Kahn, Lawrence, 1996. International differences in male wage inequality: institutions versus market forces. J. Polit. Econ. 104 (4), 791-837.
Blau, Francine, Kahn, Lawrence, 1999. Institutions and laws in the labor market, In: Ashenfelter, Orley, Card, David E. (Eds.), Handbook of Labor Economics. vol. 3A. pp. 1399-1461 (Chapter 25).
Blau, Francine, Kahn, Lawrence, 2002. At Home and Abroad. U.S. Labor Market Performance in International Perspective. Russell Sage, New York.
Blau, Francine, Kahn, Lawrence, 2009. Inequality and earnings distribution. In: Salverda, Wiemer, Nolan, Brian, Smeeding, Timothy (Eds.), The Oxford Handbook of Economic Inequality. Oxford University Press, Oxford, pp. 177-203 (Chapter 8).
Blinder, Alan, 2007. How Many U.S. Jobs Might Be Offshorable? Working Paper 60, Center for Economic Policy Studies, Princeton.
Blinder, Alan, Krueger, Alan, 2009. Alternative Measures of Offshorability: A Survey Approach, Working Paper 190, Center for Economic Policy Studies, Princeton.
Bluestone, Barry, Harrison, Bennett, 1982. The Deindustrialization of AMERICA. Basic Books, New York.
Bluestone, Barry, Harrison, Bennett, 1988. The Great U-Turn: Corporate Restructuring and the Polarizing of America. Basic Books, New York.
Blundell, Richard, Etheridge, Ben, 2010. Consumption, income and earnings inequality in Britain. Rev. Econ. Dyn. 13 (1), 76-102.
Boeri, Tito, 2011. Institutional reforms and dualism in European labor markets. In: Ashenfelter, Orley, Card, David (Eds.), Handbook of Labor Economics. vol. 4B. Elsevier, Amsterdam, pp. 1173-1236 (Chapter 13).
Boeri, Tito, 2012. Setting the minimum wage. Labour Econ. 19 (3), 281-290.
Boeri, Tito, Jimeno, Juan, 2005. The effects of employment protection: learning from variable enforcement. Eur. Econ. Rev. 49, 2057-2077.
Boeri, Tito, van Ours, Jan, 2008. The Economics of Imperfect Labor Markets. Oxford University Press, Oxford.
Botero, Juan C., Djankov, Simeon, La Porta, Rafael, Lopez-de-Silanes, Florencio, Shleifer, Andrei, 2004. The regulation of labor. Q. J. Econ. 119 (4), 1339-1382.
Bound, John, Johnson, George, 1989. Changes in the Structure of Wages Duringthe 1980’s: An Evaluation of Alternative Explanations, NBER Working Paper 2983.
Bound, John,Johnson, George, 1992. Changes inthe structure ofwages inthe 1980’s: an evaluation ofalter- native explanations. Am. Econ. Rev. 82 (3), 371-392.
Bourguignon, Frangois, Ferreira, Francisco, Lustig, Nora (Eds.), 2004. The Microeconomics of Income Distribution Dynamics in East Asia and Latin America. World Bank and Oxford University Press, Oxford.
Bowles, Samuel, Park, Yongjin, 2005. Emulation, inequality, and work hours: was Thorsten Veblen right? Econ.J. 115, F397-F412.
Brandolini, Andrea, D’Alessio, Giovanni, 2001. Household Structure and Income Inequality, Working Paper 6/2001. Center for Household, Income, Labour and Demographic Economics CHILD.
Brandolini, Andrea, Rosolia, Alfonso, Torrini, Roberto, 2011. The Distribution of Employees’ Labour Earnings in the European Union: Data, Concepts and First Results, Working Paper 2011-198, ECINEQ.
Brewer, Mike, Wren-Lewis, Liam, 2012. Why did Britain’s households get richter? Decomposing UK Household Income Growth Between 1968 and 2008-09, Working Paper 2012-08, ISER, University of Essex.
Brewer, Mike, Duncan, Alan, Shephard, Andrew, Suarez, MariaJose, 2006. Didworkingfamilies' tax credit work? the impact of in-work support on labour supply in Great Britain. Labour Econ. 13, 699-720.
Brewer, Mike, Muriel, Alastair, Wren-Lewis, Liam, 2009. Accounting for Changes in Inequality Since 1968: Decomposition Analyses for Great Britain, Mimeo.
Brown, Charles, 1999. Minimum wages, employment, and the distribution of income. In: Ashenfelter, Orley, Card, David (Eds.), Handbook of Labor Economics. vol. 3. Elsevier, Amsterdam, pp. 2101-2163.
Briigemann, Bjorn, 2012. Does employment protection create its own political support?J. Eur. Econ. Assoc. 10 (2), 369-416.
Bryson, Alex, Freeman, Richard, Lucifora, Claudio, Pellizzari, Michele, Perotin, Virginie, 2012. Paying for Performance: Incentive Pay Schemes and Employees’ Financial Participation, CEP Discussion Paper 1112, LSE.
Brzozowski, Michael, Gervais, Martin, Klein, Paul, Suzuki, Michio, 2010. Consumption, income, and wealth inequality in Canada. Rev. Econ. Dyn. 13 (1), 52-75.
Budria, Santiago, Pereira, Pedro T., 2005. Educational Qualifications and Wage Inequality: Evidence for Europe, IZA Discussion Paper 1763. Bonn.
Burtless, Gary, 1999. Effects of growing wage disparities and changing family composition on the U.S. income distribution. Eur. Econ. Rev. 43, 853-865.
Burtless, Gary, 2009. Demographic transformation and economic inequality. In: Salverda, Weimer, Nolan, Brian, Smeeding, Timothy (Eds.), The Oxford Handbook of Economic Inequality. Oxford University Press, Oxford, pp. 435-454 (Chapter 18).
Butcher, Tim, 2011. Still evidence-based? The role of policy evaluation in recession and beyond: the case of the national minimum wage. Natl. Inst. Econ. Rev. 219, R26-R40.
Butcher, Tim, Dickens, Richard, Manning, Alan, 2012. Minimum Wages and Wage Inequality: Some Theory and an Application to the UK, CEP Discussion Paper 1177, LSE.
Cancian, Maria, Schoeni, Robert, 1998. Wives’ earnings and the level and distribution of married couples earnings in developed countries. J. Income Distribut. 8 (1), 45-61.
Card, David, DiNardo, John, 2002. Skill-biased technological change and rising wage inequality: some problems and puzzles. J. Labor Econ. 20 (4), 733-783.
Card, David, Krueger, Alan, 1995a. Myth and Measurement. The New economics of the Minimum Wage. Princeton University Press, Princeton.
Card, David, Krueger, Alan, 1995b. Time-series minimum-wage studies: a meta-analysis. Am. Econ. Rev. 85, 238-243.
Card, David, Lemieux, Thomas, Riddell, Craig, 2004. Unions and wage inequality. J. Labor Res. 25 (4), 519-562.
Cardoso, Ana, 2010. Do firms compress the wage distribution? In: Marsden, David, Rycx, Francois (Eds.), Wage Structures, Employment Adjustments and Globalization: Evidence from Linked and Firm-level Panel Data. Palgrave Macmillan, Basingstoke, pp. 202—218.
Charles, Kerwin Kofi, Guryan, Jonathan, 2007. Prejudice and the Economics of Discrimination, NBER Working Paper 13661.
Charles, Kerwin Kofi, Guryan, Jonathan, 2008. Prejudice and the economics of discrimination. J. Polit. Econ. 116 (5), 773-809.
Checchi, Daniele, Lucifora, Claudio, 2002. Unions and labour market institutions in Europe. Econ. Policy 17 (2), 362-401.
Checchi, Daniele, Garcia Pefialosa, Cecilia, 2008. Labour market institutions and income inequality. Econ. Policy 56, 600-651.
Checchi, Daniele, Garcia Pefialosa, Cecilia, 2010. Labour shares and the personal distribution of income in the OECD. Economica 77 (307), 413-450.
Cheon, Byung You, Chang, Jiyeun Hwang, Seong Shin, Gyu, Wook Kang, Jin, Wook Lee, Shin, Hee Kim, Byung, Joo, Hyun, 2013. Growing Inequality and Its Impacts in Korea, Country Report to the GINI project, http://gini-research.org/CR-Korea.
Chetty, Raj, 2008. Moral Hazard vs. Liquidity and Optimal Unemployment Insurance, NBER Working Paper 13967.
Christopoulou, Rebekka, Jimeno, Juan F., Lamo, Ana, 2010. Changes in the Wage Structure in EU Countries, Documentos de Trabajo 1017. Banco de Espafia.
Coelli, Michael, Fahrer, Jerome, Lindsay, Holly, 1994. Wage Dispersion and Labour Market Institutions: A Cross Country Study, Research Discussion Paper 9404. Reserve Bank of Australia.
Congressional Budget Office (CBO), 2012. The Distribution of Household Income and Average Federal Tax Rates, 2008 and 2009. Supplemental data, http://www.cbo.gov/publication/43373.
Conyon, Martin, Fernandes, Nuno, Ferreira, Miguel, Matos, Pedro, Murphy, Kevin, 2011. The Executive Compensation Controversy: A Transatlantic Analysis, Fondazione Rodolfo De Benedetti.
Corluy, Vincent, Vandenbroucke, Frank, 2013. IndividualEmployment, HouseholdEmploymentandRisk of Poverty in the EU. A Decomposition Analysis, Eurostat.
Corsini, Lorenzo, 2008. Institutions, Technological Change and the Wage Differentials Between Skilled and Unskilled Workers: Theory and Evidence from Europe, IRISS Working Paper 2008-02.
Cowell, Frank, 2000. Measurement of inequality, In: Atkinson, A.B., Bourguignon, F. (Eds.), Handbook of Income Distribution. vol. 1. pp. 87-166, Elsevier, Amsterdam (Chapter 2).
Cowell, Frank, Fiorio, Carlo, 2011. Inequality decompositions—a reconciliation. J. Econ. Inequality 9, 509-528.
Dahl, Christian, le Maire, Daniel, Munch, Jakob, 2011. Wage Dispersion and Decentralization of Wage Bargaining, IZA Discussion Paper 6176.
Daly, Mary, Valetta, Robert, 2006. Inequality and poverty in United States: the effects of rising dispersion of men’s earnings and changing family behaviour. Economica 73 (289), 75-98.
De Graaf-Zijl, Marloes, Nolan, Brian, 2011. Household joblessness and its impact on poverty and deprivation in Europe. J. Eur. Soc. Policy 21, 413-431.
De Linde Leonard, M., Stanley, T.D., Doucouliagos, Hristos, 2014. Does the UK minimum wage reduce employment? A meta-regression analysis. Br. J. Indus. Relat. 52 (3), 499-520.
Deininger, Klaus, Squire, Lyn, 1996. A new data set measuring income inequality. World Bank Econ. Rev. 10 (3), 565-591.
Del Boca, Daniela, Pasqua, Sylvia, 2003. Employment patterns of husbands and wives and family income distribution in Italy (1977-98). Rev. Income Wealth 49 (2), 221-245.
DiNardo, John, Lemieux, Thomas, 1997. Diverging male wage inequality in the United States and Canada, 1981-1988: do institutions explain the difference? Indust. Labor Relat. Rev. 50 (4), 629-651.
DiNardo, John, Pischke, Jorn-Steffen, 1997. The returns to computer use revisited: have pencils changed the wage structure too? Q. J. Econ. 112 (1), 291-303.
DiNardo, John, Fortin, Nicole, Lemieux, Thomas, 1996. Labor market institutions and the distribution of wages, 1973-1992: a semiparametric approach. Econometrica 64 (5), 1001-1044.
Dingeldey, Irene, 2001. European tax systems and their impact on family employment patterns.}. Soc. Policy 30, 653-672.
DiPrete, Thomas, 2007. What has sociology to contribute to the study of inequality trends? An historical and comparative perspective. Am. Behav. Sci. 50 (5), 603-618.
Dolado, Juan, Kramarz, Francis, Machin, Stephen, Manning, Alan, Margolis, David, Teulings, Coen, 1996. The economic impact of minimum wage in Europe. Econ. Policy 23, 317-372.
Dolton, Peter, Bondibene, Chiara Rosazza, 2011. An evaluation of the international experience of minimum wages in an economic downturn, Research Report for the Low Pay Commission, University of London, Royal Holloway College.
Domeij, David, Floden, Martin, 2010. Inequality trends in Sweden 1978-2004. Rev. Econ. Dyn. 13 (1), 179-208.
Dooley, Martin, Gottschalk, Peter, 1984. Earnings inequality among males in the United States: trends and the effect of labor force. J. Polit. Econ. 92 (1), 59-89.
Dooley, Martin, Gottschalk, Peter, 1985. The increasing proportion of men with low earnings in the United States. Demography 22 (1), 25-34.
Doucouliagos, Hristos, Stanley, T.D., 2009. Publication selection bias in minimum-wage research? A metaregression analysis. Br. J. Ind. Relat. 47 (22), 406-428.
Dube, Arindrajit, 2013. Minimum Wages and the Distribution of Family Incomes. https://dl. dropboxusercontent.com/u/15038936/Dube_MinimumWagesFamilyIncomes.pdf (December 30, 2013).
Dube, Arindrajit, Lester, William, Reich, Michael, 2010. Minimum wage effects across state borders: estimates using contiguous counties. Rev. Econ. Stat. 92 (4), 945-964.
Dube, Arindrajit, Lester, William, Reich, Michael, 2012. Minimum Wage Shocks, Employment Flows and Labor Market Frictions. Institute for Research on Labor and Employment, Berkeley, CA.http:// escholarship.org/uc/item/76p927ks.
Dunne, Timothy, Foster, Lucia, Haltiwanger, John, Troske, Kenneth R., 2004. Wage and productivity dispersion in United States manufacturing: the role of computer investment. J. Labor Econ. 22 (2), 397-429.
Dupuy, Arnaud, Fernandez-Kranz, Daniel, 2011. International differences in the family gap in pay: the role of labour market institutions. Appl. Econ. 43, 413-438.
Dustmann, Christian, Ludsteck, Johannes, Schonberg, Uta, 2009. Revisiting the German wage structure. Q.J. Econ. 124 (2), 843-881.
Eichhorst, Werner, Feil, Michael, Braun, Christoph, 2008. What Have We Learned? Assessing Labor Market Institutions and Indicators, IZA Discussion Paper 3470. Bonn.
Eissa, Nada, Hoynes, Hilary, 2004. Taxes and the labor market participation of married couples: the earned income tax credit. J. Public Econ. 88, 1931-1958.
Eissa, Nada, Hoynes, Hilary, 2006. Behavioral responses to taxes: lessons from the EITC and labor supply. In: Poterba,J.M. (Ed.), TaxPolicy andthe Economy. MIT Press, Cambridge MA, pp. 73-110 (Chapter3).
Farber, Henry, Valletta, Robert, 2013. Do extended Unemployment Benefits Lengthen Unemployment Spells? Evidence From Recent Cycles in the US Labour Market, Working Paper 573, Princeton University, Industrial Relations section.
Fields, Gary, 2003. Accounting for income inequality and its change: a new method, with application to the distribution of earnings in the United States. Res. Labor Econ. 22, 1-38.
Fiori, Giuseppe, Nicoletti, Giuseppe, Scarpetta, Stefano, Schiantarelli, Fabio, 2012. Employment effects of product and labour market reforms: are there synergies? Econ. J. 122, F79-F104.
Firpo, Sergio, Fortin, Nicole, Lemieux, Thomas, 2009. Unconditional quantile regressions. Econometrica 77 (3), 953-973.
Firpo, Sergio, Fortin, Nicole M., Lemieux, Thomas, 2011. Occupational Tasks and Changes in the Wage Structure, IZA Discussion Paper 5542. Bonn.
Flaig, Gebhard, Rottmann, Horst, 2011. Labour Market Institutions and Unemployment. An International Comparison, CESifo Working Paper 3558.
Forster, Michael, 1994. Measurement of Low Incomes and Poverty in a Perspective of International Comparisons, OECD Labour Market and Social Policy Occasional Papers 14.
Fortin, Nicole, Lemieux, Thomas, 1997. Institutional changes and rising wage inequality: is there a linkage? J. Econ. Perspect. 1 (2), 75-96.
Fortin, Nicole, Lemieux, Thomas, 2014. Changes in wage inequality in Canada: an interprovincial perspective, First draft, http://faculty.arts.ubc.ca/nfortin/FortinLemieux_Inequality_%20provinces.pdf.
Fortin, Nicole, Lemieux, Thomas, Firpo, Sergio, 2011. Decomposition methods in economics. In: Ashenfelter, Orley, Card, David (Eds.), Handbook of Labor Economics. vol. IIIA. Elsevier, Amsterdam, pp. 1463-1555. (Chapter 1; also NBERWorking Paper 16045, 2010).
Fortin, Nicole M., Schirle, Tammy D., 2006. Gender dimensions of changes in earnings inequality in Canada. In: Green, DavidA., Kesselman, Jonathan R. (Eds.), Dimensions of Inequality in Canada. Vancouver, UBC Press, pp. 307-346.
Freeman, Richard, 1980. Unionism and the dispersion of wages. Ind. Labor Relat. Rev. 34 (2), 3-23.
Freeman, Richard, 1988. Labour market institutions and economic performance. Econ. Policy 3 (6), 63-88.
Freeman, Richard, 1991. How Much Has De-Unionisation Contributed to the Rise in Male Earnings Inequality? NBER Working Paper 3826 (In: Danziger and Gottschalk (Eds.), Uneven Tides, 1992).
Freeman, Richard (Ed.), 1994. Working Under Different Rules. Russell Sage, New York.
Freeman, Richard, 2000. Single Peaked vs. Diversified Capitalism: The Relation Between Economic Institutions and Outcomes, NBER Working Paper 7556.
Freeman, Richard B., 2001. Single Peaked Vs. Diversified Capitalism: The Relation Between Economic Institutions and Outcomes, Working Paper No. 7556, NBER, Boston.
Freeman, Richard, 2005. Labour Market Institutions without Blinders: The Debate over Flexibility and Labour Market Performance, NBER Working Paper 11286.
Freeman, Richard, 2006. The great doubling: the challenge of the new global labor market. http://emlab. berkeley.edu/users/webfac/eichengreen/e183_sp07/great_doub.pdf.
Freeman, Richard, 2007. Labor market institutions around the world, NBER Working Paper 13242.
Freeman, Richard, 2009. Labor Regulations, Unions, and Social Protection in Developing Countries: Market Distortions or Efficient Institutions? NBER Working Paper 14789.
Freeman, Richard, Katz, Lawrence (Eds.), 1995. Differences and Changes in Wage Structures. University of Chicago Press, Chicago.
Freeman, Richard, Medoff, James, 1984. What Do Unions Do? Basic Books, New York.
Freeman, Richard, Schettkat, Ronald, 2001. Skill compression, wage differentials and employment: Germany vs. the US. Oxf. Econ. Pap. 53 (3), 582-603.
Friedman, Milton, 1968. The role of monetary policy. Am. Econ. Rev. 58 (1), 1-17.
Fuchs-Schtindeln, Nicola, Krueger, Dirk, Sommer, Mathias, 2010. Inequality trends for Germany in the last two decades: a tale of two countries. Rev. Econ. Dyn. 13 (1), 103-132.
Garnero, Andrea, Kampelmann, Stephan, Rycx, Francois, 2013. Minimum Wage Systems and Earnings Inequalities: Does Institutional Diversity Matter? DULBEA Working Paper 13-06.
Gautie, Jercome, Schmitt, John (Eds.), 2010. Low-Wage Work in Wealthy Countries. Russell Sage, New York.
Gindling, Thomas, Terrell, Katherine, 2009. Minimum wages, wages and employment in various sectors in Honduras. Labour Econ. 16 (3), 291-303.
Giuliano, Laura, 2013. Minimum wage effects on employment, substitution, and the teenage labor supply: evidence from personnel data. J. Labor Econ. 31 (1), 155-194.
Glyn, Andrew, 2009. Functional distribution and inequality. In: Salverda, Weimer, Nolan, Brian, Smeeding, Timothy M. (Eds.), Oxford Handbook of Economic Inequality. Oxford University Press, Oxford, pp. 101-126 (Chapter 5).
Glyn, Andrew, Baker, Dean, Howell, David, Schmitt, John, 2003. Labor Market Institutions and Unemployment: A Critical Review of the Cross-Country Evidence, Discussion Paper 168. Department of Economics, University of Oxford, Oxford.
Golden, Miriam, Wallerstein, M., 2006. Domestic and International Causes for the Rise of Pay Inequality: Post -Industrialism, Globalization and Labor Market Institutions. Mimeo.
Golden, Miriam, Wallerstein, Michael, 2011. Domestic and international causes for the rise of pay inequality in OECD nations between 1980 and 2000. In: Comparing European Workers. Part A: Experiences and Inequalities. In: Research in the Sociology of Work, vol. 22. pp. 209-249.
Goos, Maarten, Manning, Alan, 2003. Lousy and LovelyJobs: the Rising Polarization of Work in Britain. London, LSE, CEP Working Paper 604.
Goos, Maarten, Manning, Alan, 2007. Lousy andlovelyjobs: the risingpolarization of work in Britain, Rev. Econ. Stat. 89 (1), 118—133.
Goos, Maarten, Manning, Alan, Salomons, Anna, 2009. Job polarization in Europe. Am. Econ. Rev. 99 (2), 58-63.
Goos, Maarten, Manning, Alan, Salomons, Anna, 2010. ExplainingJob Polarization in Europe: The Roles of Technology, Globalization and Institutions, CEP Discussion Paper 1026, LSE.
Goos, Maarten, Manning, Alan, Salomons, Anna, 2011. ExplainingJob Polarization: The Roles ofTechnol- ogy, Offshoring and Institutions. KU Leuven, Center for Economic Studies, Discussion Paper 11.34.
Goos, Maarten, Manning, Alan, Salomons, Anna, 2014. Explainingjob polarization: routine-biased technological change and offshoring. Am. Econ. Rev. 104 (8), 2509-2526.
Gottschalk, Peter, Danziger, Sheldon, 2005. Inequality of wage rates, earnings and family income in the United States 1975-2002. Rev. Income Wealth 51 (2), 231-254.
Gottschalk, Peter, Joyce, Mary, 1998. Cross-national differences in the rise in earnings inequality: market and institutional factors. Rev. Econ. Stat. 80 (4), 489-502.
Gottschalk, Peter, Smeeding, Timothy, 1997. Cross-national comparisons of earnings and income inequality. J. Econ. Lit. 35, 633-687.
Gregg, Paul, Wadsworth, Jonathan, 1996. More work in fewer households? In: Hills, J. (Ed.), New Inequalities. Cambridge University Press, London, pp. 181-207.
Gregg, Paul, Wadsworth, Jonathan, 1998. It Takes Two: Employment Polarisation in the OECD, Discussion Paper 304, Centre for Economic Performance, London.
Gregg, Paul, Wadsworth, Jonathan, 2008. Two sides to every story: measuring polarization and inequality in the distribution of work. J. R. Stat. Soc. Ser. A 171 (4), 857-875.
Gregg, Paul, Scutella, Rosanna, Wadsworth, Jonathan, 2010. Reconciling workless measures at the individual and household level. Theory and evidence from the United States, Britain, Germany, Spain and Australia. J. Popul. Econ. 23, 139-167.
Hall, Robert, Krueger, Alan, 2010. Evidence on the Determinants of the Choice Between Wage Posting and Wage Bargaining, NBER Working Paper 16033.
Hall, Peter, Soskice, David (Eds.), 2001. Varieties of Capitalism: The Institutional Foundations of Comparative Advantage. Oxford University Press, Oxford.
Harrison, Bennet, Tilly, Chris, Bluestone, Barry, 1986. Wage inequality takes a great U-turn. Challenge 29 (1), 26-32, Symposium of the Joint Economic Committee of Congress on the 40th Anniversary of the Employment Act of 1946 (Part 1).
Heathcote, Jonathan, Perri, Fabrizio, Violante, Giovanni, 2010. Unequal we stand: an empirical analysis of economic inequality. Rev. Econ. Dyn. 13, 15-51.
Heckman, James, Sedlacek, Guilherme, 1985. Heterogeneity, aggregation, and market wage functions: an empirical model of self-selection in the labor market. J. Polit. Econ. 93 (9), 1077-1125.
Henle, Peter, 1972. Distribution of earned income. Monthly Labor Rev. 95 (12), 16-27.
Henle, Peter, Ryscavage, Paul, 1980. The distribution of earned income among men and women, 1958-77. Monthly Labour Rev. 103 (4), 3-10.
Heshmati, Almas, 2004. A Review of Decomposition of Income Inequality, Discussion Paper 1221, IZA Bonn.
Hills, John, Brewer, Mike, Jenkins, Stephen, Lister, Ruth, Lupton, Ruth, Machin, Stephen, Mills, Colin, Modood, Tariq, Rees, Teresa, Riddell, Sheila, 2010. An Anatomy of Economic Inequality in the UK: Report of the National Equality Panel. http://sticerd.lse.ac.uk/case/_new/publications/ NEP.asp.
Holzmann, Robert, Pouget, Yann, Vodopivec, Milan, Weber, Michael, 2011. Severance Pay Programs around the World: History, Rationale, Status, and Reforms, IZA Discussion Paper 5731.
Hyslop, Dean, 2001. Rising US earnings inequality and family labor supply: the covariance structure of intrafamily earnings. Am. Econ. Rev. 91, 755-777.
ILO, 2008. Global Wage Report 2008/09. Minimum Wages and Collective Bargaining: Towards Policy Coherence, Geneva.
ILO, 2010. Global Wage Report 2010/11. Wage Policies in Times of Crisis, Geneva.
Japelli, Tullio, Pistaferri, Luigi, 2010. Does consumption inequality track income inequality in Italy? Rev. Econ. Dyn. 13 (1), 133-153.
Jenkins, Stephen, 1995. Accounting for inequality trends: decomposition analyses for the UK, 1971-86. Economica 62 (245), 29-63.
Jenkins, Stephen, van Kerm, Philippe, 2009. The measurement of economic inequality. In: Salverda, Weimer, Nolan, Brian, Smeeding, Timothy (Eds.), The Oxford Handbook of Economic Inequality. Oxford University Press, Oxford, pp. 40-67 (Chapter 3).
Johnson, David, Wilkins, Roger, 2003. The Effects of Changes in Family Composition and Employment Patterns on the Distribution of Income in Australia: 1982 to 1997-1998, Working Paper 19/03, Melbourne Institute of Applied Economic and Social Research.
Juhn, Chinhui, Murphy, Kevin, Pierce, Brooks, 1993. Wage inequality andthe rise in returns to skill.J. Polit. Econ. 101, 410-442.
Kahn, James, 2005. Labor Supply and the Changing Household. Paper presented to Society for Economic Dynamics.
Kampelmann, Stephan, Garnero, Andrea, Rycx, Francois, 2013. Minimum Wages in Europe: Does the Diversity of Systems Lead to a Diversity of Outcomes? ETUI Report 128, Brussels.
Karabarbounis, Loukas, Neiman, Brent, 2013. The Global Decline of the Labor Share, NBER Working Paper 19136.
Karoly, Lynn, 1988. A Study of the Distribution of Individual Earnings in the United States from 1967 to1986. PhD Thesis, Yale University.
Karoly, Lynn, 1992. Changes in the distribution of individual earnings in the United States: 1967-1986. Rev. Econ. Stat. 74 (1), 107-115.
Karoly, Lynn, 1993. The trend in inequality among families, individuals and workers in the United States: a twenty-five year perspective, In: Danziger, S., Gottschalk, P. (Eds.), Uneven Tides, Rising Inequality in America. Russell Sage, New York, pp. 19-97 (Chapter 2).
Karoly, Lynn, Burtless, Gary, 1995. Demographic change, rising earnings inequality, and the distribution of personal well-being, 1959-1989. Demography 32 (3), 379-405.
Katz, Lawrence, Autor, David, 1999. Changes in the Wage Structure and Earnings Inequality. In: Ashenfelter, Orley, Card, David (Eds.), Handbook of Labor Economics. vol. IIIA. Elsevier, Amsterdam, pp. 1463-1555.
Katz, Lawrence, Murphy, Kevin, 1992. Changes in relative wages: supply and demand factors. Q. J. Econ. CVII, 35-78.
Kenworthy, Lane, 2001. Wage-setting measures: a survey and assessment. World Polit. 54, 57-98.
Kenworthy, Lane, 2008. Sources of Equality and Inequality: Wages, Jobs, Households, and redistribution, Working Paper 471, Luxembourg Income Study. Chapter 3 of Kenworthy, Jobs with Equality, Oxford University Press, 2008.
Kenworthy, Lane, Pontusson, Jonas G, 2005. Rising inequality and the politics of redistribution in affluent countries. Perspect. Polit. 3 (3), 449-471.
Kierzenkowski, Rafal, Koske, Isabel, 2012. Less Income Inequality and More Growth—Are they Compatible? Part 8. The Drivers of Labour Income Inequality—A Literature Review, OECD Economics Department Working Paper 931, OECD Publishing.
Kimhi, Ayal, 2011. On the interpretation (and misinterpretation) of inequality decompositions by income sources. World Dev. 39 (10), 1888-1890.
Kluve, Jochen, 2010. The effectiveness of European active labor market programs. Labour Econ. 17 (6), 904-918.
Koeniger, Winfried, Leonardi, Marco, Nunziata, Luca, 2007. Labor market institutions and wage inequality. Ind. Labor Relat. Rev. 60 (3), 340-356.
Krueger, Dirk, Perri, Fabrizio, 2006. Does income inequality lead to consumption inequality? Evidence and theory. Rev. Econ. Stud. 73 (1), 163-193.
Kugler, Adriana, Pica, Giovanni, 2008. Effects ofemploymentprotection on workerandjob flows: evidence from the 1990 Italian reform. Labour Econ. 15 (1), 78-95.
Lalive, Rafael, Schlosser, Analia, Steinhauer, Andreas, Zweimtiller, Josef, 2011. Parental Leave and Mothers’ Careers: The Relative Importance ofJob Protection and Cash Benefits, IZA Discussion Paper 5792, Bonn.
Lane, Julia, 2009. Inequality and the labour market — employers. In: Salverda, Wiemer, Nolan, Brian, Smeeding, Timothy (Eds.), The Oxford Handbook on Economic Inequality. Oxford University Press, Oxford, pp. 204-229 (Chapter 9).
Larrimore, Jeff, 2013. Accounting for United States household income inequality trends: the changing importance ofhousehold structure and male and female labour earnings inequality. Rev. Income Wealth 101 (3), 173-177.
Layard, Richard, Nickell, Stephen, Jackman, Richard, 1991. Unemployment. Macroeconomic Performance and the Labour Market. Oxford University Press, Oxford.
Lee, David, 1999. Wage inequality in the United States during the 1980s: rising dispersion or falling minimum wage? Q. J. Econ. 114 (3), 977-1023.
Lehrer, Evelyn, 2000. The impact of women’s employment on the distribution of earnings among married- couple households: a comparison between 1973 and 1992-1994. Q. Rev. Econ. Finance 40, 295-301.
Leigh, Andrew, 2009. Top incomes, In: Salverda, Wiemer, Nolan, Brian, Smeeding, Timothy (Eds.), The Oxford Handbook of Economic Inequality. Oxford University Press, Oxford, pp. 150-174 (Chapter 7).
Lemieux, Thomas, 2006a. Postsecondary education and increasing wage inequality. Am. Econ. Rev. 96 (2), 195-199.
Lemieux, Thomas, 2006b. Postsecondary Education and Increasing Wage Inequality, NBER Working Paper 12077.
Lemieux, Thomas, 2006c. Increasing residual wage inequality: composition effects, noisy data, or rising demand for skill? Am. Econ. Rev. 96 (3), 461-498.
Lemieux, Thomas, 2008. The changing nature of wage inequality. J. Popul. Econ. 21 (1), 21-48.
Lemieux, Thomas, 2010. What Do We Really Know about Changes in Wage Inequality?. In: Abraham, Katharine, Spletzer, James, Harper, Michael (Eds.), Labor in the New Economy. NBER Books, University of Chicago Press, Boston/Chicago, pp. 17-59 (Chapter 1).
Lemieux, Thomas, 2011. Wage inequality: a comparative perspective. Aust. Bull. Labour 37 (1), 2-32.
Lemieux, Thomas, Macleod, Bentley, Parent, Daniel, 2009. Performance pay and wage inequality. Q. J. Econ. 124 (1), 1-49.
Lemos, Sara, 2009. Minimum wage effects in a developing country. Labour Econ. 16, 224-237.
Leonardi, Marco, Pica, Giovanni, 2013. Who pays for it? The heterogeneous wage effects of employment protection legislation. Econ. J. 123 (573), 1236-1278.
Lerman, Robert, Yitzhaki, Shlomo, 1984. A note on the calculation and interpretation of the Gini index. Econ. Lett. 15 (3-4), 363-368.
Leuven, Edwin, Oosterbeek, Hessel, van Ophem, Hans, 1997. International Comparisons of Male Wage Inequality; Are the Findings Robust? Tinbergen Institute, Working Paper 97-59, University of Amsterdam.
Leuven, Edwin, Oosterbeek, Hessel, van Ophem, Hans, 2004. Explaining international differences in male skill wage differentials by differences in demand and supply of skill. Econ. J. 114, 466-486.
Levy, Frank, Murnane, Richard, 1992. U.S. earnings levels and earnings inequality: a review of recent trends and proposed explanations. J. Econ. Lit. 30, 1333-1381.
Levy, Frank, Murnane, Richard, 2005. How Computerized Work and Globalization Shape Human Skill Demands, MIT IPC Working Paper IPC-05-006.
Levy, Frank, Temin, Peter, 2007. Inequality and Institutions in 20th Century America, NBER Working Paper 13106.
Liebman, Jeffrey, 1998. The impact of the earned income tax credit on incentives and income distribution. In: Poterba, James (Ed.), Tax Policy and the Economy. vol. 12.
Liu, Yujia, Grusky, David, 2013. The payoff to skillin the third industrial revolution. Am. J. Sociol. 118 (5), 1330-1374.
Lu, Yuqian, Morissette, Rene, Schirle, Tammy, 2011. The growth of family earnings inequality in Canada 1980-2005. Rev. Income Wealth 57 (1), 23-39.
Lucifora, Claudio, Salverda, Wiemer, 2009. Low pay, In: Salverda, Wiemer, Nolan, Brian, Smeeding, Timothy (Eds.), The Oxford Handbook of Economic Inequality. Oxford University Press, Oxford, pp. 256-283 (Chapter 11).
Lydall, Harold, 1968. The Structure of Earnings. Clarendon Press, Alderley, Gloucestershire.
Machin, Stephen, 1997. The decline of labour market institutions rise in wage inequality in Britain. Eur. Econ. Rev. 41 (3-5), 647-657.
Machin, Stephen, 2008. An appraisal of economic research on changes in wage inequality. Labour 22 (Special issue), 7-26.
Mandel, Hadas, Semyonov, Moshe, 2005. Family policies, wage structures, and gender gaps: sources ofearn- ings inequality in 20 countries. Am. Sociol. Rev. 70, 949-967.
Mandelbrot, Benoit, 1962. Paretian distributions and income maximization. Q. J. Econ. 76 (1), 57-85.
Manning, Alan, 2011. Imperfect competition in the labour market. In: Ashenfelter, Orley, Card, David (Eds.), Handbook of Labor Economics. vol. 4B. Elsevier, Amsterdam, pp. 973-1041.
Manzo IV, Frank, Bruno, Robert, 2014. Which Labor Market Institutions Reduce Income Inequality? Labor Unions, Prevailing Wage Laws, and Right-to-Work Laws in the Construction Industry, Illinois Economic Policy Institute (ILEPI). Research Report.
Martin, John, Scarpetta, Stefano, 2011. Setting It Right: Employment Protection, Labour Reallocation and Productivity, IZA Policy Paper 27, 27.
Martins, Pedro, 2009. Dismissals for cause: the difference that just eight paragraphs can make. J. LaborEcon. 27 (2), 257-279.
Matano, Alessia, Naticchioni, Paolo, 2011. Is there rent sharing in Italy? evidence from employer-employee data. Eur. J. Comp. Econ. 8 (2), 265-279.
Messina, Julian, Vallanti, Giovanna, 2007. Job flow dynamics and firing restrictions: evidence from Europe. Econ. J. 117, F279-F301.
Metcalf, David, 2004. The impact of the national minimum wage on the pay distribution, employment and training. Econ. J. 114, C84-C86.
Mishel, Lawrence, Shierholdz, Heidi, Schmitt, John, 2013. Don’t Blame the Robots. Assessing the Job Polarization Explanation of Growing Wage Inequality, Working Paper, EPI, Washington (19 November).
Mookherjee, Dilip, Shorrocks, Anthony, 1982. A decomposition analysis of the trend in UK income inequality. Econ. J. 92 (368), 886-902.
Mortensen, Dale, 2005. Wage Dispersion: Why Are Similar Workers Paid Differently? MIT Press, Cambridge MA.
Mtihlau, Peter, Horgan, Justine, 2001. Labour Market Status and the Wage Position of the Low Skilled: The Role of Institutions and of Demand and Supply—Evidence from the International Adult Literacy Survey, Working Paper 5, European Low-wage employment Research network. http://www.uva-aias. net/uploaded_files/regular/05MuehlauHorgan.pdf.
Neal, Derek, Rosen, Sherwin, 2000. Theories of the distribution of earnings, In: Atkinson, A., Bourguignon, F. (Eds.), Handbook of Income Distribution, pp. 379-428, Elsevier, Amsterdam.
Neumark, David, Wascher, William, 2008. Minimum Wages. MIT Press, Cambridge MA.
Neumark, David, Schweitzer, Mark, Wascher, William, 2004. Minimum wage effects throughout the wage distribution. J. Hum. Resour. 39 (2), 425-445.
Neumark, David, Salas, Ian, Wascher, William, 2013. Revisiting the Minimum Wage-Employment Debate: Throwing Out the Baby with the Bathwater? NBER Working Paper 18681.
Nickell, Stephen, 1997. Unemployment and labor market rigidities: Europe versus North America. J. Econ. Perspect. 11, 55-74.
Nickell, Stephen, Layard, Richard, 1999. Labour market institutions and economic performance, In: Ashenfelter, Orley, Card, David (Eds.), pp. 3029-3084 (Chapter 46).
Nickell, Stephen, Nunziata, Luca, Ochel, Wolfgang, 2005. Unemployment in the OECD Since the 1960s. What do we know? Econ. J. 115 (500), 1-27.
Nunziata, Luca, 2005. Institutions and wage determination: a multi-country approach. Oxf. Bull. Econ. Stat. 67 (4), 435-466.
Ochel, Wolfgang. 2005. Concepts and Measurement of Labour Market Institutions. CESifo DICE Report 4/2005, pp. 40-55.
OECD, 2004. Employment Outlook. OECD Publishing, Paris.
OECD, 2009. What Are Equivalence Scales?. OECD Publishing, Paris.
OECD, 2011. Divided We Stand: Why Inequality Keeps Rising. OECD Publishing, Paris.
OECD, 2012. Employment Outlook. OECD Publishing, Paris.
OECD, 2013. OECD Skills Outlook 2013. First Results from the Survey of Adult Skills. OECD Publishing, Paris.
Oliver, Rebecca, 2008. Diverging developments in wage inequality which institutions matter? Comp. Polit. Stud. 41 (12), 1551-1582.
Olivetti, Claudia, Petrongolo, Barbara, 2008. Unequalpay orunequal employment? A cross-country analysis of gender gaps. J. Labor Econ. 26 (4), 621-654.
Oswald, Andrew, 1996. A Conjecture on the Explanation for High Unemployment in the Industrialised Nations, Warwick Economic Research Papers 475.
Paul, Satya, 2004. Income sources effects on inequality. J. Dev. Econ. 73 (1), 435-451.
Peichl, Andreas, Pestel, Nico, Schneider, Hilmar, 2010. Does Size Matter? The Impact of Changes in Household Structure on Income Distribution in Germany, CESifo Working Paper 3219.
Philippon, T., 2001. The impact of differential payroll tax subsidies on minimum wage employment. J. Public Econ. 82, 115-146.
Pierce, Brooks, 2001. Compensation inequality. Q. J. Econ. 116 (4), 1493-1525.
Pierce, Brooks, 2010. Recent trends in compensation inequality. In: Abraham, Katharine, Spletzer, James, Harper, Michael (Eds.), Labor in the New Economy. NBER Books, University of Chicago Press, Boston/Chicago, pp. 63-98 (Chapter 2).
Pijoan-Mas, Josep, Sanchez-Marcos, Virginia, 2010. Spain is different: falling trends of inequality. Rev. Econ. Dyn. 13 (1), 154-178.
Piketty, Thomas, 2003. Income inequality in France, 1901-1998. J. Polit. Econ. 111, 1004-1042.
Piketty, Thomas, Saez, Emmanuel, 2003. Income inequality in the United States, 1913-1998. Q. J. Econ. 118, 1-39.
Piketty, Thomas, Saez, Emmanuel, 2006. The evolution of top incomes: a historical and international perspective. Am. Econ. Rev. 96 (2), 200-205.
Piketty, Thomas, Saez, Emmanuel, 2012. Optimal Labor Income Taxation, NBER Working Paper18521.
Piketty, Thomas, Saez, Emmanuel, 2013. Optimal labor income taxation, vol. 5. In: Auerbach, Alan, Chetty, Raj, Feldstein, Martin, Saez, Emmanuel (Eds.), Handbook of Public Economics. Elsevier, Amsterdam (Chapter 7).
Piketty, Thomas, Saez, Emmanuel, Stantcheva, Stefanie, 2011. Optimal Taxation of Top Labor Incomes: A Tale of Three Elasticities, NBER Working Paper17616.
Plotnick, Robert, 1982. Trends in male earnings inequality. South. Econ. J. 48 (3), 724-732.
Reed, Deborah, Cancian, Maria, 2001. Sources of inequality: measuring the contributions of income sources to rising family income inequality. Rev. Income Wealth 47 (3), 321-333.
Rogerson, Richard, Shimer, Robert, 2011. Search in macroeconomic models of the labor market. In: Ashenfelter, Orley, Card, David (Eds.), Handbook of Labor Economics. vol. 4A. Elsevier, Amsterdam, pp. 619-700.
Rogerson, Richard, Shimer, Robert, Wright, Randall, 2005. Search-theoretic models of the labor market: a survey. J. Econ. Lit. 43 (4), 959-988.
Rosen, Sherwin, 1986. The theory of equalizing differences. In: Ashenfelter, Orley, Layard, Richard (Eds.), Handbook of Labor Economics. vol. 1. Elsevier, North Holland, pp. 641-692.
Rueda, David, Pontusson, Jonas, 2000. Wage inequality and varieties of capitalism. World Polit. 52 (3), 350-383.
Saint-Paul, Gilles, 2000. The Political Economy of Labour Market Institutions. Oxford University Press, Oxford.
Salverda, Wiemer, 2008. Labor market institutions, low-wage work, and job quality, In: Salverda, Weimer, van Klaveren, Maarten, van der Meer, Marc (Eds.), Low-Wage Work in the Netherlands. Russell Sage, NewYork, pp. 63-131 (Chapter 3).
Salverda, Wiemer, 2009. The bite and effects of wage bargaining in the Netherlands 1995-2005. In: Keune, Maarten, Galgoczi, Bela (Eds.), Wages andWage Bargaining in Europe; Developments Since the Mid-1990s. ETUI, Brussels, pp. 225-254.
Salverda, Wiemer, 2013. The Evolution of Dutch Top-Income Shares Until 2012 and the Puzzle of Stability, AIAS Working Paper.
Salverda, Wiemer, Atkinson, Anthony B., 2007. Top incomes in the Netherlands over the twentieth century, In: Atkinson, Piketty, (Eds.), (Chapter 10).
Salverda, Wiemer, Haas, Christina, 2014. Earnings, employment and income inequality, In: Salverda, Wiemer, Nolan, Brian, Checchi, Daniele, Marx, Ive, McKnight, Abigail, Gyogy TOth, Istvan, van de Werfhorst, Herman (Eds.), Changing Inequalities in Rich Countries: Analytical and Comparative Perspectives. Oxford University Press, Oxford (Chapter 3).
Salverda, Wiemer, Haas, Christina, de Graaf-Zijl, Marloes, Lancee, Bram, Notten, Natascha, Ooms, Tahnee, 2013. Growing Inequalities and Their Impacts in The Netherlands, Country Report for The Netherlands. GINI project, http://www.gini-research.org/system/uploads/512/original/ Netherlands.pdf?1380138293.
Salverda, Wiemer, Nolan, Brian, Maitre, Bertrand, Miihlau, Peter, 2001. Benchmarking Low-Wage and High-Wage Employment in Europe and the United States, Report to the European Commission DG Employment and Social Affairs. http://www.uva-aias.net/uploaded_files/regular/draftdef0-1-1. pdf Brussels.
Scheve, Kenneth, Stasavage, David, 2009. Institutions, partisanship, and inequality in the long run. World Polit. 61 (2), 215-253.
Schivardi, Fabiano, Torrini, Roberto, 2008. Identifying the effects of firing restrictions through sizecontingent differences in regulation. Labor Econ. 15 (3), 482-511.
Schmitt, John, 2013. Why Does the Minimum Wage Have No Discernible Effect on Employment? Center for Economic and Policy Research, CEPR, Washington, DC.
Schwartz, Christine, 2010. Earnings inequality and the changing association between spouses’ earnings. Am. J. Sociol. 115 (5), 1524-1557.
Shorrocks, Anthony, 1982. Inequality decomposition by factor components. Econometrica 50 (1), 193-211.
Shorrocks, Anthony, 1983. The impact of income components on the distribution of family incomes. Q. J. Econ. 98 (2), 311-326.
Slonimczyk, Fabian, 2013. Earnings inequality and skill mismatch. J. Econ. Inequal. 11 (2), 163-194.
Slonimczyk, Fabian, Skott, Peter, 2012. Employment and distribution effects of the minimumwage.J. Econ. Behav. Organ. 84 (1), 245-264.
Spitz-Oener, Alexandra, 2006. Technical change, job tasks, and rising educational demands: looking outside the wage structure. J. Labor Econ. 24 (2), 235-270.
Stewart, Mark, 2012. Wage inequality, minimum wage effects, and spillovers. Oxf. Econ. Pap. 64, 616-634. Sutch, Richard, 2010. The Unexpected Long-Run Impact of the Minimum Wage: An Educational Cascade, NBER Working Paper 16355.
Thevenon, Olivier, 2013. Drivers of Female Labour Force Participation in the OECD, OECD Social, Employment and Migration Working Paper 145, Paris.
Thevenon, Oliver, Solaz, Anne, 2013. Labour Market Effects of Parental Leave Policies in OECD Countries, OECD Social, Employment and Migration Working Paper 141, Paris.
Van der Wiel, Karen, 2010. Better protected, better paid: evidence on how employment protection affects wages. Labor Econ. 17, 16-26.
Van Praag, B., Hagenaars, Aldi, van Weeren, Hans, 1982. Poverty in Europe. Rev. Income Wealth 28 (3), 345-359.
Van Weeren, Hans, Van Praag, Bernard M.S., 1983. The inequality of actual incomes and earning capacities between households in Europe. Eur. Econ. Rev. 24, 239-256.
Vecernik, Jiri, 2010. Earnings Disparities and Income Inequality in CEE Countries: An Analysis of Development and Relationships, Working Paper 540, Luxembourg Income Study.
Vecernik, Jiri, 2013. The changing role of education in the distribution of earnings and household income. The Czech Republic, 1988-2009. Econ. Transit. 21 (1), 111-133.
Visser, Jelle, 2009. The ICTWSS Database: Database on Institutional Characteristics of Trade Unions, Wage Setting, State Intervention and Social Pacts in 34 Countries Between 1960 and 2007. http://www.uva- aias.net/208.
Visser, Jelle, Checchi, Daniele, 2009. Inequality and the labour market: unions, In: Salverda, Wiemer, Nolan, Brian, Smeeding, Timothy (Eds.), The Oxford Handbook of Economic Inequality. Oxford University Press, Oxford, pp. 230-256 (Chapter 10).
Vlasblom, Jan Dirk, de Gijsel, Peter, Siegers, Jacques, 2001. Taxes, female labour supply and household income: differences between the Netherlands and the Federal Republic of Germany. Appl. Econ. 33, 735-744.
Vroman, Wayne, 2007. Replacement Rates and UC Benefit Generosity, Mimeo.
Wallerstein, Michael, 1999. Wage-setting institutions and pay inequality in advanced industrial societies. Am.J. Polit. Sci. 43 (3), 649-680.
Wood, Adrian, 1995. North-South Trade, Employment and Inequality: Changing Fortunes in a Skill-Driven World. Oxford University Press, Oxford.
World Bank, 2012. World Development Report 2013: Jobs, Washington.
Yun, Myeong-Su., 2006. Earnings inequality in USA, 1969-99: comparing inequality using earnings equations. Rev. Income Wealth 52 (1), 127-144.
More on the topic CONCLUSION AND FUTURE RESEARCH:
- The Future of Research
- Conclusion The Pyramid of Peace: Past, Present and Future
- FUTURE RESEARCH DIRECTIONS
- Section 6 Emerging Trends
- CONCLUSION
- LIMITATIONS AND FUTURE RESEARCH
- Conclusion
- Conclusion
- Conclusion
- Conclusion