ECONOMIC DEVELOPMENT
The standard measure of economic development, GDP per capita, is inspired by the utilitarian ethic. Ifwe identify utility with income, then average utilitarianism calls for maximizing average income.
Hence, this conception of economic development is a corollary to an ethical view. As utilitarianism was ubiquitous in economic thinking until Rawls (1971), and continues to be extremely influential in economics after Rawls, especially in growth theory and policy analysis, it is unsurprising that our central measure of economic development has a basis in utilitarian thought.There are various ways we might alter our measurement of economic development, based on other ethical views. Indeed, some alterations can be made within utilitarianism. By recognizing that some needs are more urgent than others, we could apply a concave transformation to income, say the logarithm, and measure economic development by Ó~) log xi, where xi is income, which is ordinally equivalent to maximizing Of
Of
course, this would place much more policy focus upon avoiding poverty, as a single very small income is socially catastrophic. Another approach, still within utilitarianism, is to
include other arguments besides income in the utility function—education, health, etc.—but to take the average of an index of these goods over the nation. This is the approach of the UNDP’s human development index. But if equalizing opportunities is an attractive ethic, then we should construct measures of economic development that are consonant with it. This section begins that discussion.
As a preliminary consideration, we must clear the deck of an opposing position which argues that economic development is a technical concept, not one related to social welfare.
This cannot be correct. Economics is not engineering: Its goal is to maximize social welfare, however that may be conceived. Even for those who abjure the possibility of interpersonal comparisons, Pareto efficiency is a conception of social welfare. An economy consisting of slaves who produce, for a very small elite, huge wealth, should not be considered highly developed, no matter how refined the technology. Economic development must mean the development of human beings (some would include other sentient beings), and how to conceive of it must be corollary to a theory of the good life and good society.IfEOp is to replace utilitarianism as the ethical view of choice, then we must replace GDP per capita with some measure of opportunity equality as a measure of economic development. We will propose, here, a two-dimensional index of economic development, based upon the EOp approach. The first component of the index is the value of (4.1), and the second is a measure of the extent to which inequality in the society is due to inequality of opportunity (as opposed to differential effort). 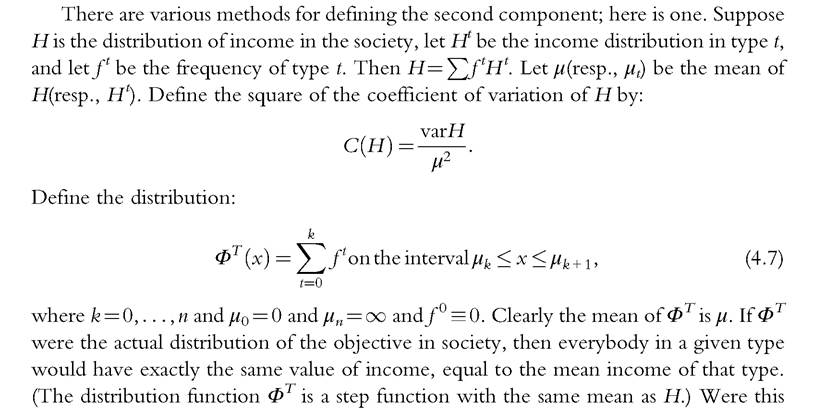
18
For instance, take income as the objective, and define a typology by parental education levels.
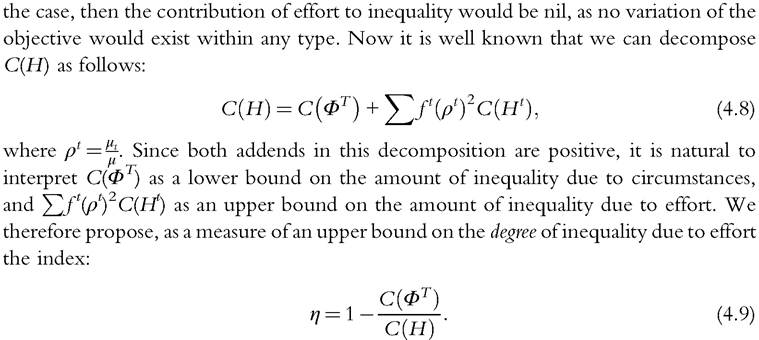
The reason that the measure η is only an upper bound on the fraction of inequality due to effort is that circumstances continue to influence the second term in the decomposition (4.8). See Shorrocks (1980) for a characterization of all inequality indices that can be decomposed in the sense of (4.8).
Our proposal is to measure economic development by the ordered pair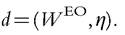
Weo replaces GDP per capita: It is the average income of those who belong to the most disadvantaged type.19 Thus, d presents both a level of welfare and a degree of inequality.20
The proposal to measure the degree ofEOp using the decomposition (4.8) is not original with us.
It is a special case of the inequality of opportunity ratio (IOR), defined in Ferreira and Gignoux (2011). Ferreira and Gignoux’s preferred measure of inequality is not the square of the coefficient of variation but the mean logarithmic deviation (MLD). The same idea for measuring the degree of inequality due to circumstances is proposed in Checchi and Peragine (2010) as well.In Figure 4.4, we present a graph plotting the points d for a set of European countries, where the data are taken from EU-SILC (2005) and the population of male workers is partitioned into three types, depending on the level of education of the more educated parent. (Type 1: parent completed only lower secondary; type 2: parent completed upper secondary; type 3: parent had some tertiary education.)
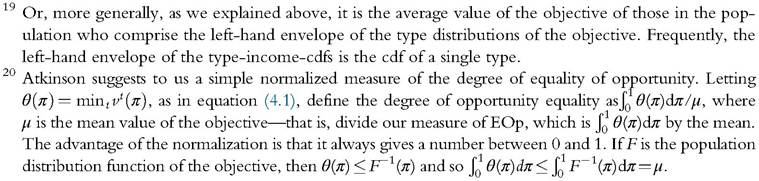
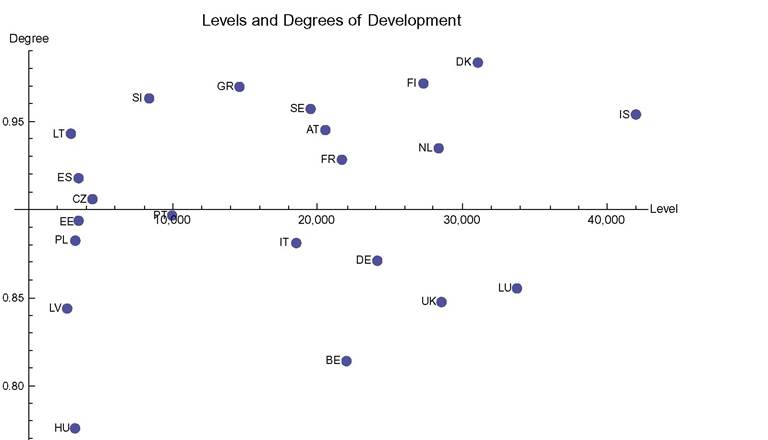
Figure 4.4 The points d=(Weo,η) for a set of European countries.
Several remarks are in order. (1) Generally, over 80% of the inequality in income is due to “effort,” but recall our typology is very coarse: There is only one circumstance, parental education, partitioned into three levels. A finer decomposition ofthe population into more types would lower the degree of inequality due to effort. (2) Iceland's (IS) strong position on the first component, it must be remembered, is from data before the bank crisis. (3) No country dominates all others on both components of d. But Denmark (DK) dominates all other countries except Luxemburg (LU) and Iceland. (4) Greece’s high component η is due to the fact that the great majority of individuals in the sample were of the least advantaged type (their parents had not completed high school). (5) The Eastern European countries (Lithuania, Lativa, Estonia, Poland, Czech Republic, and Hungary) perform relatively poorly. Finally, recall that we are looking at highly developed countries; were we to calculate the point d for developing countries, there would be a much larger spread.
(For further details on this calculation, see Roemer, 2013.)Ferreira and Gignoux (2011) calculate their version of the measure η for six Latin American countries as well. Their calculation differs from the one presented here using the EU-SILC data in two ways: They have a different set of circumstances, and they use a different measure of inequality. There is, as one might expect, a lower degree of opportunity equalization in the Latin American countries than in the European ones.
There is one study, of Sweden, in which the population of male workers was decomposed into 1152 types, based on the observation of seven circumstances (Bjorklund et al., 2012). These authors use a Shapley-value method to assign the degree ofincome inequality due to the various circumstances and to effort. For the coefficient-of-variation- squared measure, the fraction of long-run income inequality due to effort is calculated to be between 59% and 80%, considerably lower than the 96% shown in Figure 4.4. It is a testament to the degree of EOp in Sweden that, with such a fine decomposition of the working population into types, (only) between 20% and 40% of income inequality is due to circumstances.
One disadvantage of reporting the level of economic development as a twodimensional statistic is complexity; in particular, this generates only a partial ordering of countries with respect to the degree of development. One could create a single index by aggregating as follows: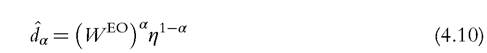
for some α 2 (0,1). The advantage of the Cobb-Douglas aggregation is that the ordering it imposes on countries is independent of the units in which W and η are measured, so it does not matter that W is a large number and η is a small one. For the European countries in Figure 4.4, most values of α in (0,1) render a country-ordering that is very highly correlated with the ordering of the first component.
We conjecture that this would not occur with a larger set of countries, in which the variation of η would be more substantial.The World Bank has been an important innovator in bringing considerations of equal opportunity into economic development. Its two important publications to date have been the 2006 World Development Report, Equity and Development, and a monograph, Measuring Inequality of Opportunities in Latin America and the Caribbean (Paes de Barros et al., 2009). The more recent publication contains a wealth of information on the effects of social circumstances on various measures of achievement and output.
Paes de Barros et al. (2009) propose a measure of EOp. Consider a particular kind of opportunity, such as attaining the sixth grade in elementary school. Let the total sixth-grade attendance in a countrybe H, and the total number of children of sixth-grade age be N, and define to be the access on average of children to
the opportunity of a sixth-grade education. p measures the level of this opportunity in the country, but not the extent to which access is unequal for different children, based on their social circumstances. Now using a logit model, they estimate the probability that each child, j, in the country has of attending the sixth grade, where that probability is a function of a vector of circumstances; denote this estimated prob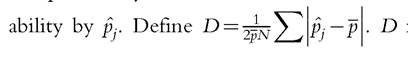 measures the variation in access to the
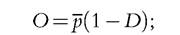
opportunity in question across children in the country. The normalization guarantees that 0 ≤ D ≤ 1. Now define the human opportunity index as
note that _
_
The human opportunity index is a nonconsequentialist measure of development, because the probabilities pj can only be computed knowing the circumstances of the children.
The measure combines a concern with the level of provision of opportunities and the inequality of the distribution of them. This is to be contrasted with the ordered pair (1Weo, η}, which separates these two concerns into two measures. Obviously, some information is lost in using a single measure rather than two measures.The concern of the 2009 report is in large part with children. In our view, where children are concerned, all inequality should be counted as due to circumstances, and none to effort, and so the fact that the human opportunity index does not explicitly make the distinction between effort and circumstances is unobjectionable.[143] However, if the measure is used for addressing inequality of opportunity for adults, this may be a defect.
To study this, let us take an opportunity for adults—the capacity to earn an income above M. Suppose there are three types of worker, according to the level of education of their more educated parent. Denote the distribution of income in type t as Ft; let the fraction of type t be f and let F be the distribution of income in the society as a whole.
the circumstances. Hence, the human opportunity measure is:
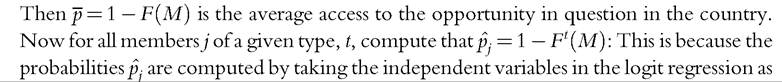
Despite the fact that effort is not explicitly mentioned in defining the index, effort is reflected in the measure, because the distributions Ft appear in the calculation. Indeed, the first term 1 — F(M) measures the level of opportunity in the country, while the second term is a penalty for the degree to which this opportunity is mal-distributed with respect to circumstances (e.g., if there was no inequality of opportunity, then for
for
all t, and the penalty is zero).
Inexpression (4.11), the first term on the right-hand side, 1 — F(M), plays the role that ITeo plays in the ordered-pair measure we introduced above: It measures the level of
development. But while Weo focuses upon how well off the most disadvantaged type is doing, 1 — F(M) is a level for the society at large. The second component of our measure, η, is explicitly derived to show the degree to which inequality is due to circumstances, whereas the second term on the right-hand side of (4.11) is a form of a variance. Certainly, these two measures are getting at the same phenomenon. We have a slight preference for our proposal, as it is more carefully justified as measuring what we are concerned with. But these are minor differences; certainly, the measure O is in the spirit of thinking of economic development as opportunity equalization.
We finally consider a confusion (from our viewpoint) that infects discussions of “equity versus development,” similar to the one we mentioned when we presented the health-expenditure example. It is often said that equity and efficiency are competing goals, and that equity is purchased at the expense of efficiency. There are two senses in which this phrase is uttered. The first is that redistributive taxation may be purchased only at the cost of Pareto inefficiency, due to workers and firms facing different effective wages. This is true. The second sense is that redistribution may lower total output. These two claims are in principle independent. There may be policies that reallocate income in a more equitable manner and lower total output, but are not Pareto inefficient. (Think, for example, of reallocating educational funds from tertiary education to secondary education in a poor country. This might have a purely redistributive effect, without significant consequences for Pareto efficiency.)
We wish to criticize the second usage of the phrase. Saying that there may be a tradeoff between equity and efficiency where efficiency is measured as total output is equivalent to saying there is a trade-off between equity and the utilitarian measure of development, which (in its simplest form) is given by output per person. Consider the following quotations from the otherwise fine World Development Report 2006, issued by the World Bank, entitled Equity and Development. In these quotations, equity and development are counter-posed:
Greater equity is thus doubly good for poverty reduction: through potential beneficial effects on aggregate long-run development and through greater opportunities for poorer groups within any society (p. 2)
Ifthe opportunities faced by children like N. are so much more limited than those faced by children like P. or S., and if this hurts development progress in the aggregate, then public action has a legitimate role in seeking to broaden opportunities. (p. 3)
Third, the dichotomy between policies for growth and policies specifically aimed at equity is false. (p. 10)
In the first quotation, saying that equity is “doubly good,” in that it is good for the poor and also good for long-run development, only makes sense if one assumes that equity and long-run development are different goals. In our view, long-run development means approaching equity—that is, EOp. We believe that the authors of this sentence had in
mind GDP per capita as the measure of long-run development, and so what is being said is that equalizing opportunities will increase GDP per capita. This is peculiar in a report that is devoted to advocating the view that economic development requires the achievement of equal opportunity.[144] In the second quotation, the assumption is that redressing the inequality of opportunity among the children is justifiable because that inequality hurts development; but in our view, it is that inequality which comprises underdevelopment, and so the sentence is tautological. Here, the authors have in mind a utilitarian concept as the measure of economic development. Finally, the third quotation would likewise be a tautology for us; but in the context, the authors are saying that policies that increase EOp also lead to an increase in total income. (That is, the third quotation is offered as an empirical claim, while for us, it is a tautology.) Again, there is an ambivalence in the conceptualization of economic development: Does it mean equalizing opportunities or increasing per capita output?
It will often be the case that policies that redress inequality of opportunity will also increase total output, because improving opportunities for the disadvantaged releases talents that were, before, unused. But this need not be the case, and we maintain that our justification for redressing inequality of opportunity should not depend on its being the case. There may be groups in society that are so disadvantaged that it is very costly to compensate them: The return in output per funds invested may be small. Equity may be advanced only by shifting investment from uses where it generates high output to ones where it generates lower output. (This may be so, particularly in the short run.) But if this is the case, it does not mean that the policy in question should not be undertaken, nor does it mean that development is thereby reduced if it is.
The ambivalence in Equity and Development is a reflection of the competing conceptions ofjustice represented by utilitarianism and opportunity equalization. Utilitarianism, as we said, has a strong hold on economists. This is a holdover from an earlier period when utilitarianism was the only game in town—let us say, until John Rawls’s work (Rawls, 1958, 1971). Economists and mathematicians developed optimization techniques (e.g., the Bellman equation), which are suited to solving problems where utilities are added up across persons, but not to solving problems where the minimum is maximized. And so it is often comfortable to work with utilitarian formulations. We submit, however, that this is a bad habit we should not continue to practice.
If our view of economic development is adopted, there may be a significant change in policy evaluation. One would not have to justify investment in very disadvantaged social groups by showing that such investment increases total output. As we indicated, in the long run, such a conflict might not exist, but often, policy makers are under political pressure to evaluate the consequences of their policy choices in the short run. If a country is evaluated on the basis of its ordered-pair statistic d = (Weo, η) rather than on GDP per capita, policies could be quite different.
22
4.7.
More on the topic ECONOMIC DEVELOPMENT:
- Background Context
- Conclusion
- Oman
- Introduction
- AN OVERVIEW OF CULTURAL ECONOMICS AND RELATED TOPICS
- Contents
- CONTENT AGGREGATION AND MARKET STRUCTURE
- BACKGROUND AND DEFINITIONS
- Allianz Research. Country Risk Atlas 2024: Assessing non-payment risk in major economies. Allianz,2024. — 179 p., 2024
- North Korea: the last Stalinist state