Investment
Although only around one-third as important as consumption in total aggregate demand, investment is arguably one of its most significant components. It is highly volatile, and through its impact on productivity affects both supply and demand sides of the economy.
After briefly reviewing the definition and measurement of investment, this chapter considers the theory and evidence for a number of factors allegedly affecting fixed investment. The rate of interest, the Accelerator Theory, the Capital Stock Adjustment Model, profitability, ‘crowding out', uncertainty, public policies, capital market imperfections and a poor skill set are all considered. The chapter concludes by assessing the role of investment in economic growth.I The nature of investment
Resources in an economy can be used to produce goods and services for immediate use (consumption), or to add to the stock of fixed capital (investment). This chapter concentrates on the latter.
In one sense, consumption and investment are quite distinct. The act of investment usually involves abstaining from current consumption in order to acquire assets, which raise the productive potential of the economy, and therefore the possibilities for future consumption. Yet in another sense they are similar, both being components of aggregate demand, i.e. types of spending which create income for others in the economic system. We noted in Chapter 16 that consumption was around 48% of gross final expenditure (GFE) in 2009. Although smaller, fixed capital investment was 13% of GFE in 2009.
Stock and flow concepts
The total value of fixed capital at any time is a ‘stock’ concept. The rate of change of that ‘stock’ is a ‘flow’ concept. Investment in the National Accounts is entirely a ‘flow’ concept, as it is the addition to the stock of fixed capital in any given year. This helps explain why purchases of shares, paintings or antiques, although often termed ‘investments’ in everyday speech, are not regarded as such in the Accounts.
Usually they merely represent a transfer of ownership from one person or institution to another, rather than an addition to the stock of assets. The difference between stock and flow valuations is often substantial.Gross and net investment
‘Gross’ investment, though a flow concept, overestimates the change in size of the stock of capital or inventories in the year. In the course of the year some fixed capital will have worn out or become obsolete, and some inventories will have become unusable. A part of ‘gross’ investment will therefore be needed simply to replace these assets used up in the course of production. If we subtract this ‘replacement’ investment from ‘gross’ investment, then we are left with ‘net investment’. Net investment is then the estimate of the addition, in any year, to the stock of fixed capital and inventories, having allowed for depreciation of that stock during the year.
Of course, quantifying depreciation presents a number of problems. Estimating the loss in value of a machine in a year is difficult in itself, and may be guided less by the physical state of the asset than by the possibility of tax concessions. Also different accounting conventions will yield different measures of depreciation. For instance, historical cost accounting yields much lower figures for depreciation than does inflation accounting.
The majority of investment expenditure is on fixed capital formation rather than inventories and it is to this that we now turn.
Gross Domestic Fixed Capital Formation (GDFCF)
Gross Domestic Fixed Capital Formation (GDFCF) is defined in the National Accounts as ‘expenditure on fixed assets (buildings, plant and machinery, vehicles, etc.), either for replacing or adding to the stock of existing fixed assets’. This apparently clearcut definition turns out to be rather arbitrary in application. For instance, ‘investment’ in the National Accounts is restricted to the firm sector. If a household purchases a computer for personal use, it is classified in the National Accounts as ‘consumption’, yet the same purchase by a firm is classified as ‘investment’, even though in both cases the capital asset yields a stream of useful services throughout its life.
This is because the National Accounts treat the household purchase as self-gratification, but the firm purchase as producing a flow of marketable goods and services.The arbitrariness of this classification is well illustrated when an individual chooses, for tax purposes, to be regarded as self-employed. The purchase of a car by a teacher for travel to work as an employee is classed as ‘consumption’ expenditure. Should the teacher change his or her designation to self-employed and engage in privately contracted teaching, then the purchase of that same car could be classed as ‘investment’ expenditure.
Despite problems of classification, it is important to gauge changes in GDFCF through time, both in total and by sector and type of asset. Table 17.1
Table 17.1 Gross Domestic Fixed Capital Formation (£m) by sector and by type of asset.
| Sector | |||||
| Total | Business investment | General government | Other | ||
| 1989 | 130,383 | 72,025 | 10,175 | 48,183 | |
| 1993 | 115,311 | 60,912 | 14,764 | 39,635 | |
| 2002 | 178,066 | 111,678 | 15,740 | 50,648 | |
| 2005 | 195,118 | 115,116 | 23,713 | 56,289 | |
| 2009 | 204,270 | 121,368 | 37,821 | 45,081 | |
| Asset | |||||
| Transport & | Other machinery | Other new | Intangible | ||
| equipment | and equipment | Dwellings | buildings | fixed assets | |
| 1989 | 14,828 | 31,987 | 40,566 | 47,080 | 4,404 |
| 1993 | 11,177 | 26,000 | 32,166 | 49,834 | 4,442 |
| 2002 | 16,728 | 56,614 | 36,800 | 62,088 | 5,676 |
| 2005 | 15,031 | 59,162 | 42,853 | 71,516 | 6,556 |
| 2009 | 12,127 | 56,411 | 37,044 | 80,978 | 17,710 |
| Sources: | ONS (2010) Monthly Digest of Statistics, No. 778, October; ONS Economic Trends (various). | ||||
presents data for selected time periods since 1989 (the peak level of investment in the previous economic cycle). Given the problems we noted in measuring depreciation, the ‘gross’ concept is perhaps the most useful for purposes of comparison, whether through time or across countries. GDFCF stood at £204bn in 2009 (in real terms), which is around 55% above the level touched at the peak of the cycle in the late 1980s. Following an 11% decline in the recession of the early 1990s, investment spending has continued on an upward path, although slowing somewhat with the onset of recession after 2008.
During the latter part of the 1990s, there was a significant shift in investment spending from the public to the private sector. However, over the past few years this pattern has been reversed, partly as a result of a slowdown in private sector capital expenditure following the boom towards the end of the last decade, but also because of the government’s decision to rebuild the infrastructure across much of the public sector. The public sector currently accounts for around 12% of new investment compared with 9% in recent years, but one of the intentions of the 2010 Comprehensive Spending Review is to curb public expenditure which will inevitably include public sector investment.
One reason why the public sector now contributes relatively little in the way of new investment is the privatization programme which has reduced the number of public corporations. However, it also reflects the desire of the previous government to keep spending under control. Because of difficulties involved in cutting back on current expenditure plans, capital projects have been sacrificed in a bid to fulfil this objective.
Investment by type of asset has changed since 1989. Investment in machinery and equipment has grown most rapidly, increasing by around 84%. It now accounts for around 30% of total GDFCF.
There has also been a healthy rise in the level of investment in ‘other new buildings’ which, in 2009, represented more than one-third of the total. By way of contrast, capital expenditure on transport and dwellings has grown rather more modestly. The level of investment in dwellings has declined in real terms and now accounts for just 18% of GDFCF. Within the housing investment component (dwellings) there has also been a transfer of resources from the public to the private sector. Investment in public sector housing fell from 15% of total dwelling investment in 1989 to less than 9% in 2009.Factors affecting fixed investment
Investment spending typically has a significant influence on fluctuations in economic activity. Indeed, as a recent Vice-Chairman of the US Federal Reserve, Roger Ferguson, noted, a fall in investment has accounted for the bulk of the drop in GDP in each of the last six American recessions. It is, therefore, clearly important to identify the factors causing such changes in fixed investments.
Gross Domestic Fixed Capital Formation is so heterogeneous that any explanation must address itself to particular components. For instance, investment in dwellings is influenced by population trends, expected life-time income and the availability and cost of mortgage finance, whilst public sector investment is influenced by the priorities of a particular government. Here we focus on the largest component of GDFCF, namely business investment.
The rate of interest
The earliest theories of investment placed considerable emphasis on the importance of the rate of interest, seen here as the compensation required for foregoing current consumption. Fisher used the rate of interest to derive the present value (PV) of an expected future stream of income. By calculating the PV of various alternative investment projects they could then be ranked against each other.
This approach was taken a stage further by Keynes who introduced the concept of the marginal efficiency of investment (MEI).
The MEI was defined as that rate of discount which would equate the PV of a given stream of future income from a project, with the initial capital outlay (the supply price):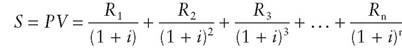
where S = the supply price;
PV = the present value;
R = the expected yearly return; and
i = that rate of discount necessary to equate the present value of future income with the initial cost of the project.
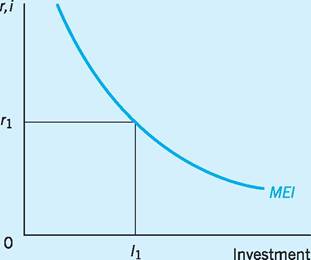
Fig. 17.1 The investment demand schedule.
The curve relating the marginal efficiency of investment (i) to the level of investment in Fig. 17.1 is negatively sloped, for two main reasons. First, the earliest investment projects undertaken are likely to be the most profitable, i.e. offering the highest expected yearly returns (R), and therefore having the highest marginal efficiencies of investment (i). As more projects are initiated, they are likely to be less and less profitable, with lower expected yearly returns, and therefore lower MEIs. Second, a rise in the level of investment undertaken is, at least in the short run, likely to raise the supply price (S), which in turn will reduce the MEI. This could follow if the industries producing capital goods faced capacity constraints in their attempt to raise output in the short run.
The decision on whether to proceed with an investment project will depend on the relationship between the rate of interest (r) and the marginal efficiency of investment (i). If r is less than i, then the annual cost of borrowing funds for an additional project will be less than the expected annual return on the initial capital outlay, so that the project will be profitable to undertake. In Fig. 17.1, with interest rate r1, it will be profitable to invest in all projects up to I1, with I1 itself breaking even. The MEI schedule is therefore the investment demand schedule, telling us the level of investment that will be undertaken at any given rate of interest. Expectations play an important role in this theory of investment. If, as is often the case, expectations are volatile, then the expected yearly returns (R) on any project will change, causing substantial shifts in the MEI schedule. At any given rate of interest, investment demand will therefore be changing, which will reduce the closeness of any statistical fit between the interest rate and investment. In fact, it may be via expectations that interest rates exert their major influence on investment. A fall in rates is often a signal to investors of better times ahead, raising expected returns, shifting the MEI curve to the right, and raising investment (and conversely). Although this may dilute the statistical fit between r and I, there may still be an underlying linkage between the two variables.
Evidence
One problem in testing the influence of interest rates on investment is the selection of an appropriate interest rate. The average yield on debentures is a rate frequently used, as this broadly indicates the cost of new borrowing for a company at any point in time.
Historically, most UK studies have failed to show any close connection between interest rates and investment, suggesting that the latter is interest-inelastic. One analysis of the relationship between the real rate of interest and gross fixed investment in plant and machinery in manufacturing was conducted by Turner (1989). He found only a weak correlation between the two variables, as did Whitaker (1998) in his study of investment in the UK in the recovery period 199296. However, a study by Osler (1994), covering not only the UK but also Germany, France, Japan and Canada, found that the high level of real interest rates between 1990 and 1993 had substantially depressed private investment and consequently reduced output in the five countries by between 2- and 4-% per year over the period.
Instead of focusing solely on the rate of interest, some research has looked for alternative measures of the cost of capital to firms. Cummins et al. (1996), for example, examined the role of the stock market in influencing investment trends. A rise in equity prices tends to make it cheaper to raise capital on the stock market while a fall can make it more expensive. They found that sudden share-price changes had a substantial impact on firms’ investment plans in 12 of the 14 OECD countries examined, i.e. a rise in share prices leads to higher investment, and vice versa. A more recent study by Tevlin and Whelan (2000), based on US data, suggested that over the previous decade the cost of capital had become significantly more important in determining the level of investment. They pointed out that much of the recent investment has been in the IT area and suggested that this is far more sensitive to the cost of capital than is investment in non-computing equipment. The Bank of England, in its model of investment spending, uses a variable described as the ‘real cost of capital’. This is weighted to capture the proportion of corporate borrowing that is equity-based and the proportion that is bondbased. The numbers are then combined with equity and bond yields (long-term interest rates) before inflation expectations are deducted. The impact of this variable on business investment is assumed to be relatively modest, with a 1% change in the former shifting the latter by only 0.07% after four quarters and by 0.16% after eight quarters. Put another way, a 10% increase in the real cost of capital (say from 5% to 5.5%) would lower business investment by only 0.7% after one year.
Accelerator Theory and Capital Stock Adjustment Model
The Accelerator Theory relates net investment to the rate of change of output. If the capital stock K is fully utilized, and the capital/output ratio v is a constant, then net investment (I) can be expressed in the following way:
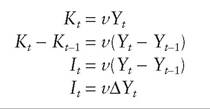
where Y is output and t and t — 1 are time periods.
Net investment in year t is then a constant proportion of the change in output during that year. For example, if output rose by £2m for the economy (∆Yt = £2m), and each extra £1 of output needed an average of £5 of capital equipment to produce it (v = 5), then It = 5 ? 2m = £10m. A number of criticisms have been levelled at the Accelerator Theory. First, the assumption that there is no excess capacity is particularly suspect. If there is spare capacity then a rise in output ∆Yt can be met from the existing capital stock, with no need for new investment. It has been estimated by the CBI that in the period 1979-2002, an average of just over 40% of firms were working at full capacity. Such a large amount of excess capacity must severely impair the effective functioning of the accelerator. Second, the assumption of a constant capital/output ratio, v, is becoming less and less plausible. The advent of new generations of microelectronic technology is progressively reducing capital/output ratios. Third, it is also likely that prior to making an investment the firm would want to be sure that any upsurge in demand and in output is not a temporary phenomenon. Expectations of future demand, and therefore future changes in output, will then be important.
A more sophisticated version of this is the Capital Stock Adjustment Model. This was developed to overcome some of the problems of the simple Accelerator Theory. It states that investment is positively related to the expected level of output and negatively related to the existing capital stock. Any rise in investment will consequently depend not only on the expected level of output (demand) but also on the current size of the capital stock. Specifically,
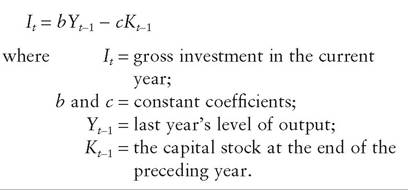
If it is assumed that the expected volume of output is roughly equal to that experienced in the previous year, 1, then the higher is Y^ 1 the greater will gross investment tend to be. However, the greater the inherited capital stock, Kt_ 1, the less need there will be for adding to the capital stock, or even replacing worn-out equipment.
Evidence
Even when varying lag structures are introduced into more refined versions of the Accelerator Theory, the evidence in its support is far from convincing. McCormick et al. (1983) found that changes in real GDFCF by firms between 1962 and 1980 were not strongly related to the previous year’s change in real consumer spending or demand. Kennedy (1997) noted that the Capital Stock Adjustment Principle was useful in explaining manufacturing investment in the UK between 1955 and 1970, though less so since then. Similar support for a modified accelerator theory as a determinant of investment has come from the studies of Catinat et al. (1987) and Ford and Poret (1990). A study by Oliner et al. (1995) in the US also found this approach helpful in explaining investment, albeit with the inclusion of other variables. However, Tevlin and Whelan (2000) suggested that the Capital Stock Adjustment Model actually broke down in the 1990s, with the actual level of investment in the US seven percentage points higher in 1997 than could be explained by the model. The Bank of England model, noted earlier, places rather greater emphasis on changes in GDFCF in terms of its near-term influence on investment, suggesting that a 1% rise in demand boosts capital spending by more than 1.28% after four quarters and by 1.68% after two years.
Profitability
There are at least three reasons why changes in profitability might be associated with changes in private sector investment.
1 Higher profits indicate a more favourable return on capital, which may encourage companies to reinvest any surplus rather than devote it to alternative uses.
2 Higher profits may improve business confidence and raise the expected future return on any project. An outward shift of the MEI schedule (see Fig. 17.1 above) might then raise investment at any given rate of interest.
3 Higher profits may raise investment by reducing its cost, as funds generated internally are cheaper than those obtained from the capital market, whether equity or debenture.
Evidence
In a major study of investment in the EU over the period 1961-90, the relation between net investment and the rate of profitability per unit of capital stock was found to be highly significant. Indeed variations in profitability were found to account for some three- quarters of the variations in capital stock during this period (COM 1991). In this study the profitability variable was lagged one period in order to take into account the unavoidable delays between changes in profit conditions and the effective realization of resulting investment decisions. More recent work by Carruth et al. (2000) and Driver et al. (2001) has suggested that investment in the UK is significantly related to corporate profitability.
Given the more open product markets implied by a global economy, it is not only profitability in the domestic economy which now influences investment decisions but that in the global economy. A recent study has found that an increase in costs in the UK relative to those in other countries leads to a more than proportionate reduction in the UK investment, and of course vice versa (Young 1994). In other words, relative changes in UK factor prices and tax policies, and thereby in profitability, have a significant effect on UK investment. For example, Young found that a 1% rise in UK relative factor prices would lead to a 1.62% decline in UK investment, with an eight-quarter time lag.
Uncertainty
During periods of uncertainty (for example, after a shock rise in oil prices) it has been argued that firms will reduce the value they place on expected future returns on investment projects. In terms of the earlier Fig. 17.1, the MEI will shift leftwards and less investment will take place at any given rate of interest. Faced with such uncertainty, therefore, businessmen and women become more inclined to delay any planned capital spending.
Evidence
Until recently, there have been few attempts to model the relationship between investment and uncertainty. There is no general agreement as to how to account for uncertainty as a variable, although the majority of studies have used a variance measure to capture volatility in output, inflation or the exchange rate. Other options include the gold price, equity price volatility and information from the CBI survey. Work by Temple et al. (2001) and Bloom et al. (2001) amongst others confirms the relevance of uncertainty as an issue impacting upon capital spending decision-making.
Public policies
Public policies may influence investment in the private sector as well as the public sector. For example, changes in the rate of taxation of company profits, or in the capital allowances which can be set against tax, are believed by many to significantly affect levels of investment. The government introduced a tax credit for expenditure on research and development (R&D) in 2002 to stimulate spending in an area seen as being of particular importance.
Evidence
Studies on the impacts of the reform of corporation tax and the phasing out of accelerated depreciation allowances on UK investment were undertaken by Sumner (1988) and Devereux (1989). The results suggested that such policies had relatively little impact on investment demand over the longer term. However, a study by Bond et al. (1993) reopened the debate. It suggested that recent corporation tax changes and the loss of capital allowances had created a strong fiscal bias against investment, equivalent to companies facing permanently higher interest rates of 1-2%. This conclusion is not dissimilar to the results produced by Cummins et al. (1994). They found that investment behaviour responded in a significant fashion to any changes in the tax regime which affected the cost of capital.
There is much current debate as to whether the pressure on companies to make higher pension contributions to fund shortfalls in defined benefit pension schemes is having an adverse impact on investment. However, Bunn and Trivedi (2005) and Barrel and Riley (2006) argue that pension funds have shifted their portfolios from the now less attractive (lower profits) shares to fixed-interest securities in response to this situation, so that (long-term) interest rates are likely to be lower than would otherwise be the case. Lower interest rates may then encourage companies to borrow more to finance capital spending.
Capital market imperfections
It has been suggested that inefficiencies in the banking system and in the capital markets have prevented industry from obtaining the finance it requires for investment. Amongst the criticisms of UK financial institutions are the allegations that UK banks place too great an emphasis on lending to consumers, whereas overseas banks are primarily concerned with long-term industrial finance. Another criticism is that UK banks tend to concentrate on short-term lending, causing a shortage of long-term funds for investment. A further criticism is that financial institutions, which are major shareholders in many companies, place undue pressure on directors to distribute too high a proportion of total profit as dividend, the consequence then being that little profit is available to be ‘ploughed back’ as investment.
Evidence
Work carried out by Corbett and Jenkinson (1996) suggests that much of the criticism of the banking sector may be misplaced. Their study, which covers the period 1970-94, suggests that banks provided a roughly similar share of funds for fixed investment in the UK as they did in Germany and the US. On average, bank finance in the UK accounted for 14.6% of investment spending. The corresponding figure for the US is 11.1% and that for Germany 10.8%. The economy where banks have played a more significant role is that of Japan. Over the period as a whole, Japanese banks provided 27% of the funds required for Japanese fixed investment.
Even though this research suggests that the UK is not markedly out of line with its main competitors, there remains considerable unease that ‘short- termism’ by the city discourages investment in another way, by inducing companies to pay too high a dividend in relation to profit. A related criticism is that dividend payments are too inflexible, not varying as profits rise and fall, with the result that funds available for investment are squeezed in times of recession. A Trade and Industry Committee Report (House of Commons 1994) substantiated some of these concerns, showing a rising trend of dividend payments as a percentage of net earnings in UK companies, reaching levels in the UK above most other advanced industrialized countries, with the exception of the US. The Report noted that: ‘The Financial Secretary to the Treasury accepts that relatively high dividend pay-out ratios are a weakness in the UK economy’ (p. 70). On the subject of corporate distributions, Whitaker (1998) concluded that relatively high dividend payouts during the UK economic recovery of 1992-96 may have diverted funds away from investment in fixed capital. Such concerns have resulted in changes to the tax treatment of dividends, making it relatively more attractive for firms to use profits for investment purposes rather than for dividend payments. Chapter 21 provides further background to this alleged cause of low levels of UK investment.
Skills and the labour market
A paper by the Department of Trade and Industry (2000) has argued that ‘deficiencies in management and workforce skills’ have contributed to the lack of investment in the UK. A major survey into UK competitiveness by Porter and Ketels (2003) reinforced this view, with American, French and German managers (especially the American managers) able to get more output from an equivalent amount of machinery and labour (i.e. they had demonstrably higher total factor productivities).
Evidence
There is only limited evidence of a relationship between investment and skill shortages. One study in this area was conducted by Nickell and Nicolitsas (2000). As a proxy for skill shortages they used the CBI industrial trends survey which contains a question as to the factors that are limiting output. The result of the study for UK manufacturing found that a 10 percentage point increase in the number of firms reporting skilled labour shortages reduced fixed capital investment by 10% and reduced R & D expenditure by 4%.
The rate of depreciation
Earlier in this chapter (p. 339) we noted that the difference between gross and net investment reflected the rate at which the existing capital stock is depreciated, which helped justify the focus on gross rather than net investment. However, Tevlin and Whelan (2000) concluded that a key reason for the recent pick-up in investment spending had been an increase in the rate at which businesses replace depreciated capital. While econometric models traditionally tend to assume a constant depreciation rate, Tevlin and Whelan argued that a structural shift of capital towards computers over the previous decade justified a faster rate of depreciation.
It is significant that the Office for National Statistics (ONS) in the UK has recently arrived at the same conclusion on the grounds that the lifespan of IT equipment tends to be shorter than for other types of capital. It follows that, although the (gross) investment to GDP ratio has climbed steeply in recent years, the ONS believes that the capital stock to GDP ratio has actually been falling.
The importance of investment
Investment has a dual role to play within any economy. In the short run, investment may be seen mainly as a component of aggregate demand which, if increased, will have the effect of stimulating the economy and, through the multiplier, substantially raising the level of National Income. Fixed investment made up some 13% of total final expenditure in 2009.
In the long run, investment will also affect the supply side of the economy, raising its productive potential and thereby pushing outwards the production frontier. Economic growth is sometimes strictly defined in this way, being that increase in GDP which results from raising productive potential. More usually it is loosely defined as any increase in GDP, even when that is within the existing production frontier.
There have been a number of studies into the importance of investment as a generator of growth, though the results have not been conclusive. For example, in 1961 Kuznets, using time-series data for a number of countries, found little relationship between the share of investment in GDP, and the growth in output over time.
Table 17.2 shows both the average annual growth in non-residential investment and in the share of
Table 17.2 Average annual rates of growth of output and the growth and share of investment, 1985-2008.
| GDP growth (%) | Non-residential investment growth (%) | Share of investment in GDP (%) | |
| US | 3.0 | 4.4 | 18.4 |
| Canada | 2.7 | 4.6 | 20.3 |
| UK | 2.6 | 4.5 | 17.5 |
| 2.2 | 3.5 | 19.6 | |
| Japan | 2.1 | 2.8 | 26.7 |
| Germany | 2.1 | 2.8 | 20.6 |
| Italy | 1.7 | 2.5 | 20.5 |
Sources: Adapted from OECD (2010a) Economic Outlook, No. 87, Annex tables; OECD (2010b) Factbook 2010.
investment in GDP over the period 1985-2008 for the seven major world economies. It suggests that there is some relationship between the growth rate of the economy and the growth rate of investment spending, with the four fastest growing countries experiencing the most rapid increases in non-residential investment spending. The US, for example, has enjoyed the most rapid growth in its economy and has also been top of the growth in non-residential investment league, whilst the three major Eurozone countries lag behind on both counts. Interestingly, when the commitment to capital spending is measured from the perspective of the investment share in GDP, the results are much more patchy. The UK spends a relatively low share of total national output on investment but, over the period in question, has achieved a respectable growth performance. By way of contrast, Japan spends a relatively high share of total national output on investment but has generated a disappointing level of growth.
Does the UK suffer from a lack of investment?
Some of the previous discussion suggests that the UK may be suffering from a relatively low level of investment. Certainly Porter and Ketels (Koeva 2003) suggested that one key factor in the observed productivity gap between the UK and its main competitors was under-investment in the UK. Their survey showed that French workers have 60% more capital than in the UK, and those in Germany and the US between 25% and 30% more capital per worker. Recent work at the IMF (Koeva 2003) casts some doubt on this judgement, particularly as it relates to the more productive forms of capital spending. In its analysis the IMF points out that the performance of the UK in equipment investment is broadly comparable to that of other OECD countries. The UK does, however, have significantly lower non-residential construction investment which may reflect historical factors or different public policies (since government spending tends to be more important in this area of investment).
Other studies such as that by Bloom et al. (2001) remain rather sceptical as to the UK’s comparative investment performance. They acknowledge that business investment as a percentage of GDP has risen in the UK since the mid-1990s but contend that it is still not relatively high when compared with the likes
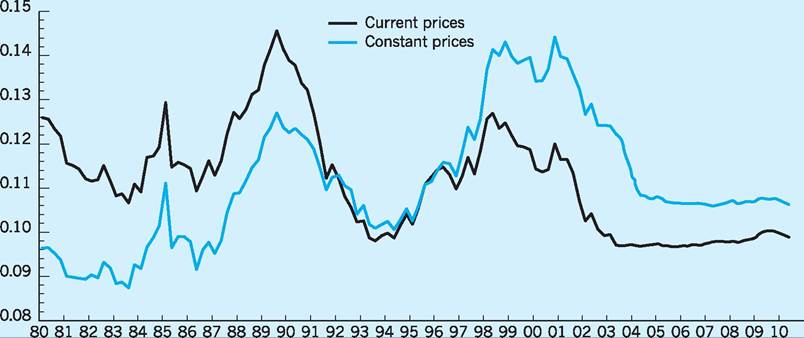
Fig. 17.2 Investment as a share of GDP. Source: Datastream.
of the US and Germany. One point they make is that the use of ‘consistent price investment’ data distorts the picture (see Fig. 17.2). The authors of the report argue that over the period in question, the price of capital goods has fallen sharply while the overall price level has risen. In effect, there has been a significant decline in the real price of capital goods. Thus Bloom et al. point out that ‘if firms had indeed bought the same capital goods they bought last year at the higher real prices prevailing last year, they would have had to spend substantially more money’.
Can there be too much investment? While many would answer no, others would disagree, pointing to the example of Japan in the late 1980s when companies spent huge amounts without any regard to the profitability of such decisions. Perhaps inevitably, much of the capital expenditure proved wasteful and hugely damaging initially to corporate finances and ultimately to the financial system as a whole. Although it was only one element of the story, this excessive investment arguably contributed to the decade-long recession that the Japanese economy has only recently begun to emerge from.
Efficiency and investment
The level of investment is not the only factor contributing to growth. A number of economists see investment as a necessary, but by no means sufficient, condition for economic growth. Growth also depends on the efficiency with which any investment is utilized. One method of measuring the efficiency of investment is through the gross incremental capital/ output ratio, i.e. the extra capital required to produce an additional unit of output.
Table 17.3 presents incremental capital/output ratios for five major economies. It demonstrates what appears to have been a major weakness of the UK economy in the past, namely that the UK has required a higher rate of gross investment to produce a given increase in output than have Germany, France, the US or Japan. However, the data suggest a considerable improvement in the efficiency with which investment in the UK has been utilized during the 1990s. Some have suggested that the more flexible labour market in the UK following earlier reforms (see
Table 17.3 I ncremental capital/output ratios.
| 1970-79 | 1980-89 | 1990-2005 | |
| France | 0.7 | 1.1 | 0.8 |
| Germany | 0.9 | 1.5 | 0.7 |
| Japan | 0.8 | 1.3 | 0.2 |
| UK | 1.6 | 1.8 | 0.7 |
| US | 1.3 | 0.9 | 1.7 |
Source: Adapted from OECD (2005) Economic Outlook, December.
Chapter 14) has allowed capital to be used more productively in recent times.
Table 17.3 suggests that increased capital intensity within the UK has resulted in a more than proportionate increase in output during the 1990-2005 period, with only 0.7 units of capital required to yield a one- unit increase in output. It has been pointed out in Chapter 1 that total factor productivity must rise in UK plants and enterprises if growth is to be sustained. It follows that increasing the efficiency of labour, and improving the organizational structure of UK firms, may be at least as important in generating economic growth as raising the absolute level of investment.
Studies such as Young (1994) suggest that in a global market with ‘footloose’ multinationals continually reappraising the location of investment decisions, it is relative efficiency which is becoming a crucial factor in investment decisions. Changes in total factor productivity (and thereby costs) in the UK relative to other countries may therefore have an increasingly significant influence on investment decisions in the UK.
Conclusion
Investment occurs in so wide a variety of assets and sectors that it must be disaggregated substantially if any close statistical fit is to be found. However, even when we concentrate on fixed investment in manufacturing, no single theory ‘explains’ much of the variation in investment. What evidence there is certainly suggests that UK investment is relatively interest-inelastic, reducing the effectiveness of the interest rate as a policy instrument. Nevertheless, insofar as changes in interest rates affect expectations, lower interest rates may still contribute to higher investment.
Although much less important than consumption in aggregate demand, investment has, through the multiplier, a significant effect on National Income, and is the most volatile element in aggregate demand. It also affects the productive potential of an economy. Even though the link between investment and growth is in some ways tenuous, it is interesting that higher growth rates of fixed investment in various countries have been accompanied by stronger growth performances. Some have also suggested that the observed increases in labour productivity suggest that UK investment is now being more efficiently utilized, as reflected by falls in the incremental capital/output ratio for the UK noted in Table 17.3, though clearly there is much scope for further falls in this respect. Increased globalization of production and investment decisions is placing a still greater premium on the UK, matching, and surpassing, the efficiency with which investments are utilized in other countries.
Key points
■ Investment is an important element of aggregate demand, contributing around 13% of total final expenditure (TFE).
■ Investment also contributes to the ‘supply side’ of the economy, e.g. directly influencing real output per unit of factor input.
■ Investment is a ‘flow’, as it involves a rate of change.
■ Investment is volatile, having a significant impact on changes in National Income (via the multiplier).
■ The share of investment undertaken by the public sector has edged up over the past few years to 12%.
■ Expectations as to future profitability are a key factor in influencing the level of investment.
■ Other relevant factors include the rate of interest, the rate of change of output (accelerator theory), levels and rates of depreciation of capital stock, size of public sector, financial support available, etc.
■ In a global economy, changes in UK costs relative to other countries have been identified as influencing UK levels of investment.
■ As well as the levels of investment, the efficiency with which any investment is utilized is also important.
Now try the self-check questions for this chapter on the Companion Website. You will also find useful links to relevant websites.
References and further reading
Ashworth, P., Hubert, F., Pain, N. and
Riley, R. (2001) UK Fixed Capital Formation: Determinants and Constraints, Report to Department of Trade and Industry and CBI/TUC Working Group on Investment, London, National Institute of Economic and Social Research.
Bank of England (2010) Inflation Report, London, Bank of England.
Barrel, R. and Riley, R. (2006) Is UK business investment unusually weak? National Institute Economic Review, April, 60-2.
Benassy-Quere, A. and Coeure, B. (2010) Economic Policy, Oxford, Oxford University Press.
Bloom, N., Bond, S. and Van Reenen, J. (2001) The Dynamics of Investment Under Uncertainty, IFS Working Paper, No. 2001/05, London, Institute for Fiscal Studies.
Bond, S. and Jenkinson, T. (1996) The assessment: investment performance and policy, Oxford Review of Economic Policy, 12(2): 1-29.
Bond, S. and Meghir, C. (1994) Financial constraints and company investment, Fiscal Studies, 15(2): 1-18.
Bond, S., Denny, K. and Devereux, M. (1993) Capital allowances and the impact of Corporation Tax on investment in the UK, Fiscal Studies, 14(2): 1-14.
Bond, S., Elston, J., Mairesse, J. and Mulkay, B. (1997) Financial Factors and Investment in Belgium, France, Germany and the UK, NBER Working Paper, No. 5900, Cambridge MA, National Bureau of Economic Research.
Bunn, P. and Trivedi, K. (2005) Corporate Expenditures and Pension Contributions: Evidence from UK Company Accounts, Bank of England Working Paper, 276, London, Bank of England.
Carruth, A., Dickerson, A. and Henley, A. (2000) Econometric modelling of UK aggregate investment: the role of profits and uncertainty, The Manchester School, 68(3): 276-300.
Catinat, M. et al. (1987) The determinants of investment, European Economy Annual Economic Report, 31(March): 5-60.
COM (1991) European Economy, Annual Economic Report 1991-92. The profitability of fixed capital and its relation with investment, No. 50, December, Brussels, Commission of the European Communities.
Corbett, J. and Jenkinson, T. (1996) The Financing of Industry: An International Comparison, mimeo, University of Oxford.
Cummins, J. G., Hassett, K. A. and Hubbard, R. G. (1994) A reconsideration of investment behaviour using tax reforms as natural experiments, Brookings Papers on Economic Activity, 2, 1-74.
Cummins, J. G., Hassett, K. A. and Hubbard, R. G. (1996) Tax reforms and investment: A cross-country comparison of investment expenditures, Journal of Public Economies and Investment, 62, 237-73.
Department of Trade and Industry (2000) UK Competitiveness Indicators 1999, London, The Stationery Office.
Devereux, M. (1989) Tax asymmetries, the cost of capital and investment: some evidence from the United Kingdom panel data, Economic Journal, 99, 103-12.
Driver, C., Temple, P. and Urga, G. (2001) The Profit Orientation of UK Manufacturing Investment: Does π beat Q?, Working Paper, No. 01/01, Department of Investment, Risk Management and Insurance, London, City University Business School.
Ford, R. and Poret, P. (1990) Business Investment in the OECD Economies: Recent Performance and Some Implications for Policy, OECD Working Paper, 88, Paris, Organisation for Economic Cooperation and Development.
Giavazzi, F. and Blanchard, O. (2010) Macroeconomics: A European Perspective, Harlow, Financial Times/Prentice Hall.
Gordon, R. J. and Veitch, J. M. (1987) Fixed investment in the American business cycle 1919-1983, in Gordon, R. J. (ed.), The American Business Cycle: Continuity and Change, Chicago IL, University of Chicago Press.
House of Commons (1994) Trade and Industry Committee, Competitiveness of UK Manufacturing Industry, Second Report, London, HMSO.
Koeva, P. (2003) UK Investment: Is There a Puzzle?, IMF Country Report No. 03/47, March.
Kennedy, M. (1997) Economic activity and inflation, in Artis, M. J. (ed.) The UK Economy (14th edn), Oxford, Oxford University Press.
McCormick, B. et al. (1983) Introducing Economics, London, Penguin.
Mullins, M. and Wadhwani, S. B. (1989) The effects of the stock market on investment, European Economic Review, 33: 939-56.
Newman, S., Roclert, C. and Schaap, R. (2011) Investing in the post recession world, Harvard Business Review, January-February, 150-5. Nickell, S. and Nicolitsas, D. (2000) Human capital, investment and innovation: what are the connections?, in Barrell, R., Mason, G. and O’Mahoney, M. (eds), Productivity, Innovation and Economic Performance, Cambridge, Cambridge University Press.
OECD (2005) Economic Outlook, December, Paris, Organisation for Economic Cooperation and Development.
OECD (2010a) Economic Outlook, No 87, Annex tables, Paris, Organisation for Economic Cooperation and Development.
OECD (2010b) OECD Factbook 2010, Paris, Organisation for Economic Cooperation and Development.
Oliner, S. D., Rudebusch, G. D. and Sichel, D. E. (1995) New and old models of business investment; a comparison of forecasting performance, Journal of Money, Credit and Banking, 27(3): 806-26.
ONS (2010) Monthly Digest of Statistics, No. 778, London, Office for National Statistics. Osler, C. L. (1994) High foreign real interest rates and investment in the 1990s, Federal Reserve Bank of New York Quarterly Review, Spring 1994, 8-34.
Porter, M. and Ketels, C. (2003) UK Competitiveness: Moving to the Next Stage, DTI Economics paper no. 3, London, Department of Trade and Industry/Economic and Social Research Council.
Sumner, M. (1998) Note on improving the effects of effective tax rates on business investment, Journal of Public Economics, 35(3): 393-6.
Temple, P., Urga, G. and Driver, C. (2001) The influence of uncertainty on investment in the UK: a macro or micro phenomenon?, Scottish Journal of Political Economy, 48(4): 361-82.
Tevlin, S. and Whelan, K. (2000) Explaining the Investment Boom of the 1990s, Finance and Economics Discussion Series 2000-11, Washington DC, Federal Reserve Board.
Turner, P. (1989) Investment: theory and evidence, Economic Review, 6(3).
Vittas, D. and Brown, R. (1982) Bank Lending and Industrial Investment, London, Banking Information Service.
Weale, M. (2006) Commentary: the savingsinvestment balance. Is there a UK investment shortfall? National Institute Economic Review, April, 4-9.
Whitaker, S. (1998) Investment in this recovery: an assessment, Bank of England Quarterly Bulletin, February, 38(1): 38-47.
Young, G. (1994) International competitiveness, international taxation and domestic investment, National Institute Economic Review, May, 44-8.
More on the topic Investment:
- Malta
- Qatar
- Recent developments
- Background Context
- Introduction
- Engines of Empire: The Chartered, Limited Liability Joint Stock Companies
- The Netherlands and the UK: The Witteveen Reports and their contradictory results
- 2 Husbandry and estate management: statutory standards
- Other Mycobacterial Infections in Livestock and Wildlife in Tanzania
- Oman