MAIN RESULTS
21.5.1 The Effect of Democracy on Taxes
Our first results are contained in Table 21.2, which reports estimates of Equation (21.6) with the log of tax revenue to GDP ratio (tax to GDP ratio for short) as the dependent variable.
Column 1 is estimated by OLS imposing ρ = 0 in Equation (21.6). Though biased when ρ > 0, this is a natural benchmark, particularly since it corresponds to a specification often used in the literature. In all columns, we report standard errors corrected for arbitrary heteroskedasticity and serial correlation at the country level. We multiply the coefficient on democracy by 100 to ease interpretation. Throughout, we always report the number of observations, number of countries in the sample, and the number of switches in democracy from 0 to 1 or vice versa in the estimation sample (which is 92 in this case). All models include a lag of GDP per capita as a control, but the coefficients are not reported to save space. The coefficient on the estimated effect of democracy in this column, 15.00 (to two decimal places), implies a 15% increase in the tax to GDP ratio with a standard error of 4.33, and is thus statistically significant at less than the 1% confidence level. This estimate is also economically significant. It indicates that democratization— that is, a change in our democracy dummy—is associated with a 2.4 percentage points increase in the tax to GDP ratio.
Column 2 includes the lag of tax to GDP ratio on the right-hand side, thus relaxing the assumption that ρ = 0. The effect of democracy, γ, is now estimated to be 11.7 (approximately 11.7%, with standard error = 3.38) and is again statistically significant at less than the 1% level. In the presence of the lagged dependent variable on the right-hand side in this specification, γ is now merely the short-run impact of democracy on the tax to GDP ratio, not the long-run effect.
The estimate of ρ is 0.27, and is significant, suggesting that there is indeed some persistence in the dependent variable. To obtain the long-run effect, we set zit = zit~1 so that the dynamics in the outcome variable converge to the new “steady state.” This gives the long-run effects of a switch to democracy as
and is reported at the bottom, together with the p-value for the hypothesis that it is equal to 0. In Column 2, this long-run effect implies a 16% increase in the tax to GDP ratio from a permanent switch to democracy.
Figure 21.2 shows the effect of democracy on the tax to GDP ratio visually. Here, similar to an event study analysis, we place all transitions to democracy at t = 0, and those observations before then (with t < 0) show the trends in tax to GDP ratio before democratization, and those with t > 0 correspond to changes in the tax to GDP ratio after
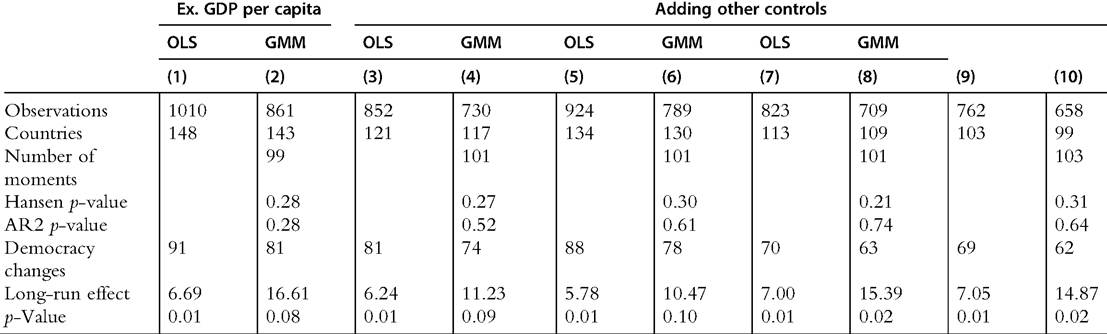
Table 21.2 Effects of democratization on the log of tax revenue as a percentage of GDP
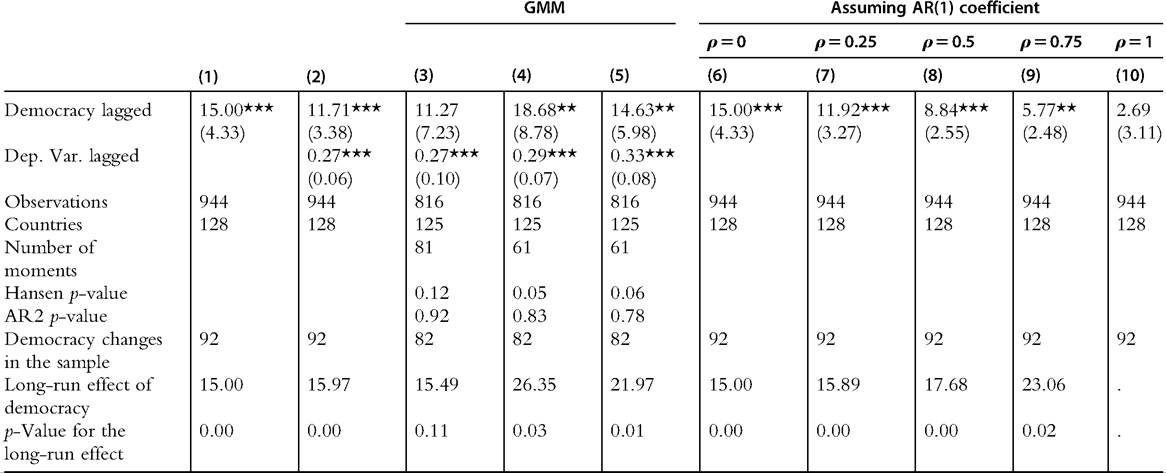
Note: OLS estimates (Columns 1—2) include a full set of country and year fixed effects. Arellano and Bond's GMM estimators ofthe dynamic panel model (Columns 3—4) remove country fixed effects by taking first differences ofthe data, or by taking forward orthogonal differences (Column 5) and then constructing moment conditions using predetermined lags ofthe dependent variable and democracy. Columns 4 and 5 use up to the fifth lag of predetermined variables to create moments, restricting the number of moments used. Columns 6—10 impose different values for the autocorrelation coefficient in the tax revenue as apercentage ofGDP series, and estimates the effect ofdemocracy includingafullset ofcountry and year fixed effects. All models control for lagged GDP per capita but this coefficient is not reported to save space.
Robust standard errors, adjusted for clustering at the country level, are in parentheses. ***: significant at 1%; **: significant at 5%; *: significant at 10%. We do not report long-run effects and their p-values in Column 10 because they are not defined for ρ ¼ 1.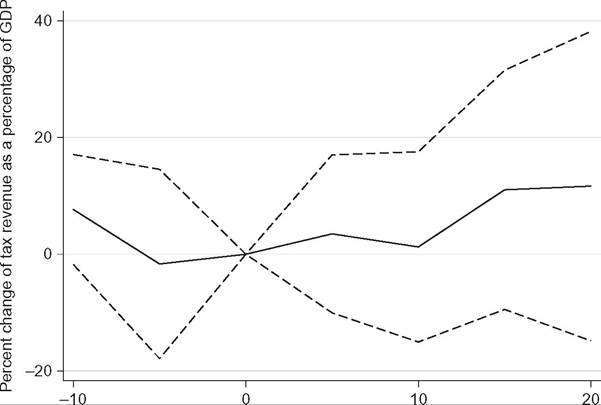
Years around democratic transition
Figure 21.2 Tax revenue as a percentage of GDP around a democratization. Constructed using the 5-year panel.
democratization. The figure shows that there is no discernible change in the tax to GDP ratio before democratization, increasing our confidence in the results concerning the effect of democracy on taxes. It also confirms that the effect of democracy on the tax to GDP ratio evolves only slowly, reaching a maximum 15 years after the democratization takes place. This underscores the role of the lagged dependent variable in our econometric specifications.
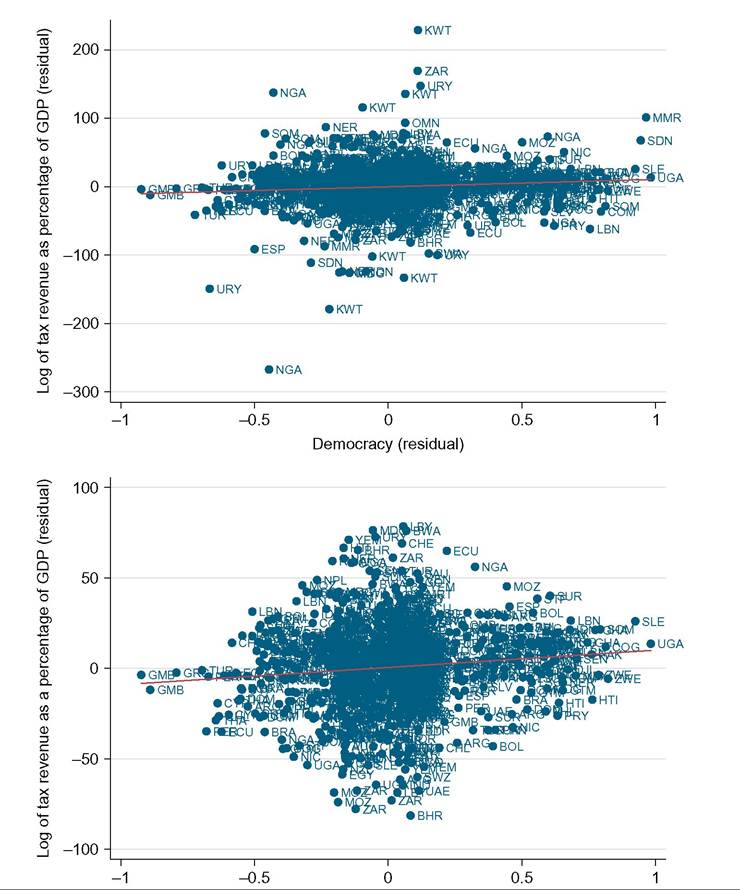
As a second diagnostic for our estimates, Figure 21.3 shows a scatterplot of the residuals of the tax to GDP ratio (in logs) on the vertical axis against the residuals of the lag of our democracy measure on the horizontal axis. All covariates, including year and country fixed effects, and the lagged dependent variable, are partialed out. Each point corresponds to a particular country/year observation. The slope of the regression line coincides with our estimated coefficient of 11.7. The figure shows that the estimated relationship does not seem to be driven by any particular outlier. To explore this more formally we removed 49 observations whose Cook distance was above the rule of thumb 4/N, with N the sample size and reestimated our model. The coefficient of democracy falls to 8.28 with standard error 2.46, and is still significant at the 1% level. The bottom panel of Figure 21.3 shows the scatterplot excluding these outliers. We have experimented with a number of other methods for dealing with outliers, such as Huber M-regressions and excluding outliers with estimated standardized errors > 1.96, and our results on tax to GDP ratios remain generally unchanged.
Democracy (residual)
Figure 21.3 Residual of tax revenue as a percentage of GDP (vertical axis) against the residual of our democracy indicator. Each dot is a country/year observation, and there are a total of 975 observations. Bottom figure excludes outliers.
As noted in the previous subsection, the OLS estimator of Column 2 is inconsistent because of the (downward) bias in the estimation of ρ. Column 3 reports the GMM estimator described earlier with the full set of moments (in this case, this corresponds to 82 moments as noted in the table). Notably, the estimate forρ is identical up to two decimal places, indicating in fact that if there was a downward bias in the estimation of Column 2, it was negligible, suggesting that the large-T assumption (given the low persistence ρ) is a good approximation. The estimate for γ also decreases marginally, but the standard error increases substantially, making the resulting estimate insignificant at conventional levels. However, the long-run impact is very similar to the OLS estimate of approximately 15 (15%), with a p-value of 0.11. Itshould also be noted that the tests for second-order autocorrelation in the error term and the Hansen’s J test for over identification pass comfortably, thus further increasing our confidence in this specification.
Columns 4 and 5 present alternative GMM estimators with fewer moments and with forward-differencing, respectively. Both estimates only use up to the fifth valid lags of democracy and the dependent variable to form moment conditions. The point estimates on both γ and ρ are larger than Columns 2 and 3, and significant at the 5% level, and hence imply the significantly larger long-run effects, 26% and 21%, respectively, reported at the bottom.
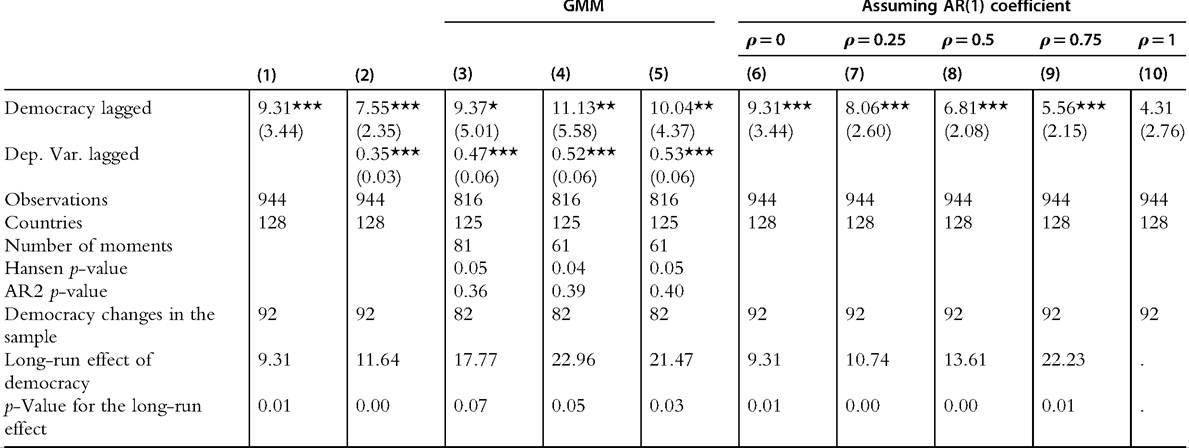
Columns 6—10 estimate Equation (21.6), imposing different values for ρ spanning the entire interval from 0 to 1.
We use the same sample as in Column 2, which is also the same one as in Column 1 and thus implies that in this case Column 6, which sets ρ = 0, is identical to Column 1 (this will not be the case in some of our later tables). As noted above, the problem with the OLS estimation (with fixed effects) stems from the bias in the estimate of ρ, so conditional on the correct value for this variable, the OLS estimate of the impact of democracy is consistent. In almost all cases, with the exception of the last column, there is a statistically and economically significant impact of democracy on the tax to GDP ratio. The long-run impact is smaller when ρ is assumed to take a small value, and comparable to that in Column 2 when we impose ρ = 0.25. The coefficient gets smaller and less significant the farther the imposed value ofρ is from the estimated values in Columns 2-5.[391] In sum, the median estimated long-run effect of democracy on the tax to GDP ratio from this table is almost 16%, with estimates that range from 15% to 26%.Table 21.3 has the same structure as Table 21.2, but uses total government revenue to GDP ratio as the dependent variable. Though the impact of democracy is a little smaller, the pattern is qualitatively very similar, with slightly larger long-run effects in the GMM estimators relative to the OLS estimators. The estimates in Column 2 show that the coefficient of lagged democracy is 7.55 (standard error = 2.35), which is significant at the
Table 21.3 Effects of democratization on the log of total government revenue as a percentage of GDP

1% level. The long-run effect of democracy is to increase total revenue as a percentage of GDP by 11.64 and is significant at the 1% level. The baseline GMM estimator leads to larger values ofρ and γ, resulting in a larger long-run effect of 17.8%.
Figure 21.4 is the analogue of Figure 21.2, but using the total revenue to GDP ratio measure instead, and shows a similar pattern, although there is a slight downward trend prior to democracy in this variable. In sum, the evidence again suggests that democracy results in larger government revenues as a share of GDP.Table 21.4 estimates Equation (21.6) for the annual panel. Column 1 includes just four (annual) lags of the dependent variable and democracy on the right-hand side, and is estimated by OLS. Even though individual lags of democracy are not significant, they are jointly significant as witnessed by the long-run effect reported at the bottom, which is similar to the OLS long-run effect in Table 21.2. Column 2 adds four more lags and Column 3 adds four further lags, for a total of 12 lags of democracy and the dependent variable on the right-hand side (to economize on space, we only report the p-values for F-tests for the joint significance of these additional lags). The overall pattern and the long- run effects are very similar to Column 1. Columns 4—6 estimate the same models using the Arellano and Bond GMM estimator. The long-run effects are substantially higher and comparable to the one estimated in Columns 3—5 in Table 21.2 using the 5-year panel.
Table 21.5 probes the robustness of the tax to GDP ratio results, focusing on the 5-year panel. Odd-numbered columns report OLS estimates of Equation (21.6), whereas even-numbered columns are for the GMM estimator (equivalent to Column 3 of
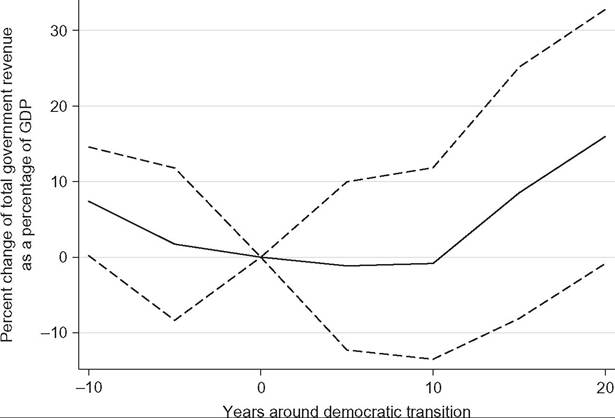
Figure 21.4 Total government revenue as a percentage of GDP around a democratization. Constructed using the 5-year panel.
Table 21.4 Effects of democratization on the log of tax revenue as a percentage of GDP, yearly panel
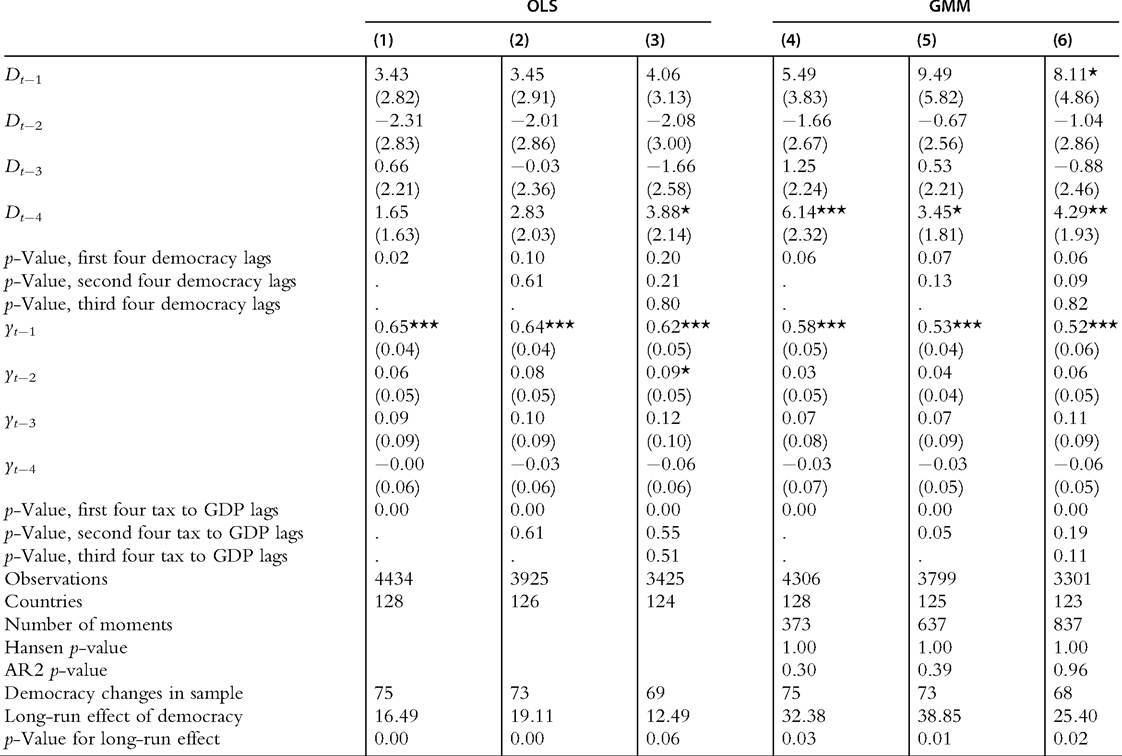
Note: OLS estimates (Columns 1—3) include a full set of country and year fixed effects. Arellano and Bond's GMM estimators of the dynamic panel model (Columns 4—6) remove country fixed effects by taking first differences of the data and then constructing moment conditions using as many predetermined lags of the dependent variable and democracy as included in the model. To save space we only report the p-value of a joint test of significance for lags 5—8 (second four lags) and lags 9—12 (third four lags). All models control for as many lags ofGDP per capita as lags ofdemocracy in the equation, but these coefficients are not reported to save space. ***: significant at 1%; **: significant at 5%; *: significant at 10%. We do not report long-run effects and their p-values in Column 10 because they are not defined for ρ ¼ 1.
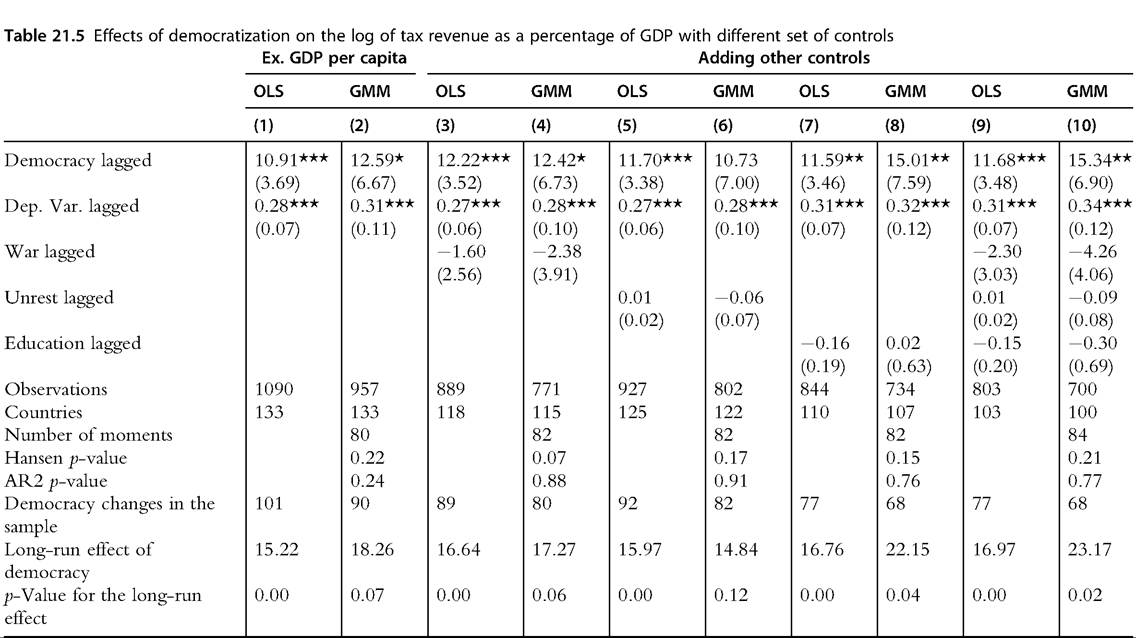
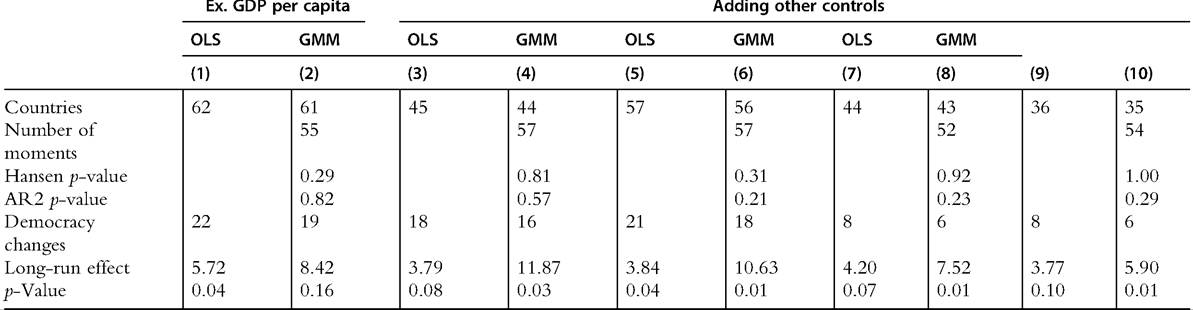
Note: OLS estimates (odd columns) include a full set of country and year fixed effects. Columns 3—10 include lagged GDP per capita as a control. Arellano and Bond's GMM estimators of the dynamic panel model (even columns) remove country fixed effects by taking first differences of the data and then constructing moment conditions using predetermined lags of the dependent variable and democracy. Robust standard errors, adjusted for clustering at the country level, are in parentheses. ****: significant at 1%; **: significant at 5%; *: significant at 10%.
Table 21.2). The first two columns exclude GDP per capita as a control. Reassuringly, however, our coefficients remain positive and significant, implying a 10—15% increase in the tax to GDP ratio following a democratization. Columns 3 and 4 include the lagged index of foreign wars. This is useful since several authors have claimed that either in history or in the recent past, war has been a major determinant of taxation and redistribution policies. For example, the famous Tilly (1985) hypothesis explains the growth ofthe state with war and preparation for war (see also Besley and Persson, 2011). More recently, Atkinson et al. (2011) have pointed to large wars and the concomitant economic changes as some of the most significant events correlated with declines of 1% income shares in combatant countries (see also Scheve and Stasavage, 2010, 2012). In contrast to these hypotheses, we do not find any effect of war on the tax to GDP ratio in our post-war panel. The effect of democracy on the tax to GDP ratio remains essentially unchanged when the external war index is included.
Columns 5 and 6 include the lagged measure of social unrest from the SPEED data. This variable is insignificant and has no effect on the coefficient of democracy. Columns 7 and 8 include the stock of education, measured as the fraction of the population with at least secondary schooling from the Barro-Lee dataset, which could be an important determinant of fiscal policy and inequality. Once again, this variable has no major effect on the estimate of the impact of democracy on the tax to GDP ratio and is itself insignificant. Columns 9 and 10 include all three of these variables together, again with a very limited impact on our estimates and no evidence of an effect on war, unrest or the stock of education. The long-run effects at the bottom are very similar to those in Table 21.2 and highly significant.[392]
Overall, the evidence in Tables 21.2—21.5 shows a strong and robust impact of democracy on taxes as measured by the tax to GDP ratio or the government revenue to GDP ratio. This evidence suggests that democracy does lead to more taxes. This evidence is consistent with several of the works discussed above, though it is in stark contrast with Gil et al. (2004). The main difference is the cross-national focus of Gil, Mulligan, and Sala-i-Martin, which contrasts with our econometric approach exploiting the within-country variation (with country fixed effects and also controlling for the dynamics of the tax to GDP ratio). For reasons explained above, we believe that the cross-sectional relationship is heavily confounded by other factors and is unlikely to reveal much about the impact of democracy on redistribution and taxes.
We next investigate whether there is an impact of democracy on inequality.
21.5.2 The Effect of Democracy on Inequality
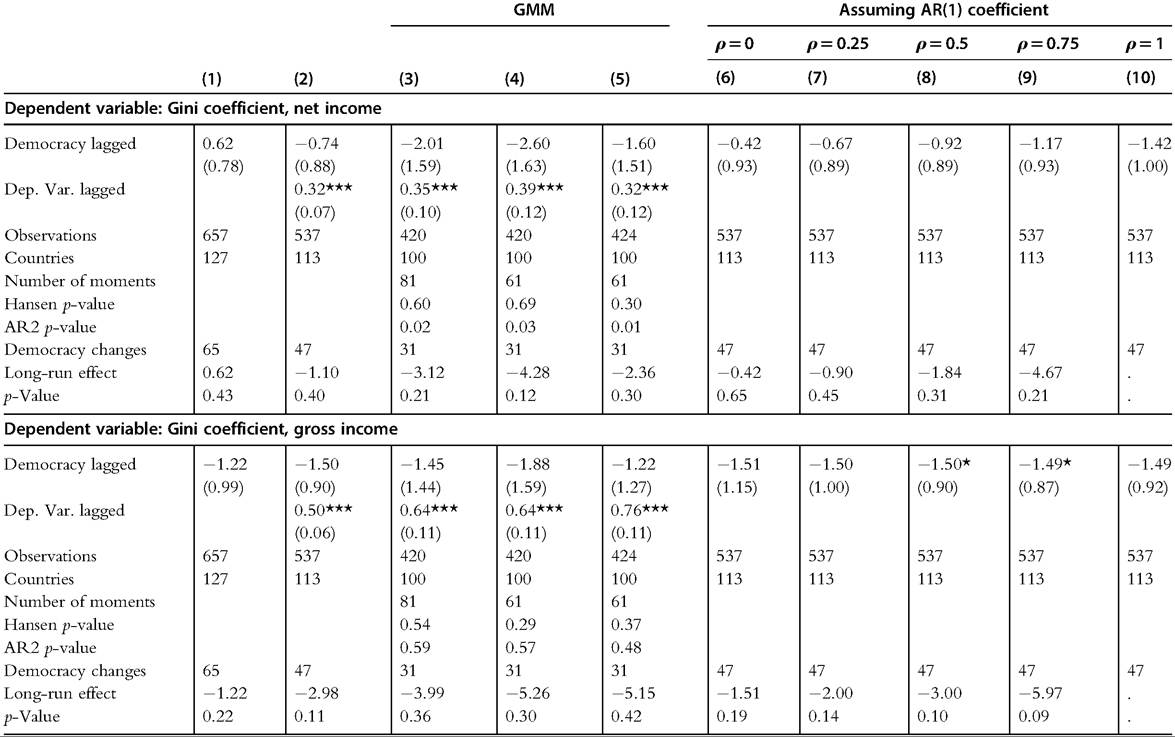
Tables 21.6 and 21.7 turn to the effect of democracy on inequality. Each panel of Table 21.6 mirrors Table 21.2, with the top panel using the net Gini coefficient (after tax and transfers) and the bottom panel using the gross Gini coefficient (before tax and redistribution) as dependent variables.
Though the sample is smaller and data quality may be lower, the most important message from these tables is that there is no consistent evidence for a significant effect of democracy on inequality. Some of our specifications show negative effects of democracy on inequality, particularly on the gross Gini coefficient, but these tend to have large standard errors and are not stable across specifications.
For example, in Table 21.6, most of our estimates suggest there is a negative effect of democracy on the net Gini coefficient, but none of these estimates is statistically significant at the standard levels. For instance, the estimates in Column 3 imply that democracy reduces the Gini coefficient (measured on a 0- to 100-scale) by 2.01 points (standard error = 1.59) in the short run, and by 3.1 points in the long run. Given the standard deviation of the net Gini of 10.76 (see Table 21.1), these effects are quantitatively sizable (though they are also smaller in other columns) but also statistically insignificant. The magnitudes for the gross Gini are similar, but a few specifications contain significant results (those with imposed values ofρ > 0.5). This may be because there is less measurement error in this measure relative to the net Gini, which does depend on potentially misreported taxes and transfers.
The AR2 test for the GMM estimator for the net Gini suggests there is higher order autocorrelation in the transformed errors, which invalidates the use of second lags as instruments. However, when we only use deeper lags to form valid moment conditions we get very similar results, with smaller effects of democracy on inequality, consistent with the fact that the Hansen overidentification test passes comfortably. The specification tests (AR2 and Hansen J test) for our models using the gross Gini as dependent variable also pass comfortably.
Figure 21.5, which is similar to Figures 21.2 and 21.4, visually shows that there is no substantial fall in inequality following a democratization. There is no pre-trend in inequality. But there is a temporary increase in inequality prior to democratization, which could have persistent effects biasing our estimates unless we control for the dynamics of inequality, further motivating our specifications controlling for such dynamics.
As a second diagnostic of our estimates, Figure 21.6 again shows a scatterplot of the residuals of the net Gini on the vertical axis against the residuals of the lag of our democracy measure on the horizontal axis. All covariates, including year and country fixed effects and the lagged dependent variable, are partialed out. Each point corresponds to a particular country/year observation. The slope of the regression line coincides with our estimated coefficient of —0.744 in Column 2 of the top panel in Table 21.6. The
Table 21.6 Effects Ofdemocratization on inequality
Note: OLS estimates (Columns 1—2) include a full set of country and year fixed effects. Arellano and Bond's GMM estimators ofthe dynamic panel model (Columns 3—4) remove country fixed effects by taking first differences of the data, or by taking forward orthogonal differences (Column 5) and then constructing moment conditions using predetermined lags of the dependent variable anddemocracy. Columns 4 and 5 use up to the Afthlagofpredeterminedvariables to create moments, restrictingthe numberofmoments used. Columns 6—10 impose differentvalues for the autocorrelation coefficient ofthe dependent variable, and estimates the effect ofdemocracy including a full set ofcountry andyear fixed effects. All models control forlagged GDP per capita but this coefficient is not reported to save space. Robust standard errors, adjusted for clustering at the country level, are in parentheses. ***: significant at 1%; **: significant at 5%; *: significant at 10%. We do not report long-run effects and their p-values in Column 10 because they are not defined for ρ ¼ 1.
Note: OLS estimates (odd columns) include a full set of country and year fixed effects. Columns 3—12 control for lagged GDP per capita. Arellano and Bond's GMM estimators of the dynamic panel model (even columns) remove country fixed effects by takingfirst differences ofthe data and then constructing moment conditions usingpredeterminedlags ofthe dependent variable and democracy. Robust standard errors, adjusted for clustering at the country level, are in parentheses. ***: significant at 1%; **: significant at 5%; *: significant at 10%.
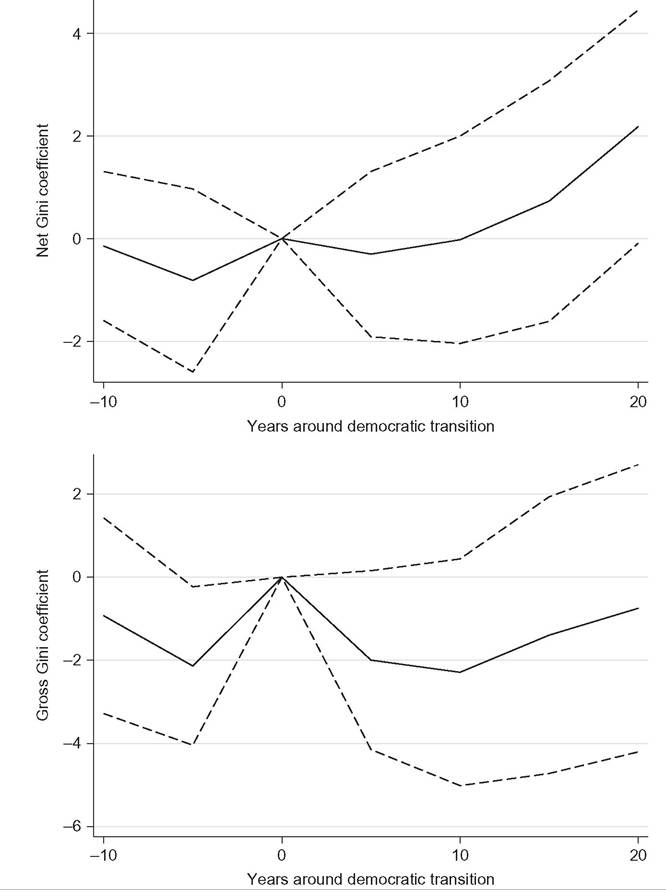
Figure 21.5 Gini coefficient around a democratization. Constructed using the 5-year panel.
figure shows that the estimated relationship does not seem to be driven by any particular outlier. Figure 21.7 shows the same scatterplot, except with gross Gini on the y-axis, and again suggests a negative, if imprecise, relationship. We explored the impact of outliers further, using a procedure similar to the one we used before. We therefore removed observations whose Cook distance was above the rule of thumb 4/N, with N the sample
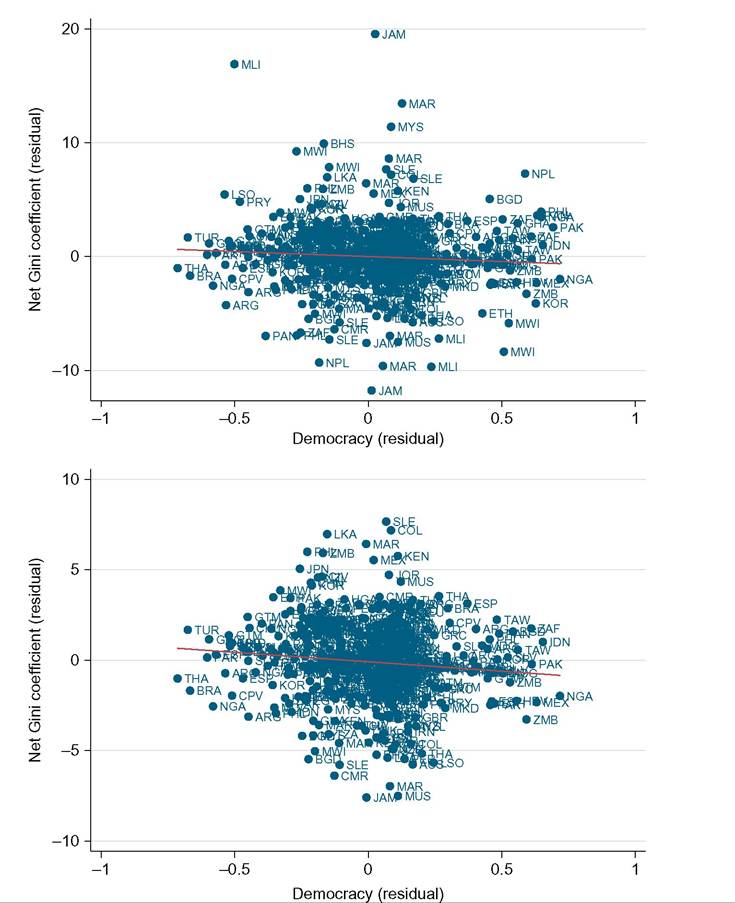
Figure 21.6 Residual of net Gini (vertical axis) against the residual of our democracy indicator. Each dot is a country/year observation, and there are a total of 538 observations. The bottom figure excludes outliers.
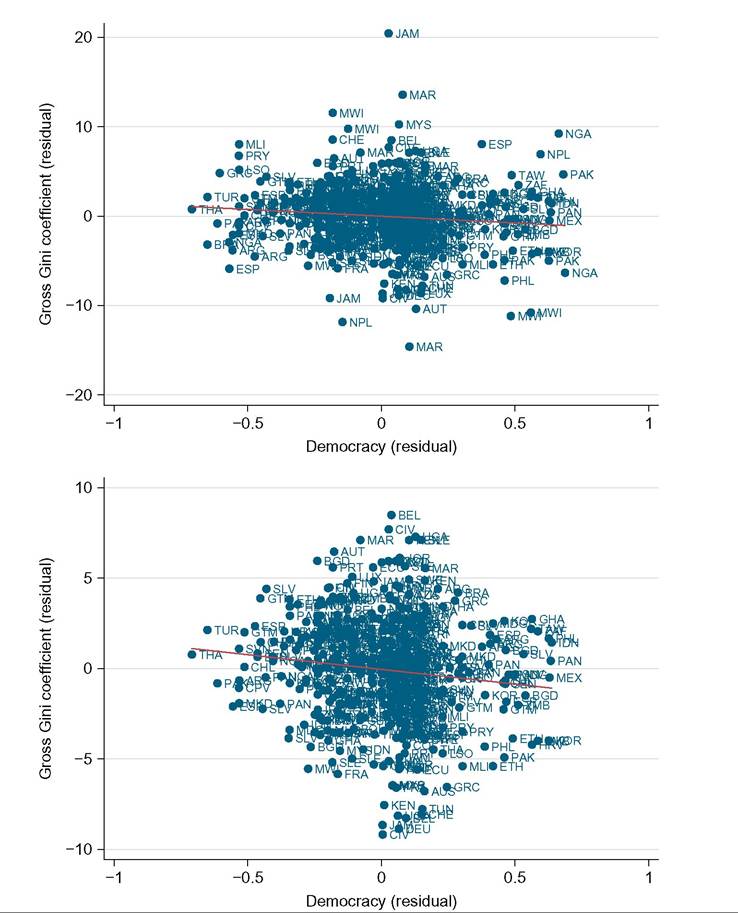
Figure 21.7 Residual of gross Gini (vertical axis) against the residual of our democracy indicator. Each dot is a country/year observation, and there are a total of 538 observations. The bottom figure excludes outliers.
size and reestimated our model. Democracy has no significant effect in this sample without the outliers for the net Gini, but there is a moderately significant effect on the gross Gini in some specifications. In addition, we found a marginally significant effect on both the net and the gross Gini when we used Huber’s M estimator. When excluding observations with standardized residuals >1.96, we again found a significant negative effect on the gross Gini but not on the net Gini.
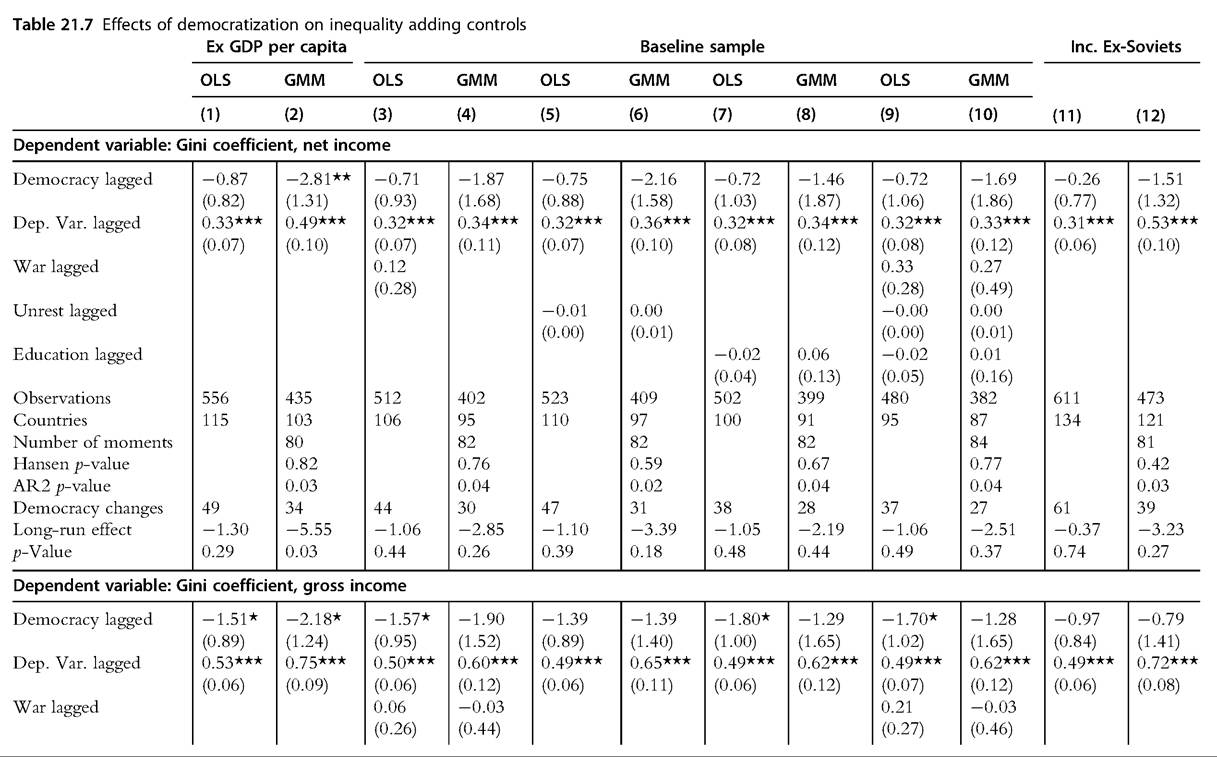
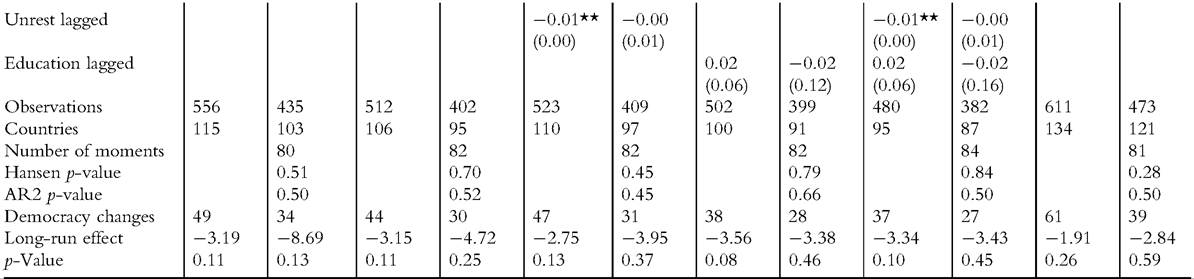
Table 21.7 adds covariates, as in Table 21.5, for the tax variables, and comprises two panels, one for each Gini measure. The only difference is that it adds two columns including ex-Soviet countries in the estimation sample. The addition ofcontrols does not change the patterns shown in Table 21.6, although omitting income as a control does lead to moderately significant negative effects in the GMM estimate on net Gini, and in both the OLS and GMM estimates for gross Gini. This suggests that there may be other forces correlated with GDP and democracy that influence inequality, such as some of the structural transformation variables we examine below. Social unrest is the only variable that has an effect on inequality that is significant in the gross Gini specifications, and our point estimates on democracy are roughly unchanged. The addition of ex-Soviet countries to our estimation sample results in smaller magnitudes of the effect of democracy on inequality, consistent with the idea that inequality went up in these countries following democratization.
We also found (but are not reporting to save space) that democracy does not have any significant effect on other measures of inequality. In particular, in Appendix A we show that, with updated data and our sample, democracy appears to have no effect on the log of industrial wages and explain why this result is different from those of Rodrik (1999).
We have also experimented with other estimates of the Gini using a panel with data every 5 years constructed from the World Income and Inequality Dataset. Controlling for indicators of type of concept used to calculate the Gini (i.e., disposable income, consumption and so on) as well as indicators for data quality, we found broadly similar results, though generally for smaller samples.
Overall, although some specifications do show a negative impact of democracy on inequality, particularly the gross Gini, there is no consistent and robust impact. This contrasts with our results on tax to GDP ratio (or the total government revenue to GDP ratio). Though this could be because of the lower quality of inequality data, it might also reflect some of the theoretical forces we have suggested in the previous section. We will turn to an investigation of some of these channels after looking at the relationship between democracy and structural transformation next.
21.5.3 Democracy and Structural Transformation
While our results above suggest that democracy has little net impact on inequality despite increasing taxation, some of the theoretical models we examined above suggest mechanisms by which democracy could affect inequality independently of government redistribution. (The lowering of barriers to entry, provision of public goods, and the expansion of market opportunities under democracy could be offsetting any redistribution accomplished by the fiscal system.) Therefore we examine the effect of democracy on economic structure and education.
Tables 21.8-21.10 look at the impact of democracy on various measures of structural transformation and public goods provision. We focus on the nonagricultural share of employment, nonagricultural share of value added, and secondary enrollment (which is a flow measure, thus better reflecting the effect of democracy on educational investments). Each table has two panels: the top one has the same structure as Table 21.2, whereas the bottom one is similar to Table 21.5 and shows the robustness of the results. Overall, we find significant effects of democracy on these measures of structural transformation.
Forexample, Tables 21.8 and 21.9 show some significant effects of democratization on the size of the nonagricultural sector.[393] Table 21.8 shows that democratization increases the (log of) nonagricultural share of employment, but this effect is generally only significant at the 10% level in the top panel, and is not completely robust to all exogenously imposed values ofρ in Columns 6-10. The bottom panel shows more consistent and significant estimates, but the coefficients differ substantially between the OLS and GMM estimators. Table 21.9, on the other hand shows that democratization increases the non- agricultural share of GDP. We find significant effects across OLS and most GMM specifications, imposing lower values for ρ, and with various sets of controls. The estimated magnitudes are plausible, with democracy increasing the nonagricultural employment by 4-11% and nonagricultural share of GDP by between 6% and 10% in the long run.
Table 21.10 shows a generally robust long-run effect of democratization on log secondary school enrollment. Although the coefficient magnitudes differ substantially between the GMM and OLS estimators, the long-run effect is uniformly positive and generally significant. Together with the taxation results, this suggests that one important economic change that democracies implement is to tax and provide public goods such as schooling. Our GMM specification in Column 3 of the top panel shows that democracy increases secondary enrollment by 67.6% in the long run, with an associated p-value of 0.07.[394]
Table 21.8 Effects of democratization on the loα of the nonaaricultural share of Dooulation
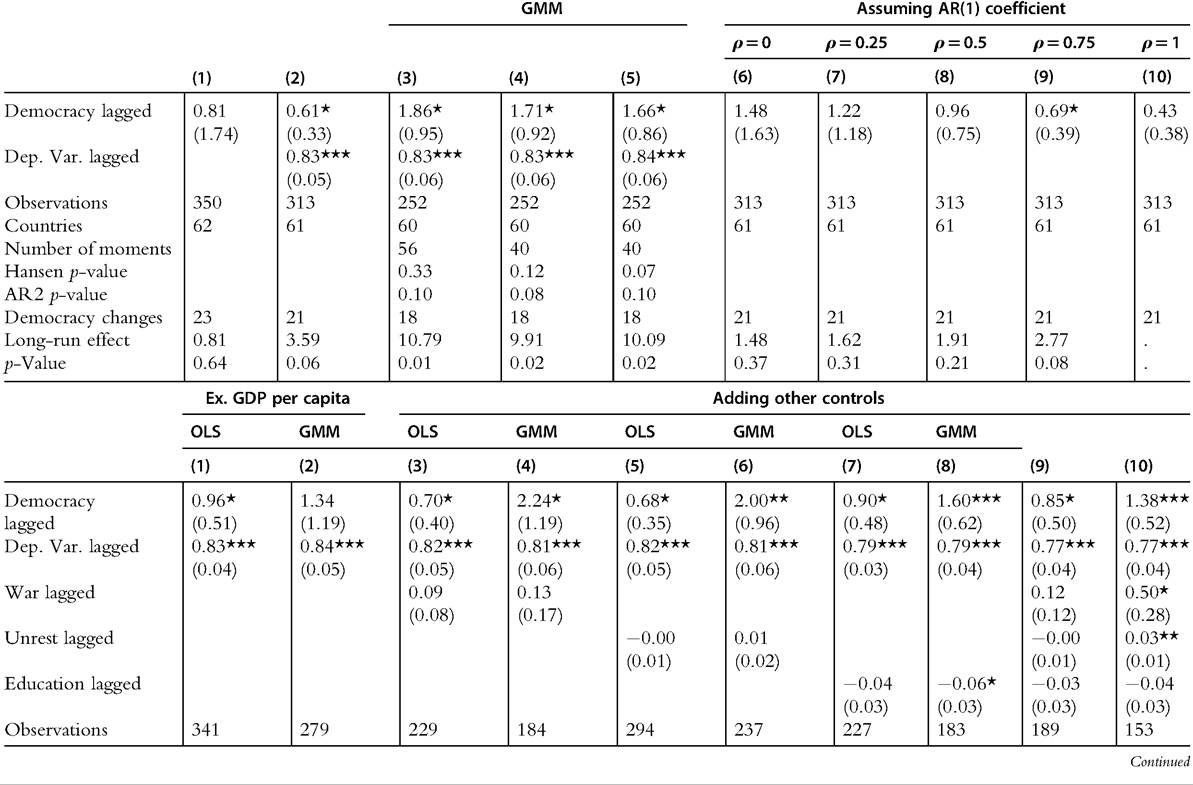
Table 21.8 Effects of democratization on the log of the nonagricultural share of population—cont'd
Notesfor top panel: OLS estimates (Columns 1—2) include a full set of country and year fixed effects. Arellano and Bond's GMM estimators of the dynamic panel model (Columns 3—4) remove country fixed effects by taking first differences ofthe data, or by taking forward orthogonal differences (Column 5) and then constructing moment conditions using predetermined lags ofthe dependent variable and democracy. Columns 4 and 5 use up to the fifth lag of predetermined variables to create moments, restricting the number of moments used. Columns 6—10 impose different values for the autocorrelation coefficient in the percentage of nonagricultural population series, and estimate the effect of democracy including a full set of country and year fixed effects. Robust standard errors, adjusted for clustering at the country level, are in parentheses. Notesfor bottom panel: OLS estimates (odd columns) include a full set of country and year fixed effects. Columns 3—10 include lagged GDP per capita as a control. Arellano and Bond's GMM estimators ofthe dynamic panel model (even columns) remove country fixed effects by taking first differences of the data and then constructing moment conditions using predetermined lags of the dependent variable and democracy. Robust standard errors, adjusted for clustering at the country level, are in parentheses. ***: significant at 1%; **: significant at 5%; *: significant at 10%. We do not report long-run effects and their p-values in Column 10 because they are not defined for ρ ¼ 1.
Table 21.9 Effects of democratization on the log of nonagricultural share of GDP
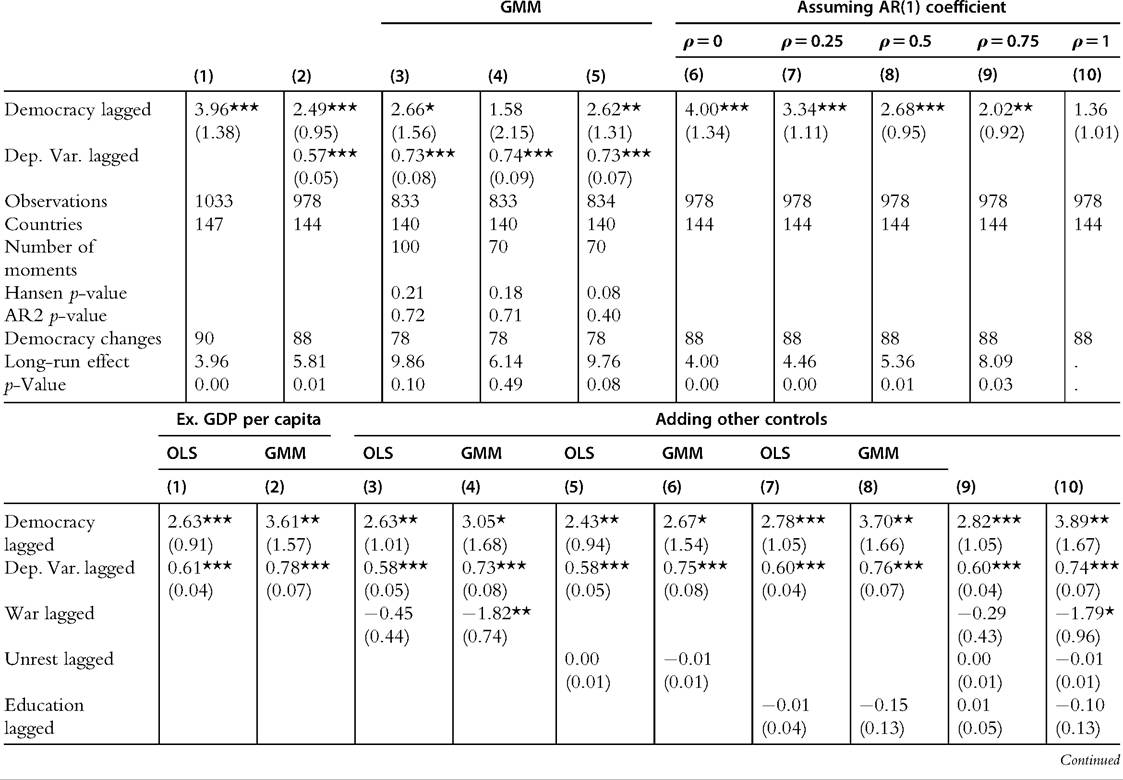
Table 21.9 Effects of democratization on the log of nonagricultural share of GDP—cont'd
Notesfortoppanel: OLS estimates (Columns 1—2) include a full set ofcountry andyearfixed effects. Arellano andBond's GMM estimators ofthe dynamic panel model (Columns 3—4) remove country fixed effects by taking first differences of the data, or by taking forward orthogonal differences (Column 5) and then constructing moment conditions using pre- determinedlags ofthe dependent variable and democracy. Columns 4 and 5 use up to the fifth lag ofpredeterminedvariables to create moments, restricting the number ofmoments used. Columns 6—10 impose different values for the autocorrelation coefficient in the nonagricultural share ofGDP series, and estimate the effect ofdemocracy including a full set of country andyear fixed effects. Robust standard errors, adjustedfor clusteringat the country level, are in parentheses. Notesforbottompanel: OLS estimates (odd columns) include a full set of country and year fixed effects. Columns 3—10 include lagged GDP per capita as a control. Arellano and Bond's GMM estimators of the dynamic panel model (even columns) remove country fixed effects by taking first differences of the data and then constructing moment conditions using predetermined lags of the dependent variable and democracy. Robust standard errors, adjusted for clustering at the country level, are in parentheses. ***: significant at 1%; **: significant at 5%; *: significant at 10%. We do not report long-run effects and their p-values in Column 10 because they are not defined for ρ ¼ 1.
Table 21.10 Effects of democratization on the log of secondary enrollment
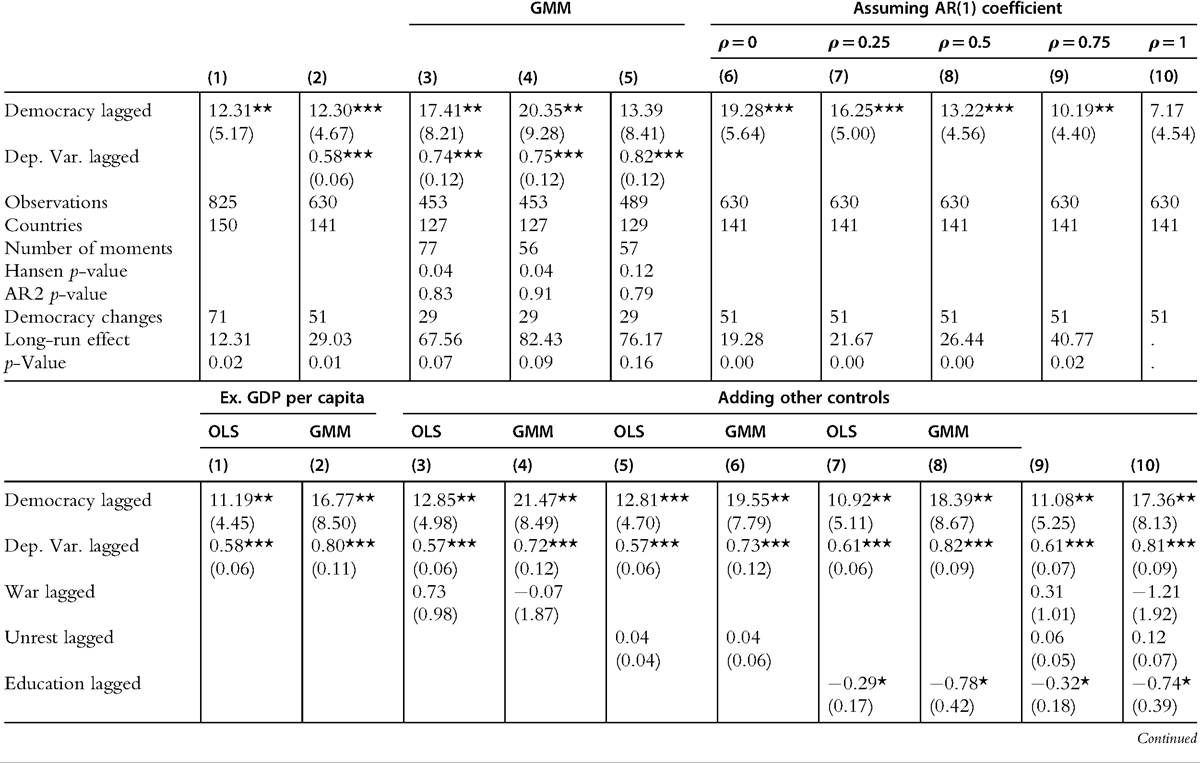
Table 21.10 Effects Ofdemocratization on the log of secondary enrollment—cont'd
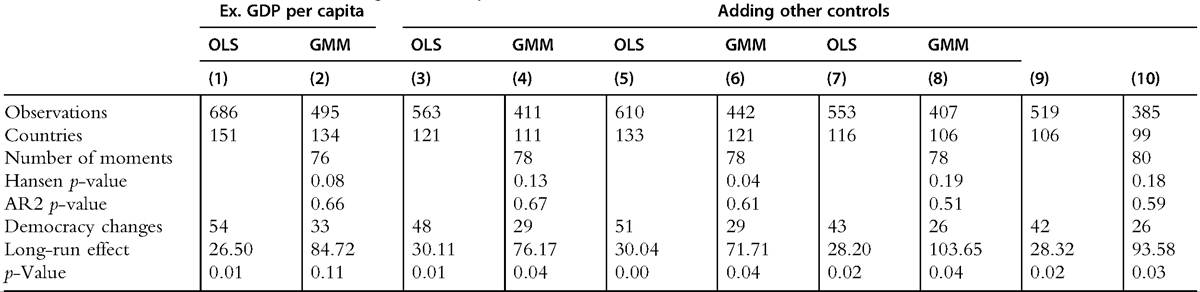
Notesfor top panel: OLS estimates (Columns 1—2) include a full set of country and year fixed effects. Arellano and Bond's GMM estimators of the dynamic panel model (Columns 3—4) remove country fixed effects by taking first differences of the data, or by taking forward orthogonal differences (Column 5) and then constructing moment conditions using predetermined lags of the dependent variable and democracy. Columns 4 and 5 use up to the fifth lag of predetermined variables to create moments, restricting the number of moments used. Columns 6—10 impose different values for the autocorrelation coefficient in the secondary enrollment series, and estimate the effect of democracy including a full set ofcountry and year fixed effects. Robust standard errors, adjusted for clusteringat the country level, are inparentheses. Notesforbottompanel: OLS estimates (odd columns) include a full set ofcountry andyear fixed effects. Columns 3—10 include lagged GDP per capita as a control. Arellano andBond's GMM estimators ofthe dynamic panel model (even columns) remove country fixed effects by takingfirst differences ofthe data andthen constructing moment conditions using predetermined lags of of the dependent variable and democracy. Robust standard errors, adjusted for clustering at the country level, are in parentheses. ***: significant at 1%; **: significant at 5%; *: significant at 10%. We do not report long-run effects and their p-values in Column 10 because they are not defined for ρ ¼ 1.
In sum, there is strong evidence that democratization does not just redistribute income, but also results in a degree of structural change of the economy and investment in public goods.32 As our theoretical discussion implied, this could explain why democratization has a statistically weak effect on inequality. Democracy may be bringing new opportunities and economic change, which may increase inequality, while simultaneously lowering barriers to entry and investing in public goods, which may reduce inequality, and the net result could be either an increase or decrease in inequality, despite the increased taxation documented in Tables 21.2 and 21.3. This reasoning, as well as the theoretical ideas discussed in Section 21.2, underscores the importance of investigating the heterogeneous effects of democracy on inequality, a topic we turn to next.
21.5.4 Investigating the Mechanisms: Heterogeneity
We now turn to heterogeneity in the effect of democracy on inequality. We first consider the effect of democracy interacted with the land Gini, which we take to be a measure of landed elite power, to test the “capture” channel discussed above. We show only effects on net and gross Gini for most of the interactions to save space, and then discuss the heterogeneous effects on tax to GDP and government revenue to GDP ratios in the text.
Table 21.11 shows a positive and generally significant interaction of democracy with land inequality, suggesting that the power of landed elites to capture the state or thwart any redistributive tendencies of democratization results in higher inequality. The magnitudes are sizable, suggesting that a democratization in, say, Myanmar, with the highest land Gini (=77 in a 0- to 100-scale) among nondemocracies in our sample, would increase the after-tax Gini by approximately 0.72-2.42 points and the pretax Gini by 0.2-1.6 points. Our results suggest that democracy may increase inequality in societies with strong landed elites. This could be the case if democracy creates inequality increasing market opportunities while the elite manages to reduce taxation through de facto channels. An alternative explanation is given in Acemoglu and Robinson (2008), where a transition to democracy can lead to more pro-elite policies. The intuition for this somewhat paradoxical result is that the elite invests more in de facto power under democracy because, besides the benefits of being able to impose their favorite economic institutions, investments in de facto power increase the likelihood of a transition to autocracy.
The difference between the net and gross measures may reflect the importance of nonfiscal channels. Consistent with this, we see only moderate attenuation of the effect of democracy on the tax to GDP ratio, and no significant heterogeneity on the government revenue to GDP ratio (omitted to save space). For example, the equalizing effects of lowering barriers to mobility out of the agricultural sector may only be seen in societies
Event study figures analogous to Figures 21.2, 21.4, and 21.5 reveal no pre-trends for these variables and an increase after the democratization, but are not included to save space.
Table 2111 Effects of Hemncratizatinn on inequality (Includes interaction of democracy with land Gini (averaged over all years with available data))
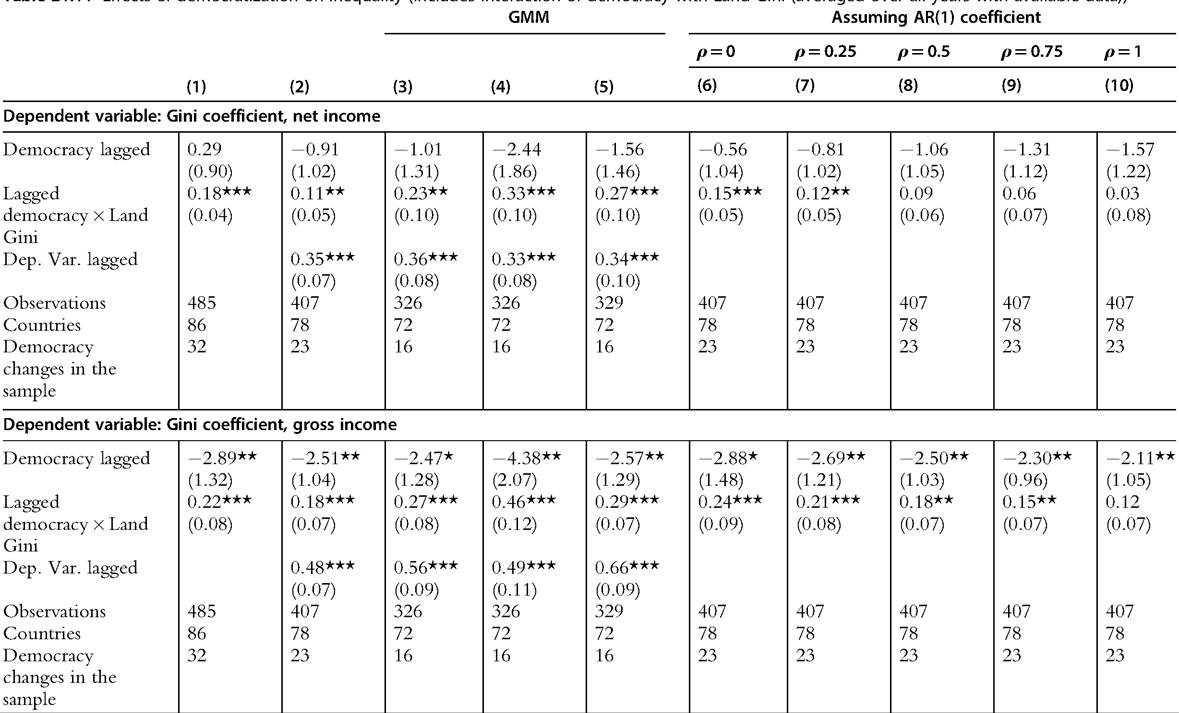
Note: OLS estimates (Columns 1—2) include a full set of country and year fixed effects. Arellano and Bond's GMM estimators of the dynamic panel model (Columns 3—4) remove country fixed effects by taking first differences ofthe data, orby takingforward orthogonal differences (Column 5) and then constructingmoment conditions usingpredeterminedlags of the dependent variable, the interaction term and democracy. Columns 4 and 5 use up to the fifth lag ofpredetermined variables to create moments, restricting the number ofmoments used. Columns 6—10 impose different values for the autocorrelation coefficient in the tax to GDP series, and estimate the effect ofdemocracy andthe interaction term including a full set of country andyear fixed effects. All models control for lagged GDP per capita but this coefficient is not reported to save space. Robust standard errors, adjusted for clustering at the country level, are in parentheses. ***: significant at 1%; **: significant at 5%; *: significant at 10%.
with politically weak agricultural elites. Although land inequality is potentially correlated with many other economic and social factors that may also mediate the effect of democracy on inequality, we view this as some evidence of the “capture” channel modeled above.
We next consider the effect of democracy depending on the extent of structural transformation, motivated by our hypothesis that democracy induces structural change and may increase inequality by expanding opportunities, such as skilled occupations and entrepreneurship, for previously excluded groups.
Table 21.12 shows the effect of democratization interacted with the share of nonagricultural employment in 1968 as a measure of the extent of structural transformation (results are similar with the 1978 share). We find that democratization increases inequality more (or fails to reduce inequality) in places that have smaller agricultural employment shares. This is consistent with democracy expanding access to inequality-increasing market opportunities especially in more urban societies where skilled occupations and entrepreneurship are potentially more important. The magnitudes suggest that democratization in a country that was 10% points less agricultural than the mean in 1968 (measured by the percentage of nonagricultural employment), will bring an increase between 1 and 1.6 net Gini points (1.3 and 2.3 gross Gini points) relative to the average effect in the short run, and between 1.6 and 2.2 net Gini points (2.5 and 5.6 gross Gini points) in the long run. We have also estimated these specifications using our other proxies for structural transformation and obtained uniformly positive, although often imprecise, coefficients on the interaction variables. The results using the gross Gini coefficient show a similar pattern and similar, though slightly larger, estimates.
While we do not show these results for space reasons, there is no significant heterogeneity by nonagricultural employment in the effect of democracy on taxation, and this result is robust to all proxies for the extent of structural transformation we have tried, including the 1970 values of urbanization, education, and nonagricultural share of GDP. This suggests that the mechanisms via which democracy increases inequality in relatively more economically modernized countries has less to do with lowering government redistribution or public good provision, and more to do with other mechanisms emphasized in our discussion of disequalizing market opportunities opened up by democracy for entrepreneurs, educated workers, and capitalists.
Table 21.13 looks further at heterogeneity by the level of potential inequality created by market opportunities. We interact democratization in year t with the top 10% share of income in the United States in the same year. This is a proxy (albeit a highly imprecise and imperfect one) for the extent of inequality increasing market opportunities available at the time and their potential to create inequality, shaped by world-level forces such as globalization, technological and organizational changes that either originate or find widespread adoption in the United States (Panitch and Gindin, 2012). We did not find significant interaction effects of this sort on the tax to GDP ratio or the government revenue
Table 21.12 Effects of democratization on inequality (Includes interaction of democracy with the Dercentaoe of nonaαricultural Dooulation in 1968)
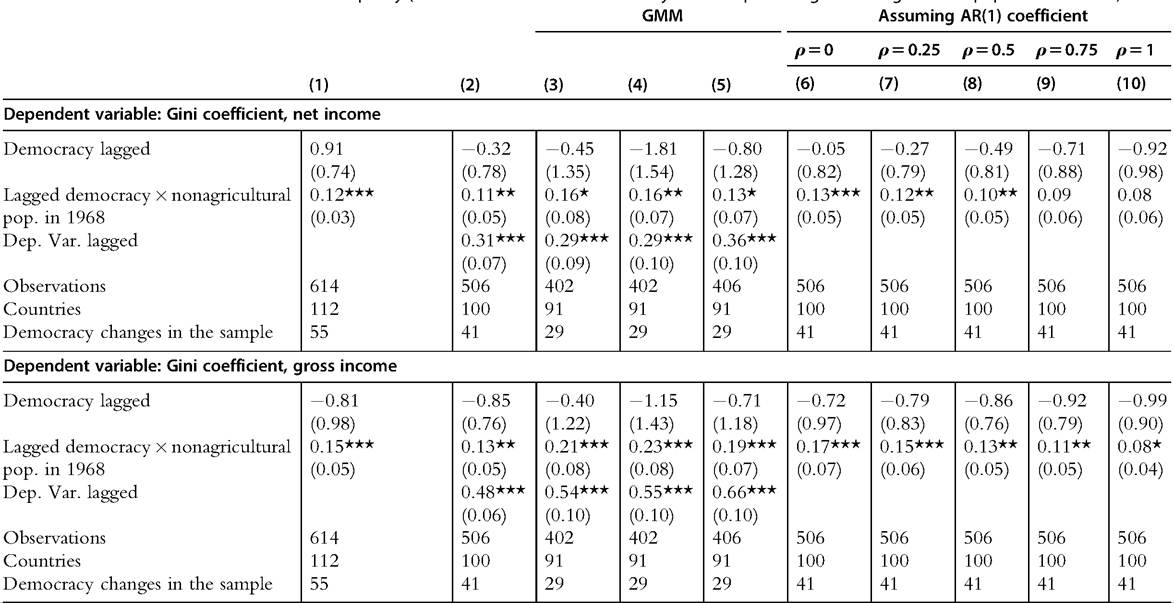
Note: OLS estimates (Columns 1—2) include afullset Ofcountryandyearfixed effects. Arellano andBond's GMM estimators ofthe dynamicpanelmodel (Columns 3—4) remove country fixed effects by taking first differences of the data, or by taking forward orthogonal differences (Column 5) and then constructing moment conditions using predetermined lags of the dependent variable, the interaction term and democracy. Columns 4 and 5 use up to the fifth lag ofpredetermined variables to create moments, restricting the number ofmoments used. Columns 6—10 impose different values for the autocorrelation coefficient in the tax to GDP series, and estimate the effect ofdemocracy and the interaction term including a full set ofcountry andyear fixed effects. All models control for lagged GDP per capita but this coefficient is not reported to save space. Robust standard errors, adjusted for clustering at the country level, are in parentheses. ***: significant at 1%; **: significant at 5%; *: significant at 10%.
Table 21.13 Effects of democratization on inequality (Includes interaction of democracy with share of income held by the top 10 decile in the United States
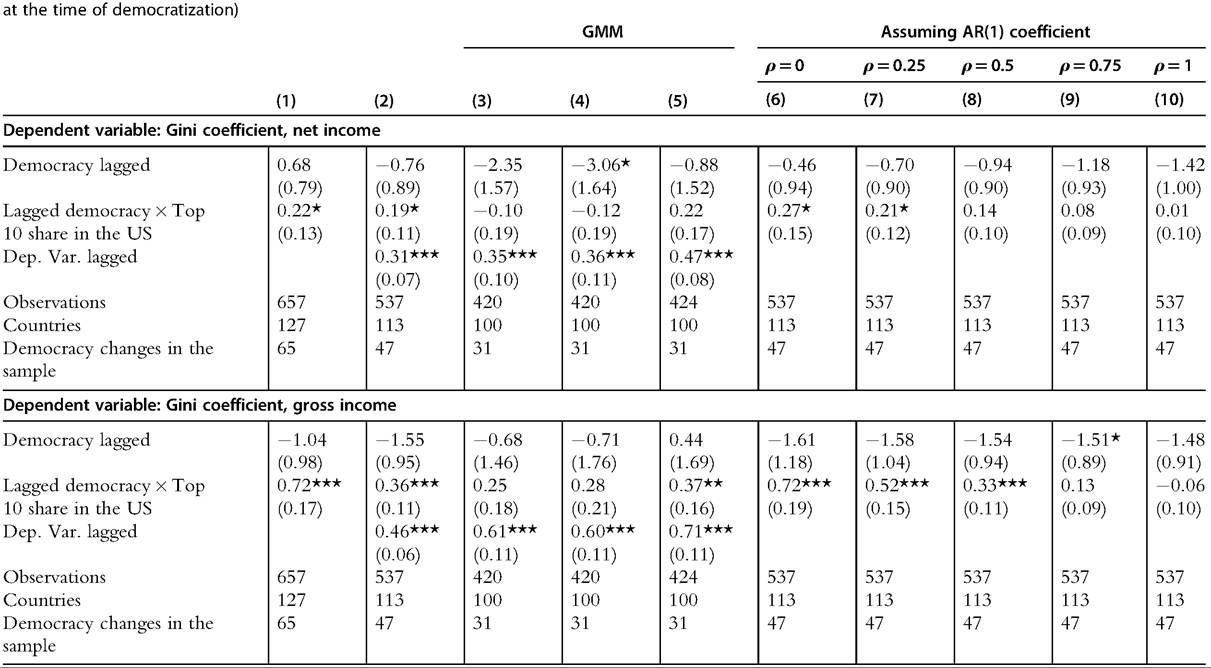
Note: OLS estimates (Columns 1—2) include a full set of country and year fixed effects. Arellano and Bond's GMM estimators of the dynamic panel model (Columns 3—4) remove country fixed effects by takingfirst differences ofthe data, orby takingforwardorthogonal differences (Column 5) and then constructing moment conditions usingpredeterminedlags ofthe dependent variable, the interaction term and democracy. Columns 4 and 5 use up to the fifth lag ofpredetermined variables to create moments, restricting the number ofmoments used. Columns 6—10 impose different values for the autocorrelation coefficient in the tax to GDP series, and estimate the effect of democracy and the interaction term including a full set of country and year fixed effects. All models control for lagged GDP per capita but this coefficient is not reported to save space. Robust standard errors, adjusted for clustering at the country level, are in parentheses. ***: significant at 1%; **: significant at 5%; *: significant at 10%.
to GDP ratio. However, we do see generally significant impact of this interaction on the gross Gini, which appears to be further increased by democracy when there is greater inequality in the United States. There is also a similar effect on the net Gini but is much weaker and not present when using the GMM estimators. Though on the whole this evidence is on the weak side, it is broadly consistent with a story in which democratization increases inequality at times when the expanded market opportunities available are more disequalizing.
Finally, Tables 21.14—21.17 provide some preliminary evidence on Director’s law. Recall from our discussion in Section 21.2, in particular Proposition 5, that our (modified) Director’s law implies that the negative effect of democracy on inequality should be visible or greater in places where the rich have a large share of income (Meltzer-Richards also predicts this) and, more uniquely, should be positive where the poor have a higher share of income (which is the opposite of the Meltzer-Richards prediction). Thus, we investigate the heterogeneous effect of democracy depending on the shares of the top and bottom of the income distribution (in each case relative to the share of the middle, i.e., using the top and bottom income shares described above). Recall also that the effect of the income share of the rich on inequality in democracy is related to whether there is capture of democracy by the elite, which provides a reason why this prediction of Proposition 5 may not hold even when a greater share of income of the poor may increase inequality as posited in Proposition 5.
Indeed, Table 21.14 shows that when the top decile is richer relative to the middle, there is no significantly heterogeneous effect on inequality, although coefficients are generally negative. This might be because this estimate is picking up both an elite capture effect (as in the land Gini interaction specifications) as well as additional demand for redistribution by the median voter as in our (modified) Director’s law, with higher incidence on the rich. Table 21.15 provides support for the possibility that top tail inequality, as measured by the top share, could be picking up elite capture effects. It shows that the effect of democracy on the tax to GDP ratio is significantly attenuated by income inequality as measured by the top share (but there is no effect on government revenue as a fraction of GDP), contrary to what Meltzer and Richards model or our (modified) Director’s law would predict. Our conclusion from this exercise is that our research design does not allow us to separate the effects of democracy through the demand for redistribution and the incidence of taxation emphasized in our modified Director’s law from the possibility that democracies with large upper tail inequality are more likely to be captured by the wealthier elite.
Tables 21.16 and 21.17, on the other hand, provide support for the more unique prediction of the (modified) Director’s law, that democracy should increase inequality more when the poor are closer to the middle class in nondemocracy. Table 21.16 looks at the interaction of the bottom income share with democracy, and finds that the net Gini does in fact increase with democratization, while there is no effect on the gross Gini. This
Table 21.14 Effects Ofdemocratization on inequality (Includes interaction of democracy with the average share of income held by the top decile relative to share of mid 50th earners before 2000)
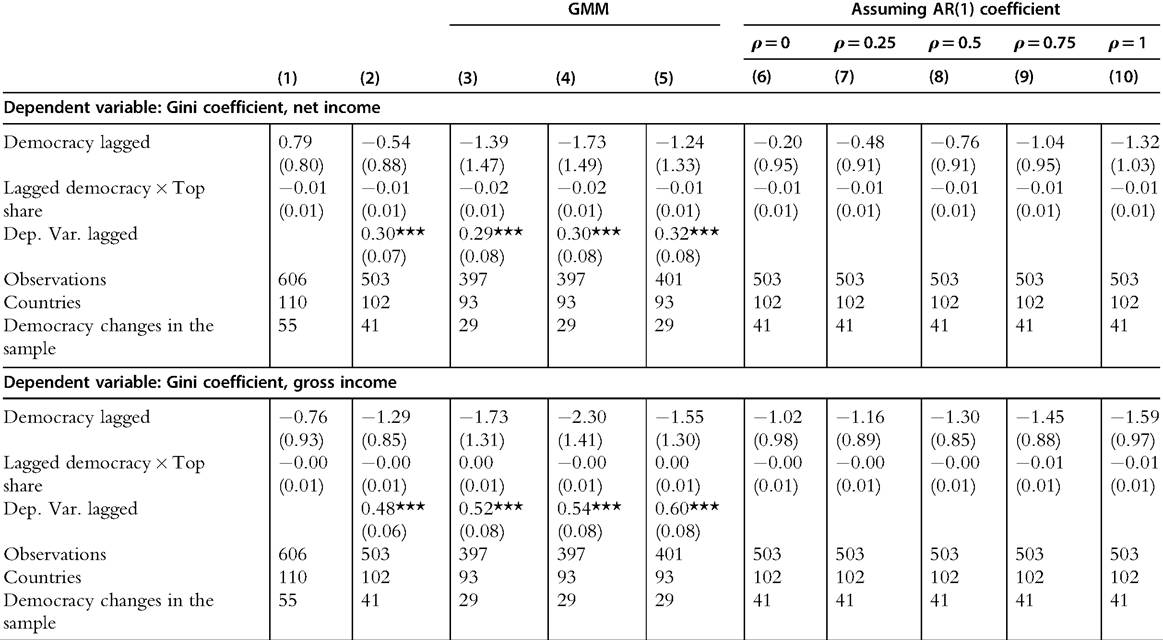
Note: OLS estimates (Columns 1—2) include a full set of country and year fixed effects. Arellano and Bond's GMM estimators of the dynamic panel model (Columns 3—4) remove country fixed effects by taking first differences of the data, or by taking forward orthogonal differences (Column 5) and then constructing moment conditions using predetermined lags of the dependent variable, the interaction term and democracy. Columns 4 and 5 use up to the fifth lag of predetermined variables to create moments, restricting the number of moments used. Columns 6—10 impose different values for the autocorrelation coefficient in the tax to GDP series, and estimate the effectofdemocracy andthe interaction term includingafull set ofcountry andyearfixed effects. Allmodels control forlagged GDP per capitabut this coefficient is not reportedto save space. Robust standard errors, adjustedfor clusteringat the country level, are in parentheses. ***: significant at 1%; **: significant at 5%; *: significant at 10%.
Table 21.15 Effects Ofdemocratization on the log of tax and total government revenue as a percentage of GDP (Includes interaction Ofdemocracywith the average share of income held by the top decile relative to share of mid 50th earners before 2000)
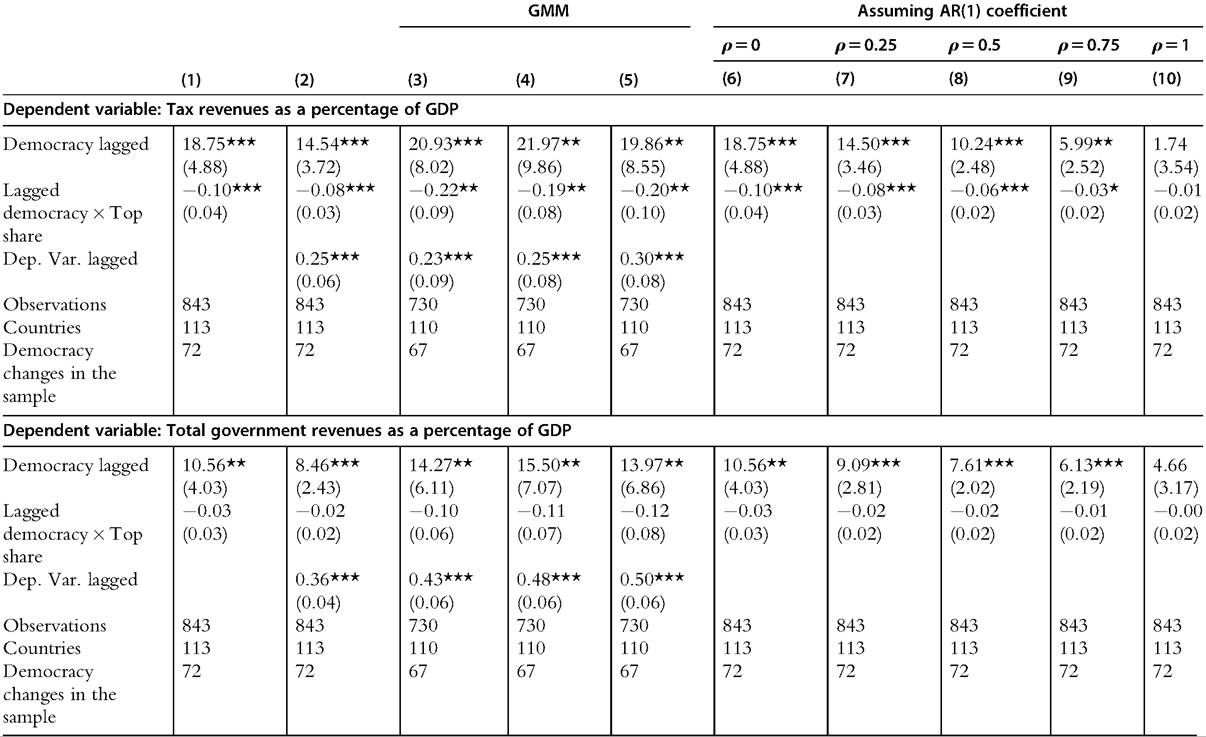
Note: OLS estimates (Columns 1—2) include a full set of country and year fixed effects. Arellano and Bond's GMM estimators of the dynamic panel model (Columns 3—4) remove country fixed effects by taking first differences ofthe data, orby taking forward orthogonal differences (Column 5) and then constructing moment conditions usingpredeterminedlags ofthe dependent variable, the interaction term and democracy. Columns 4 and 5 use up to the fifth lag of predetermined variables to create moments, restricting the number of moments used. Columns 6—10 impose different values for the autocorrelation coefficient in the tax to GDP series, and estimate the effect of democracy and the interaction term including a full set of country and year fixed effects. All models control for lagged GDP per capita but this coefficient is not reported to save space. Robust standard errors, adjusted for clustering at the country level, are in parentheses. ***: significant at 1%; **: significant at 5%; *: significant at 10%.
Table 21.16 Effects Ofdemocratization on inequality (Includes interaction of democracy with the average share of income held by the bottom decile relative to share of mid 50th earners before 2000)
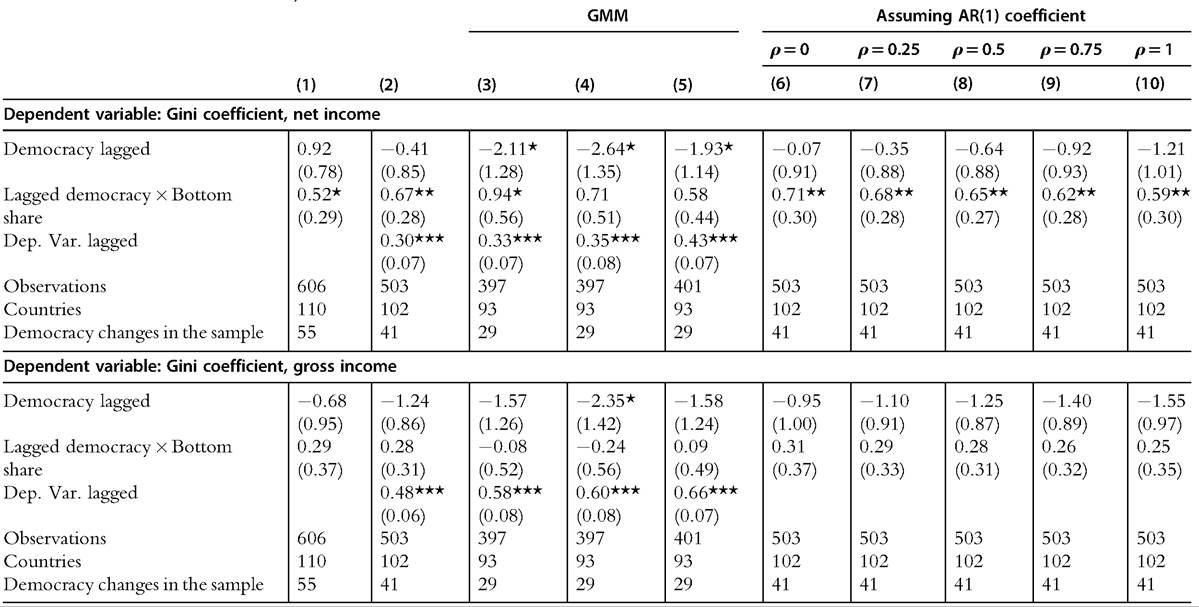
Note: OLS estimates (Columns 1—2) include a full set of country and year fixed effects. Arellano and Bond's GMM estimators of the dynamic panel model (Columns 3—4) remove country fixed effects by taking first differences of the data, or by taking forward orthogonal differences (Column 5) and then constructing moment conditions using predetermined lags of the dependent variable, the interaction term and democracy. Columns 4 and 5 use up to the fifth lag of predetermined variables to create moments, restricting the number of moments used. Columns 6—10 impose different values for the autocorrelation coefficient in the tax to GDP series, and estimate the effect of democracy and the interaction term including a full set of country and year fixed effects. All models control for lagged GDP per capita but this coefficient is not reported to save space. Robust standard errors, adjusted for clustering at the country level, are in parentheses. ***: significant at 1%; **: significant at 5%; *: significant at 10%.
Table 21.17 Effects of democratization on the log of tax and total government revenue as a percentage of GDP (Includes interaction of democracy with the average share of income held by the bottom decile relative to share of mid 50th earners before 2000)
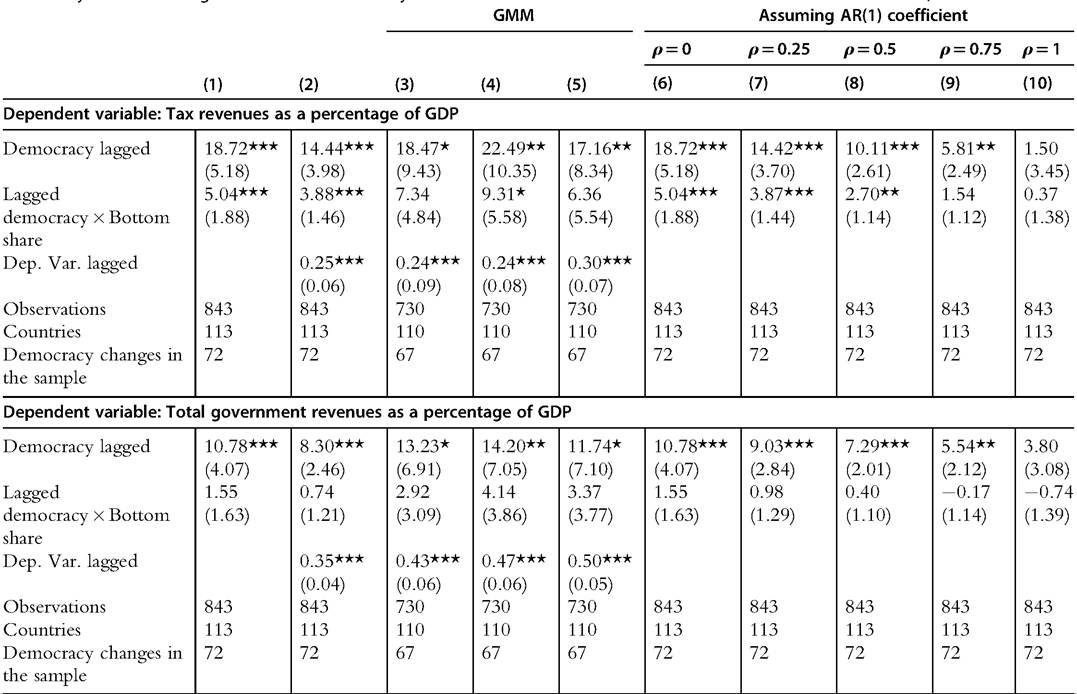
Note: OLS estimates (Columns 1—2) include a full set of country and year fixed effects. Arellano and Bond's GMM estimators ofthe dynamic panel model (Columns 3—4) remove country fixed effects by taking first differences ofthe data, or by taking forward orthogonal differences (Column 5) and then constructing moment conditions using predetermined lags of the dependent variable, the interaction term and democracy. Columns 4 and 5 use up to the fifth lag of predetermined variables to create moments, restricting the number ofmoments used. Columns 6—10 impose different values for the autocorrelation coefficient in the tax to GDP series, and estimate the effect of democracy and the interaction term includingafullset ofcountry andyear fixed effects. Allmodels controlfor lagged GDP per capita but this coefficient is not reported to save space. Robust standard errors, adjusted for clustering at the country level, are in parentheses. ***: significant at 1%; **: significant at 5%; *: significant at 10%.
relative difference between the pre-fiscal and post-fiscal effects suggests that government redistribution may be (part of) the mechanism. Table 21.17 confirms this by showing that the tax to GDP ratio does go up following a democratization in a society where the poor are initially relatively well-off compared to the middle class.
Subject to the major caveats about omitted variables and measurement error, this evidence thus provides some support to our (modified) Director’s law: middle classes empowered by democracy appear to be able to use the government to transfer resources from the poor to themselves, increasing post-fiscal inequality. As far as we know, this is the first evidence of this kind on how democracy might redistribute in a way that increases inequality.
We have investigated a number of other sources of heterogeneity, including various measures of ethnolinguistic fragmentation, wheat-sugar land suitability ratio (as a measure of the type of agriculture), constitutional provisions against redistribution, and average level of social unrest, and found no robust results.
Overall, the important concerns about endogeneity and measurement error notwithstanding, the results presented in this section paint a picture in which democracy does indeed create greater pressures for redistribution, but the pathways via which these affect inequality are more nuanced than the standard Meltzer-Richard mechanism presumes. In particular, the correlation between democracy and inequality appears to be more limited than one might have at first expected (and more limited than the effect on taxes). On the other hand, the evidence on heterogeneity of effects, even if not as robustly estimated as the impact on taxes, indicates that interactions with elite capture, structural transformation, middle-class bias in redistribution, and the disequalizing market opportunities opened up by democracy might be playing some role in modulating the influence of democracy on inequality.
21.6.
More on the topic MAIN RESULTS:
- Contents
- Model variations and sensivity analysis
- UUBI (UNIVERSAL ULTRA BASIC INCOME)
- Normative Foundations
- BACKGROUND AND DEFINITIONS
- REVIEW OF FORENSIC ASSESSMENT INSTRUMENTS
- Cossack Tatar Fighters
- AVIAN CHOLERA
- North Korea: the last Stalinist state
- Oman