NETWORK EFFECTS AND ICT EXTERNALITIES
The traditional approach to accounting for the contribution of ICT to economic growth follows neoclassical economic theory, which makes clear predictions about the magnitude of the impact of a change in an input on output: if markets are competitive and returns are constant, the impact of 1 percentage point change in an input is the input’s share of income generated by all productive inputs.
Factor income shares are relatively easy to measure compared with an approach that determines impacts via econometric estimation of a production function, and the non-parametric nature of neoclassical SOG analysis is one of the major reasons why it is such a powerful tool.6.4.1 Externalities and Productivity
The traditional approach does not consider, indeed it cannot completely identify, network effects as part of the contribution of ICT capital to growth. The potential importance of network effects is most clearly explained by Metcalfe’s Law that states that the value of a network increases with the square of the number of users of the network and implies that stocks of ICT capital within a sector or country are disproportionately beneficial to growth as the number of users expands (for a given quantity of capital).15 The extra kick, the disproportionate benefit that accrues as additional users join a network, is commonly referred to as network externalities in economics, and micro-, industry and cross-country studies have confirmed the presence of these externalities in productivity.16 In growth analysis terms, the externalities might be called returns to scale, but that does not connote as clearly that we are dealing with a property of a network or a system, not a firm’s production function.
A recent study took direct aim at analyzing and quantifying the macroeconomic impact of network effects due to increased use of the Internet and wireless networks within a traditional SOG framework (Corrado, 2011).
Corrado’s results stemmed from working through the ways in which network effects might be expected to leave their footprints in an SOG analysis. Table 6.2 shows the main elements of this analysis.The establishment of a network has certain phases for which Metcalfe’s Law is a good shorthand.17 The first is a build-out phase characterized by high investment and capacity building, followed by a take-up phase, during which utilization of the installed capacity rises and returns to scale accrue. And because investments in communication capital create networks inextricably linked to computing, Internet, and wireless technologies,
Table 6.2 Internet and wireless networks in SOG empirics
| Process | Description (Metcalfe’s Law) | Where to Find? | |
| 1. | Network build-out | High investment and capacity | Communication capital |
| 2. | Network take-up | Utilization of installed capacity | Communication capital |
| rises | contribution | ||
| 3. | Network Externalities | a. Returns to scale | TFP |
| b. Innovative adaptations | TFP | ||
| (Internet and wireless) | |||
Source: Corrado (2011).
the capital embodies the general purpose nature of these technologies. General purpose technologies (or GPTs) have characteristics such as high fixed costs, low reproduction costs, and a ready ability to be adapted to new uses (Bresnahan and Trajtenberg, 1995).
Communication capital thus has the ability to generate high marginal returns when widely dispersed, usage rises, and innovation adaptation occurs. The synergy between the GPT nature of network technology and the scale effects of Metcalfe’s Law suggest communication capital has significant potential for creating network externalities. In SOG analysis, the direct effects of the establishment of a network are attributed to capital formation and capital’s contribution, including ICT capital’s contribution, and if the spread of high-speed networking and wireless communication through the wider economy creates network externalities via returns to scale, the conventional framework will attribute them to TFP, not capital. Excess net returns to new uses of existing networks - innovative adaptations - are pure TFP.18
Although the events depicted in Table 6.2 do not evolve in strict sequence in real time (i.e., capacity is always being added to networks), the perspective offered by the explicit modeling of network effects leads naturally to a reconsideration of the underlying forces behind the ICT investment boom in the 1990s. Because Internet and wireless communication technologies obtain economic value from complementary investments in ICT, much of the increase in these investments can arguably be attributed to the expansion of networks and the possibilities they created for competitive advantage (Greenstein, 2000; Forman et al., 2003a), that is, that the demand for Internet access was the primary driving force behind the ICT investment boom of the late 1990s.19 Once that boom concluded, and as Internet and wireless use continued to rise, the utilization of capital associated with Internet and wireless networks (mostly ICT capital) rose sharply even though the capital stock did not. Although some of the impact of the pure rise in usage was captured in capital’s contribution through a higher income share, the network externalities and innovative adaptation effects appeared as increased TFP in the 2000s.20
To estimate network effects as set out in Table 6.2, it seems reasonable to begin by defining and measuring communication capital.
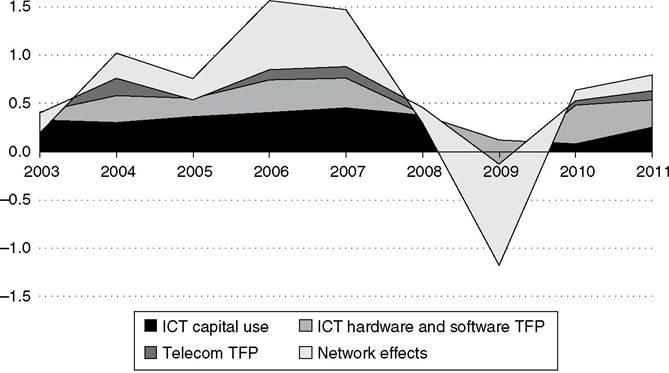
One might take communication capital to be the ‘C’ in ICT capital (where, note, ‘C’ should include wireless spectrum assets), and then one might consider, in addition, all other types of capital deployed in communications and Internet services firms, that is, their server farms, network management software, public transmission lines, etc.). Finally, one might also consider how well non-ICT producers were poised to use the Internet for competitive advantage, say, by having installed advanced software typically used to enhance internal and customer-facing business processes. Corrado (2011) directly measured the first two types of communication capital for the USA, using new quality-adjusted deflators for communications equipment capital (discussed previously), and included wireless spectrum in investment. She was also able to exploit industry-level differences in the end purpose of the installed software base (e.g., email vs business process enhancement) using measures developed in Forman et al. (2003b). All told, Corrado concluded that, in addition to the direct contribution of communication capital, more than half of the 1.0 percentage point acceleration in total factor productivity growth estimated by the Bureau of Labor Statistics for the nonICT business sector from 2000 to 2005 (relative to 1995 to 2000) could be explained by network externalities.A related study covering the market sector of eight EU countries developed estimates of network effects in SOG percentage point terms for each of the items in Table 6.2 (Corrado and Jager, 2014); the estimates, which are contributions to real value-added growth in the market sector of these economies, are plotted in Figure 6.7. The contributions due to ICT use and TFP are growth accounting estimates consistent with the figures shown in Table 6.1. The contributions of network externalities are based on an econometric analysis that attributed a portion of TFP to (1) returns-to-scale effects from more intensive use of communication capital throughout an economy and to (2) effects due to innovative adaptations, proxied by spillovers from IT stocks at the industry level; the sum of these
Percentage points, market sector
real GVA growth, 8 EU countries
2.0.........................................................................................................................................................
Source: Corrado and Jager (2014).
Figure 6.7 Contributions of network effects to real GVA growth, 2003-11
two effects are what is plotted on the figure. The econometric analysis covered the years 2003 to 2011, when network effects associated with take-up were most likely in play.
The estimated contribution of network externalities to TFP in these 8 EU economies is rather large prior to the onset of the global financial crisis and European sovereign debt crises. Although not apparent from Table 6.1, the market sector of these economies was growing rapidly during these years, especially during 2006 and 2007; rapid increases in network usage accompanied this growth, and so did the estimated contribution of network effects to that growth. But as usage pulled back sharply in 2008 and 2009, the normally welfare-enhancing impacts of networks effects reversed sign. The estimated innovative adaptions effect remained a small positive (IT stocks did not decline) but was insufficient to offset the negative drag from the usage effect.
All told, the Internet - more precisely, the demand for connectivity and the externalities that accompany the spread of connectivity - offers a consistent story for how ICT capital contributed to economic growth and productivity from the 1990s through much of the 2000s. Even if the first-order externalities due to pure usage spread are tapering off in economies such as Europe and the USA, Figure 6.6(b) suggests there is a long way to go in many other areas of the world.
6.4.2 Externalities and Complementarities
If communication capital, the Internet, and Internet markets play a special role in productivity change via externalities, what about computers and computing technology (or IT) per se? And what about complementarity between ICT capital and intangible capital?
Given the vast number of studies that have looked at the special role of ICT capital in growth and productivity change, it is worth reminding readers that the search for externalities to ICT in country- and industry-level growth accounts data usually depends on whether above-average TFP growth is experienced by countries or industries with aboveaverage ICT intensities and/or growth contributions from ICT capital.
On balance, the literature that uses such datasets fails to uncover externalities to ICT, with the exception of studies that look at telecom capital and/or broadband alone, discussed in the previous section.21Our earlier discussion commented on the recent and projected increases in adoption of cloud services, which suggests future industry-level ICT research will need to factor purchased ICT services into the usual analysis, but this consideration does not necessarily apply to the corpus of previous work. Evidence developed from firm- and plant-level data suggests that IT use per se plays a very important role explaining productivity differences across firms, suggesting the underlying productivity-enhancing IT mechanism operates powerfully within industries. For example, Syverson (2011) notes that Bartelsman et al. (2010) develop the notion that IT shifts the mean and the variance of the distribution of innovation outcomes and that Faggio et al. (2010) find the greatest increase in productivity dispersion occurs in industries with the largest growth in IT capital intensity.
Two other key takeaways from microeconomic studies of productivity change are that: (1) the link from firm-level IT adoption to productivity growth is complex, requiring co-investments in training and organizational change (Brynjolfsson and Hitt, 2000; Black and Lynch, 2001; Caroli and Van Reenen, 2001), and (2) human resource and management practices play an important role in explaining productivity differences across firms (Ichniowski and Shaw, 2003; Bloom and Van Reenen, 2007, 2010). Interestingly, these effects surface in industry-level growth accounting datasets augmented to include intangible capital following Corrado et al. (2005, 2009). The availability of macroeconomic data for a wide range of countries, including the availability of sector and industry estimates for a subset of countries, for example, at www.INTAN- Invest.net, is a relatively recent development.22
Studies exploiting intangible capital-augmented datasets have found (1) complementarity between ICT and intangible capital in production for eight market sub-sectors (Chen et al., 2014; Corrado et al., 2015), and (2) sizable spillovers from private investments in non-R&D intangible capital to market sector TFP growth at the country level (Corrado et al., 2014).23 By asset type, the complementarity is with design, firm-specific training, and organizational structure, suggesting several possible indirect channels through which private IT investments augment the productivity performance of countries.24 A complementary relationship between R&D capital and other intangible investments also is found (albeit a weak one), as are spillovers from private investments in R&D to market sector TFP growth at the country level. A large literature has of course documented productivity spillovers from the conduct of R&D at firm, industry, and country levels. All told, excluding network effects, the evidence-based indirect links among these three types of knowledge capital - IT, non-R&D intangibles, and R&D - and TFP at the industry and country level are sketched in Figure 6.8.
The exploration of non-R&D intangible knowledge flows is still in its infancy, but at some point in the near future improved and more detailed data may yield more refined
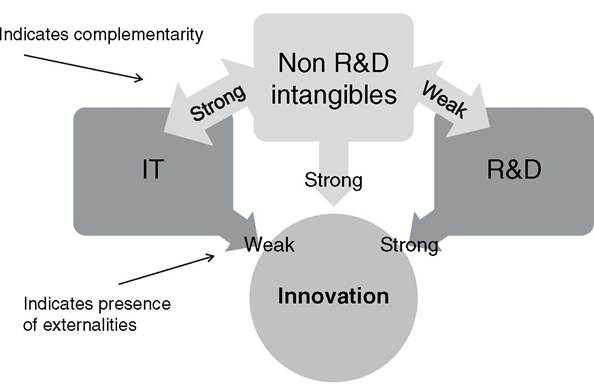
Note: IT includes software. Network effects are excluded.
Source: Adapted from Corrado et al. (2015).
Figure 6.8 Indirect links between knowledge capital types and TFP: evidence on externalities/spillovers and complementarities in country and industry-level studies
and/or richer specifications of IT spillovers and IT/intangible capital complementarities, in which case a clearer and more definitive picture of indirect impact of IT capital on productivity change may emerge.
6.4.3 Summary
All told, we conclude that (1) spillovers from increases in communication capital to TFP growth due to network effects are well documented in the literature, (2) recent estimates of the impacts in Europe and the USA are sizable, yet (3) the literature on the whole has not estimated these impacts with much precision (Holt and Jamison, 2009). The presence of network effects could be attributed in an economic sense to the spread of the use of ICT, in which case it is a form of spillover in one of the senses that the word has been used in the literature (see Cardona et al., 2013 for a discussion). When thinking about the Internet and productivity, however, it seems more appropriate to call these effects network externalities. Addressing how these effects can be modeled and estimated in ways that summarize their contribution to economic growth is the most direct and straightforward way to complete the picture of the Internet and productivity.
We also argued here that the same scale efficiencies that generated spillovers from telecom capital in the age of the telephone (Roller and Waverman, 2001) likely drove the sizable spillovers estimated for the period during which the Internet and wireless networks reached large fractions of the population of advanced countries (Corrado, 2011; Corrado and Jager, 2014). That the same mechanisms may repeat again with the spread of a new wave of ICT services delivered via high-speed communication systems does not seem especially far-fetched. In any event, the use of ICT services for competitive advantage will in all likelihood continue to require co-investments in organizational change and human resource and management practices.
6.5