THE INTERNET, ICT AND PRODUCTIVITY
Productivity measures the output produced by companies, sectors, and countries relative to the inputs required to produce that output. It therefore provides a simple but powerful indicator of economic efficiency and innovation.
For the economy as a whole, labor productivity (or output per hour) is the most widely used metric. Labor productivity is related to measures of living standards such as per capita income, but labor productivity alone cannot distinguish between gains from more capital per worker versus gains from innovation. An SOG decomposition does just that, however. It computes increases in capital per worker (movements along a production frontier) and derives as a residual change in total factor productivity (shifts of a production frontier) the famous ‘Solow residual’ of growth accounting.By reflecting the combined efficiency of labor and capital inputs relative to the growth in gross domestic product (GDP), total factor productivity (TFP) is a widely accepted metric for assessing the net effects of innovative activity within a country, sector, or firm.1 In practice, the measurement of different types of labor and capital inputs allows for the identification of productivity change due to composition shifts to higher-performing types. But even so, much is not captured by the conventional decomposition: the impact of unmeasured inputs, such as intangible capital; the influence of imperfect competition, increasing returns to scale, and knowledge spillovers.
Many issues stand at the intersection of these caveats to growth accounting and determining the impact of the Internet on economic growth, issues that are an active area of research: ICT capital and uncounted intangible capital as complementary assets (Brynjolfsson et al., 2002; Basu et al., 2004); network effects and Internet externalities as drivers of measured productivity change (Corrado, 2011); and ICT spillovers, for example, due to open-source Internet software (Greenstein and Nagle, 2014), as potentially large contributors to TFP growth, to name a few.
We first report and analyze SOG results based on the traditional approach, then consider measurement issues and relevance of the above-mentioned indirect channels.
6.3.1 ICT and Productivity in the EU and USA
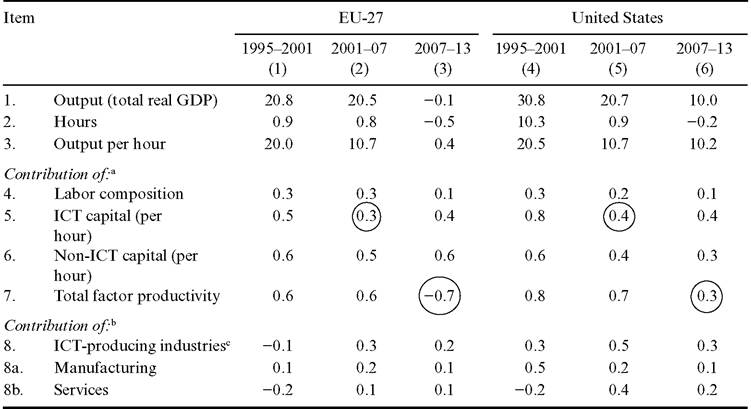
Table 6.1 reports estimates of productivity for the EU-27 and USA from 1995 to 2013.2 Looking first at the pre-crisis results for the USA and comparing the late 1990s (column 4) with the 2000s (column 5), we see that output and output per hour growth (rows 1 and 3) decelerated rather sharply between these two periods. The main supply-side culprit behind this drop off is a slowdown in the rate at which US workers were equipped with capital, especially ICT capital (the circled item in row 5). Turning to the EU-27, Europe’s output and output per hour growth was not as robust as activity in the USA in the late 1990s, and Europe’s economic activity did not slow so much in the early 2000s relative to the late 1990s.
On balance, the portrait of European growth and its sources was rather similar to the USA during the early 2000s. In both Europe and the USA, a slowing rate of ICT capital deepening (the circled items in row 5) detracted from growth in output per hour during the 2000s, whereas growth of total factor productivity (row 7), a proxy for the net economic impact of innovative activity, remained brisk - contributing more than 0.5 percentage points per year, on average, to growth in Europe and 0.75 percentage
Table 6.1 Productivity growth, 1995 to 2013
Notes:
Rows 1-3 are average annual rates of growth (percent). Rows 4-7 are percentage points.
a. Contributions in rows 4-7 are to growth in output per hour.
b. Contributions in row 8 are to growth in total factor productivity.
c. Rows 7 and 8 are not strictly comparable. EU contributions in row 8 are based on eight countries (Austria, Finland, France, Germany, Italy, Netherlands, Spain, and United Kingdom), and are derived from different sources.
Also, the estimates in row 8 for the last period are to 2011 for Europe (column 3) and to 2012 for the United States (column 6).Sources: Lines 1-7, The Conference Board Total Economy Database, January 2014. Line 8, columns 1-3, EUKLEMS as extended in Corrado and Jager (2014); columns 4-6, Rosenthal et al. (2014) with backcasts by authors using EUKLEMS.
points per year in the USA - from 1995 to 2007. ICT-producing industries accounted for a large fraction of the gains in the 2000s (row 8, columns 2 and 5).
The picture of productivity growth and its sources, especially the measured contribution of innovative activity, changed greatly after the onset of the global financial crisis. In the USA (column 6), growth in output per hour slowed to essentially the rate that prevailed during the much-discussed extended period of slow productivity growth from 1972 to 1995 (1.3 percent per year), well below its very long-term trend of about 2 percent per year (Gordon, 2014a). Europe’s economic performance since 2007 has been utterly dismal (column 3). The main villain among Europe’s post-2007 growth detractors is total factor productivity, which fell a whopping 0.75 percent per year, whereas TFP growth remained positive in the United States (the circled items in row 7). As discussed in more detail in Van Ark (2014a, 2014b), virtually no European economy exhibited positive TFP growth during this period.
As argued more fully below, one channel whereby Internet technology affects economic growth is TFP in ICT services-producing industries - and in this regard, the most interesting row in Table 6.1 is row 8b. Innovation in ICT service-producing industries contributed more than half of the gains estimated for the total economy of the USA from 2001 to 2013. And for eight EU countries where we have industry-level productivity estimates, albeit only to 2011, ICT producers also contributed positive changes to aggregate TFP, on average, during the early crisis period - all the more remarkable when one considers that, in these same countries, the contribution of all market services industries was the major drag on market sector TFP change and economic growth (Van Ark, 2014b).
Many analysts believe that the recent weak EU and US productivity performance - and the lack of resilience of these economies to shocks incurred - stems from structural factors and poor policy response rather than a result of EU and US innovation mechanisms suddenly grinding to a halt. Still, there is much concern, for example, over the low rate of new business formation and lack of financing opportunities for small and medium-size enterprises. While innovative activity is generally thought to emanate from ecosystems with certain dynamics of their own, most observers agree that innovative activity depends on a healthy business environment to be self-sustaining (Jackson, 2011). At the risk over-simplification, then, one could say that what separates the growth pessimists such as Robert Gordon from optimists such as Erik Brynjolfsson and Andrew McAfee (2014) - where the latter two base their arguments on the potential of Internet and digital technology to spur economic growth - is how strong a force for innovation (i.e., TFP growth) can Internet and digital technology possibly be? We review the trajectory of these trends, and their measurement, in the next section.
6.3.2 Internet Technology
Internet technology is not a single identifiable invention, but rather a suite of communications technologies, protocols, and standards for networking computers and increasingly mobile devices (Greenstein, 2000, p. 391). Advances in Internet technology have been very rapid in the past 25 years and continue to increase at blistering rates to this day. Indeed, without continued increases in Internet capacity, the world could not have achieved the estimated 30+ percent per year increase in IP (Internet Protocol) traffic and 100+ percent per year increase in wireless data traffic from 2010 to 2015 (see Figure 6.2(a)). Growth in IP traffic has been driven by the Internet second wave (social networks, smart phones, app stores, and e-readers), cloud services adoption, and spread of machine-to-machine communications (the Internet of Things, or IoT).
All told, the Internet markets of the G-20 are projected to reach $4.2 trillion in 2016 - nearly double the size they were in 2010; three out of four data center workloads are expected to be processed in the cloud in 2018; and IoT devices attached to the Internet - most of them wirelessly - are expected to increase more than 25-fold, from nearly one billion units in 2010 to 26 billion units by 2020.3These projections cannot be realized without continued, rapid increases in Internet capacity, especially wireless capacity, and prospects seem very bright on this score. Figure 6.2(b) shows that by one measure, the rate at which wireless-related patents are filed, the pace of change of late is as brisk as it was in the late 1990s. A recent analysis of the pace of communication technology from the perspective of price change for the equipment and products that determine Internet and wireless network capacity supports that assessment (Byrne and Corrado, 2015a, b).
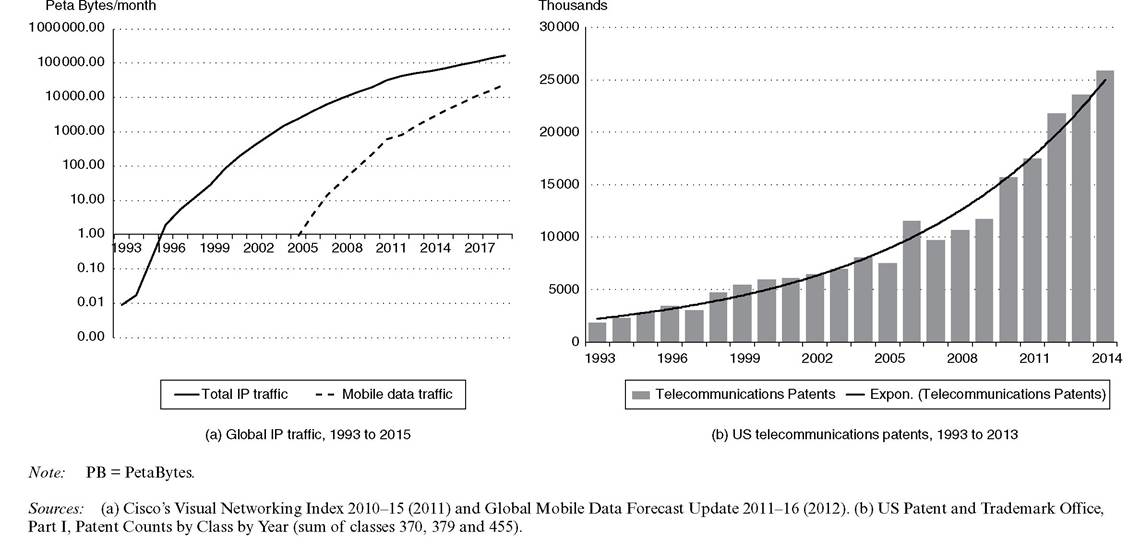
Figure 6.2 Global IP traffic and US telecommunications patents
Byrne and Corrado (2016) report that quality-adjusted prices for three types of telecom equipment (data networking equipment, cellular base station equipment, and local loop transmission equipment) fell 12 to 14 percent per year from 1985 to 2013 - faster than declines in official prices for computer storage devices (7 percent) but less than half that of semiconductors used primarily in computers, microprocessor units (MPUs) and dynamic random access memory (DRAM) (30 to 40 percent). Quality-adjusted prices for cell phones fell more rapidly than prices for telecom equipment - about 20 percent per year from 1985 to 2013 - roughly the same as the average annual decline in official prices for PCs over this period. Telecom equipment price declines also have been steadier than price declines for computers and semiconductors since 1995, that is, telecom equipment prices have not fallen at a materially slower rate since 2003, as have prices for computers and semiconductors.
What explains the large sustained declines in prices of communication products? Communication technology benefits from semiconductor and computer technology, for example, the miniaturization of semiconductors speeds up computation functions on communication devices, computer advancement is used to improve digital signal quality and storage improvements are essential for increasing smartphone functionality. But more fundamental to achieving increases in traffic capacity are improvements in transmission techniques (e.g., signal compression, multiplexing, and waveforms that increase spectral efficiency). The ability to squeeze more information through a band of radio wave spectrum or single cable has been absolutely instrumental in achieving the increases in data and voice traffic that have occurred.4
For one reason or another, and notwithstanding the invention of the Internet and World Wide Web (much less Internet browsers and smartphone apps), the technical and engineering advances that drive increases in communication capacity tend to be less heralded than advances in computing and semiconductor technology. The wireless world is thinking now about standards and protocols for 5G.5 But who outside the wireless community speaks of multiple-input and multiple-output (MIMO) techniques, a technology anticipated to be vital in the design of standards for 5G mobile broadband platforms?
If the pace of communication technology and declines in related equipment prices are not slowing down, one would expect that official price statistics for all things related to communication - Internet services (access and cloud), telecom services, and complementary manufactured ICT products - are also still declining as fast as they once did. Unfortunately, this conclusion cannot be drawn that simply for at least three reasons. First, and most basic, one must drill pretty far into available statistics to see the direct footprints of Internet and wireless technology. Second, the discussion is further complicated because one cannot ignore the argument by Robert Gordon that the exceptional US economic performance during the late 1990s and early 2000s was due to temporary productivity gains from one-time developments in computing and software technology (Gordon, 2014a, 2014b).
Third, inasmuch as the Internet facilitates the creation of new markets characterized by scalability, customization, and collection and use of detailed consumer and market data to meet previously unmet needs (Levin, 2011) we must consider that the defining feature of these markets is innovation, particularly the incremental type of innovation that occurs continuously. As this may manifest as a form of returns to scale, or process innovation, there may be little or no discernable impact on price change due product innovation as previously so evident with computers and other electronic products. And because the spread of new Internet platforms tends to be about new uses of ICT (in truth, new web uses), unlike the 1990s’ ICT-induced productivity wave, the distinction between ICT users (e.g., financial institutions) and producers (computer and chip makers) is no longer so clear-cut. The growth and popularity of elastic cloud services makes that abundantly clear.
We address the first two issues outlined above in subsection 6.3.3. As some of this material digs rather deep into the statistics, the reader can skip the detail and go straight to the recap and implications in section 6.3.4. The third issue leads naturally to exploring the indirect ways in which Internet markets leave their footprints in the productivity data. This is taken up in section 6.4 by incorporating network effects and other externalities into the standard model.
6.3.3 ICT Prices
6.3.3.1 Investment prices
ICT investment includes communications equipment (mainly, telecommunication and broadcast equipment) and, of course, computers and software. Real ICT investment prices indexes for the USA are plotted in Figure 6.3(a).6 The real price index for communication equipment (the solid black line) fell below its simple long-term trend after 2000 and has remained below it since then.7 By contrast, the combined price index for computers and software (the solid gray line), which was below its similarly calculated trend for an extended period of time, returned to trend by about 2004 and continued to flatten further. Computers and software greatly outweigh communications equipment in ICT investment - see Figure 6.3(b) - and thus overall ICT investment prices follow a similar, albeit muted, trend as prices for computers and software. This then would appear to solve part of the puzzle of why trends in communication technology do not seem to show through in the usual macro productivity data - they do not because the weight that is directly attached to them in ICT investment is rather small. Note, however, that according to The Conference Board’s Total Economy Database, telecom equipment spending is now the largest component of global ICT investment. Indeed, while software is the primary driver of US ICT investment, both software and telecom equipment drive ICT investment globally.
Figure 6.3 thus shifts the question of what is happening to technology primarily to computers and software. With regard to computers, most analysts agree that a slowing in the pace of change in performance occurred after 2003 (Flamm, 2007; Hilbert and Lopez, 2011).8 The slowing in performance is indeed reflected in real computer prices: from 2003 to 2008, the annual decline in real computer prices was 7.25 percentage points slower than it was from 1995 to 2003. Official data record another, equally sharp slowdown (that is, another 7.25 percentage points per year) in computer prices beginning in 2008 however, and the jury is still out on the validity of these figures. Related work that looks at microprocessor prices finds substantial upward biases in official semiconductor price indexes after 2008 (Byrne et al., 2015), a finding that also undermines official estimates of computer price declines since then. If the pace of decline in computer prices that prevailed from 2003 to 2008 had been maintained after 2008, labor productivity and the contribution of ICT capital deepening would each be about a 0.04 percentage point
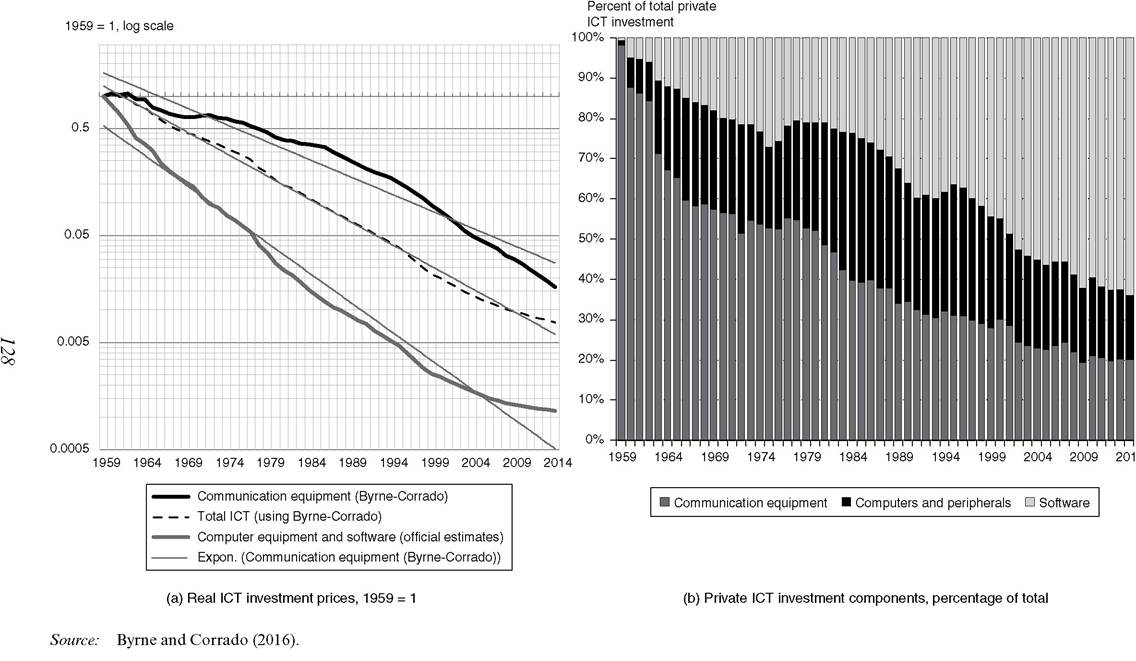
Figure 6.3 Real ICT investment prices and shares, 1959 to 2013
stronger per year from 2007 to 2013 - not inconsequential but also not a game changer for the analysis of recent economic growth.9
New research on the determinants of software prices by type of application - Internet platform apps, systems for cloud services, and so on - is needed to inform the analysis of recent price change for ICT software investment. From 2001 to 2007, software prices declined nearly 3 percent per year, whereas from 2007 to 2013, they fell a bit less than 1.5 percent per year. Increasing prices for enterprise and network software in the PPI for application software may be a culprit in this acceleration, but it is hard to know because the component was newly introduced into the PPI in June 2006.10 The increases in this index since mid-2006 may of course be accurate, but only having data from then on does not identify when the price increases for network software began. To place the reported acceleration in context consider the following: had the real price of software not accelerated after 2007, labor productivity and ICT capital deepening would have been stronger by another 0.05 percentage points and 0.03 percentage points per year, respectively - the same rough magnitudes associated with the 2008 computer price acceleration.
When the two thought experiments are combined, the impacts are 0.08 percentage points per year on labor productivity and 0.07 percentage points per year on ICT capital deepening. The difference between the output effect (labor productivity) and the investment effect (capital deepening) - 0.016 percentage points - is a small boost to the change in total economy TFP via the contribution attributed to ICT services-producing industries. These are verging on consequential impacts.
6.3.3.2 Consumption prices
Researchers developed quality-adjusted prices for cellular telephone and Internet access services from emergence of these markets in the USA in the mid/late 1980s to the late 1990s (Hausman, 1999; Stranger and Greenstein, 2007). The US Bureau of Economic Analysis (BEA) incorporated these research price indexes into the US national accounts in the early 2000s. For the household sector, the research indexes were linked with consumer price indexes (CPIs) for these services, which the US Bureau of Labor Statistics newly introduced in December 1997. The BLS' CPI indexes for cellular telephone and Internet access services reportedly are quality adjusted (Fixler et al., 2001).
The BEA's published series are converted to real terms and plotted in Figure 6.4(a). As may be seen, real cellular services prices (the thick solid line) decline relatively steadily whereas declines in the price index for Internet services (the dashed line) occur in fits and starts until 2007, after which the real price for Internet access services barely budges. The accelerating rate of decline in quality-adjusted prices for cell phones, much less the advent of mobile broadband, does not leave a footprint on telecom services prices but, without additional research, it is hard to know what may be going on. On the other hand, it seems reasonable to ask: how can Internet access prices be flat in real terms since 2007?
A recent analysis suggested a hedonic model would yield somewhat larger price declines than currently reported by the Internet access CPI prior to 2007 (Williams, 2008), and the large dots plotted on the figure underscore this possibility for subsequent years. They show a simple characteristic price measure obtained by dividing an Internet service provider (ISP) performance measure into BEA's estimates of household expenditure on Internet access for Q1 of each year.11 The characteristic price measure lies close to a simple trend line (the thin solid line) based on BEA history, which falls 5.6 percent
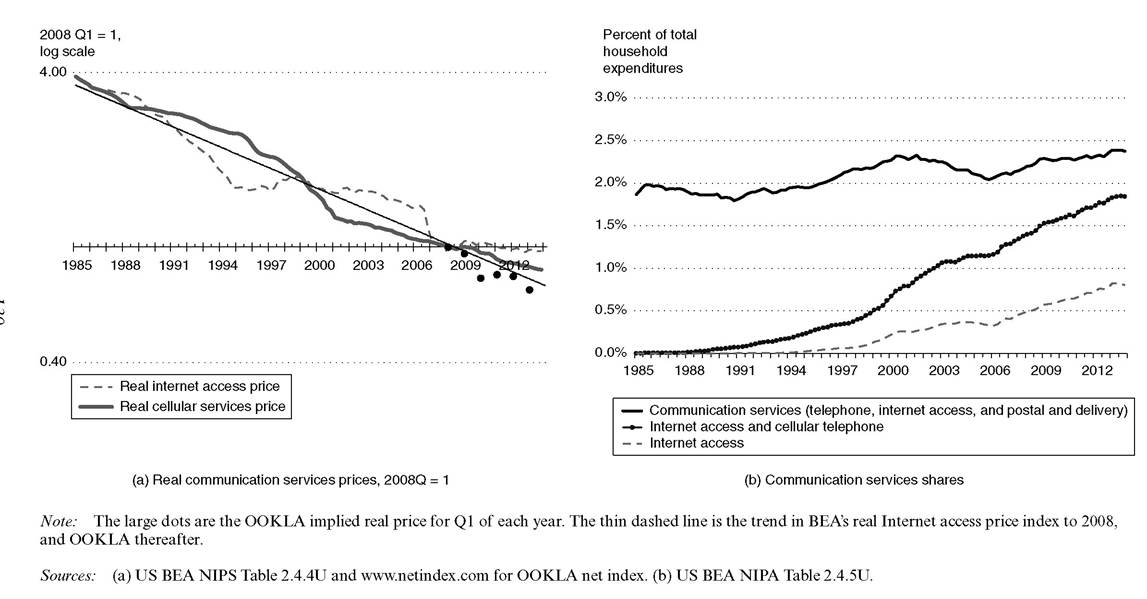
Figure 6.4 Real communication services prices and shares, 1985Ql to 2013Q4
per year. A thought experiment in which the post-2007 history of consumer prices for Internet access is rewritten to show real declines 5.5 percentage points per year faster than currently shown adds 0.04 percentage points per year to the growth of real GDP, and by implication to growth of TFP via a larger contribution from ICT services producers, in this case telecommunications (NAICS [North American Industry Classification System] 517), which includes Internet access services.
6.3.4 Implications
That the rapid increase in IP traffic and continued advances in communication technology are not regularly featured in macroeconomic productivity discussions is perhaps unsurprising as one cannot easily drill into the data to ‘see’ the change that is going on. We examined a new research price index for communications equipment, which supported the view that advances in communication technology are proceeding at historically rapid rates. On the other hand, advances in computer and semiconductor technology have slowed since 2003.
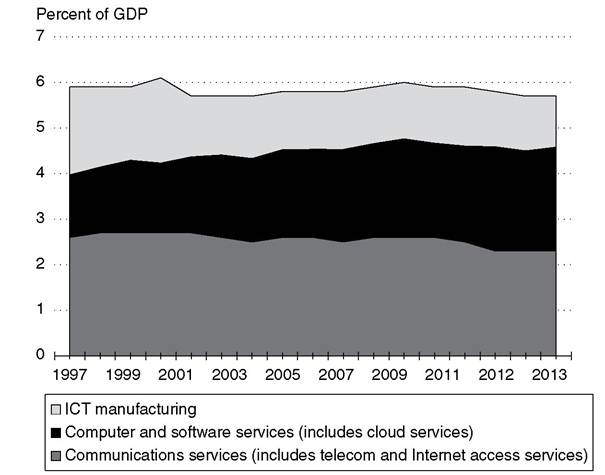
Our examination of ICT services prices in national accounts data found the picture incomplete or lacking in detail: where is Internet software technology and how much is its use increasing? With total ICT services production now more than 4.5 percent of GDP in the USA (Figure 6.5) and nearly that in Europe (not shown), accurate and more detailed ICT services prices are needed to fully understand how value created by Internet and digital technologies leads to increases in living standards. All told, new research on
Source: Authors’ elaboration of US BEA’s data on gross value added by industry, which includes R&D.
Figure 6.5 Value-added share of US ICT-producing industries, 1997 to 2013
high-tech communication services prices - mainly, all forms of cloud services made possible by high-speed communication systems - is needed for a thorough analysis of the impact of the Internet on productivity and economic growth.
Turning to the ICT-related productivity issues raised by Gordon, it is important to note first that the computing and semiconductor developments of the 1990s are very evident in the pace of nominal ICT investment and growth in worldwide semiconductor consumption prior to 2001. Figure 6.6 supports Gordon’s view that the rate of ICT investment was temporarily elevated heading into, but also including, the year 2000. On this basis, Gordon would have us discount the 1995 to 2001 US productivity experience when thinking about the influence of ICT on productivity trends going forward. Even though a literal read of available ICT data may lead to some pessimism, we hope to have made abundantly clear that the slowing of ICT price declines in official measures does not signal an end to advances in communication and Internet technologies.
Our analysis of ICT prices revealed an inexplicable acceleration in price change for computers and software after 2008; recall, they also slowed after 2003 but this is not disputed. If the second acceleration had not occurred, labor productivity and ICT capital deepening would be a tad stronger (nearly 0.1 percentage point) after 2008, but the post- 2001 labor productivity growth experience would still look disappointing - 1.1 percent per year in Europe and 1.5 percent per year in the USA.12 Note that ICT capital deepening stands at rates that, if sustained, are not strong but not growth detractors either (between 0.4 and 0.5 percentage points per year). To achieve 1.5 percent growth in output per hour going forward, both Europe and the USA would need to post annual TFP gains in the neighborhood of 0.5 percent per year. This was accomplished prior to the global financial crisis (and after the tech boom), so it would appear that the real stretch is thinking TFP growth could be strong enough to boost labor productivity growth back to 2 percent. But how much of a stretch?
Like labor productivity and ICT capital deepening, the outsized contribution of innovation in ICT manufacturing in the late 1990s (in the USA, see row 8a of Table 6.1) seems unlikely to be repeated, given the offshoring that has subsequently taken place. Gordon in fact makes this point, supporting his argument with figures indicating a massive drop in manufacturing production capacity for ICT products in the USA after 2000.13
From the perspective of this review and future relevance of ICT, it seems natural to focus on ICT services as the locus of future innovation and change. What are the prospects for sizable contributions to total economy TFP growth from ICT-producing services industries harnessing the power of high-speed communication networks to deliver customers the services and information they demand (security, data analytics, etc.)? We pointed to the already outsized contribution of this sub-sector in our review of Table 6.1, and our review of services prices found that real Internet access prices were flat after 2007. If such prices had indeed continued to fall on a quality-adjusted basis, the impact would flow through an increase in the contribution of ICT services to total economy TFP, suggesting the sub-sector may have even contributed a bit more to growth than currently attributed. This assessment can be applied to Europe as well as the USA.14 All told, then, the combined contribution of ICT impacts via investment and production accounts for two-thirds of the total growth in output per hour in the Europe and the USA after 2001.
To identify the underlying sources of ICT services industries’ TFP performance or determine whether their performance will continue in the future is beyond the power
Percent of
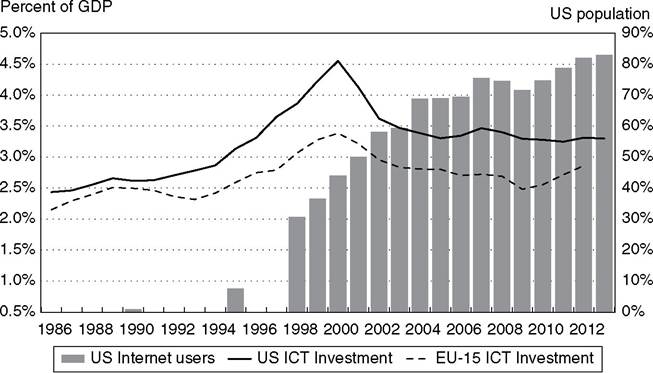
(a) EU-15 and US total ICT investment
Percent of Percent of world
world GDP population
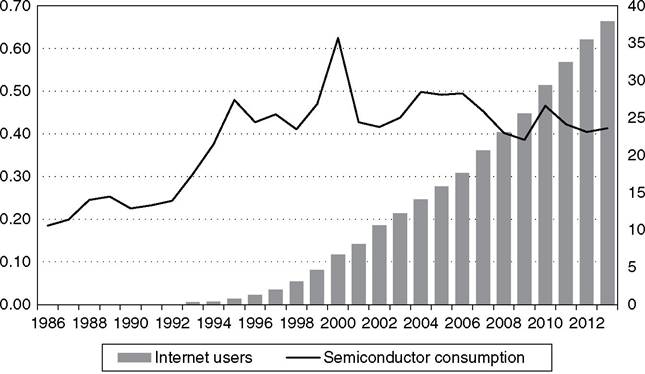
(b) World semiconductor consumption
Note: EU-15 excludes Luxembourg.
Sources: (a) EUKLEMS (EU-15 ICT Investment), US BEA (US ICT investment) and ITU (Internet users, 2000 on). (b) ITU (world Internet users as % of populations), WSTS (world semiconductor billings) and IMF (world GDP).
Figure 6.6 ICT investment and semiconductor consumption, 1986 to 2013 of growth accounting. If rapid expansion of Internet markets and unique character of Internet platform businesses are underlying drivers, the contribution to TFP growth from this sector might even pick up with improving conditions in the wider economy. Studying this sub-sector of the economy and its linkages with other sectors is a high priority for future research. For example, Brynjolfsson et al. (2014) study the role of user-generated content on firm-level performance using a panel of Internet platform businesses; also, Levin (2011) theorizes on how they price and compete. Perhaps they and others will soon achieve new insights on the mechanisms sustaining innovation and value creation in this important sector of modern economies.
6.4