The Problem of Unemployment
Identify the costs of unemployment and discuss the natural rate of unemployment.
In the rest of the chapter we look more closely at unemployment and inflation, beginning with unemployment in this section.
We start by discussing the costs of unemployment, then consider the factors that determine the long-run unemployment level, and conclude by exploring some ways in which macroeconomic policy can address unemployment.The Costs of Unemployment
There are two principal costs of unemployment. The first is the loss of output that occurs because fewer people are productively employed. This cost is borne disproportionately by workers who are unemployed themselves, in terms of the income they lose because they are out of work. However, because the unemployed may stop paying taxes and instead receive unemployment insurance benefits or other government payments, society (in this case, the taxpayer) also bears some of the output cost of unemployment.
How big is the output cost of unemployment? One estimate is provided by Okun's law (see Eq. 3.5), which states that each percentage point of cyclical unemployment is associated with a loss equal to 2% of full-employment output. Thus, if full-employment output is $20,000 billion, Okun's law indicates that each percentage point of unemployment sustained for one year reduces output by $400 billion. The loss of output predicted by Okun's law reflects not only the direct impact of increased unemployment, but also other labor market changes that occur during recessions, such as shorter workweeks, reduced labor force participation, and lower productivity. (Numerical Problem 10 in Chapter 3 illustrates these effects.)
The other substantial cost of unemployment is the personal or psychological cost faced by workers who are unemployed and their families and close associates. This cost is especially important for workers suffering long spells of unemployment and for the chronically unemployed.
Workers without steady employment for long periods lose job skills and self-esteem, experience significant declines in earnings that may last a long time, and suffer from stress-related health problems.[220]Severe recessions—such as the recessions of 1980 and 1981-1982, which are sometimes regarded as a "double-dip" recessionary episode, and the Great Recession of 2007-2009—exacerbate the problems from unemployment. In a study of severe recessions, Dirk Krueger of the University of Pennsylvania, Kurt Mitman of Stockholm University, and Fabrizio Perri of the Federal Reserve Bank of Minneapolis found that the average cost of losing one's job in the Great Recession varied inversely with wealth.[221] Measuring losses using the present value of lifetime consumption (PVLC, defined in the Appendix to Chapter 4), job loss caused the PVLC to decline about 5% for households with low wealth but only about 3% for wealthier households. Even workers who kept their jobs suffered a decline in their PVLC because of lower wages, lower returns to capital, and an increased probability of future unemployment. Severe recessions are more persistent than brief recessions, leading to these large costs over a lifetime.
A second major cost of severe recessions arises from long-term unemployment. When a recession is severe, the probability of a worker who is unemployed finding a job declines. In addition, the longer the worker is unemployed, the lower is the probability that the worker will find a job in any given month. Also, expected future earnings of workers decline the longer they are unemployed.[222]
The costs of unemployment may also vary across people in different demographic groups. The 2007-2009 recession affected men, Black and Hispanic workers, young workers, and those with low levels of education more than it did those in other demographic groups.[223]
The costs of unemployment are real and serious, but two offsetting factors should be noted.
First, to the extent that workers who are unemployed engage in economically productive activities such as searching for a job or acquiring new skills, the loss of output arising from current unemployment may be compensated for by increased output in the future. In particular, frictional unemployment—the result of workers and firms seeking appropriate matches—raises future productivity and output and thus may impose little net economic cost, or even lead to an economic gain.A second offsetting factor is that unemployed people have more leisure time— to spend with family and friends, work around the house, and so on. However, the benefits of extra leisure time decrease as the amount of leisure increases, and most workers who are unemployed wouldn't feel that increased leisure was adequate compensation for their lost income.
The Long-Term Behavior of the Unemployment Rate
Classical and Keynesian economists agree that, although the actual unemployment rate may deviate from the natural unemployment rate in the short run, in the long run the actual rate equals the natural rate. Thus understanding the behavior of unemployment in all but the short run requires identifying the determinants of the natural rate of unemployment. In Chapter 3 we discussed the reasons for the natural unemployment rate always being greater than zero; here we focus more narrowly on the reasons for changes in the natural rate in the United States.
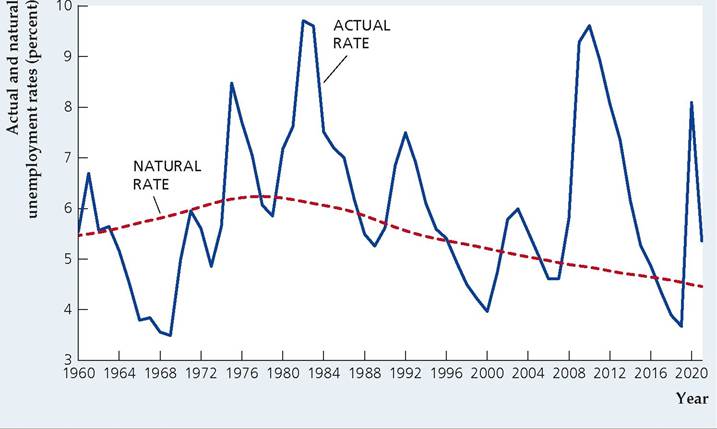
The Changing Natural Rate. The natural unemployment rate corresponds to full-employment output. Unfortunately, because we can't be sure when the economy is at full employment, we can't directly observe the natural rate and so must estimate it. Inevitably, therefore, there is some uncertainty about the value of the natural rate at any particular time. Figure 12.9 shows estimated values of the natural unemployment rate, published by the Congressional Budget Office, along with the actual unemployment rate, for the period 1960-2021.
Giving a fully satisfactory explanation of the rise and fall in the natural rate of unemployment is difficult, but part of the story seems to have been the result of demographic changes. The proportion of workers from differing demographic groups (based on age, gender, race, or ethnicity) changes gradually over time.
FIGUREJ2.9
Actual and natural unemployment rates in the United States, 1960-2021
The figure shows the actual unemployment rate and an estimate of the natural rate of unemployment in the United States for the period 1960-2021. The difference between the actual and natural unemployment rates is the cyclical unemployment rate. Note that the natural rate of unemployment rose from the 1960s until the late 1970s and declined from 1980 to 1999. It remained fairly constant around 5.0% for a few years after then but began declining in the mid-2010s.
Sources: Actual unemployment rate, Bureau of Labor Statistics, downloaded from Federal Reserve Bank of St. Louis FRED database at fred.stlouisfed.org, series UNRATE; natural rate of unemployment: Congressional Budget Office, downloaded from FRED database, series NROU.
Because some groups have higher unemployment rates than others, the natural rate of unemployment changes over time. For example, in the 1960s, as women entered the labor force in greater numbers, the natural rate of unemployment rose because women's average unemployment rate was higher than men's.[224] Teenagers have particularly high unemployment rates both because they move in and out of the labor force frequently while in school and because many teenagers work at low-skill jobs that do not provide long-term employment.
From World War II through about 1978, teenagers and women made up an increasingly large portion of the labor force in the United States. This shift in the composition of the labor force toward groups that have traditionally experienced higher unemployment rates may have raised the overall unemployment rate during that period, particularly in the 1960s and 1970s.
In contrast, since about 1978, demographic factors tended to reduce the natural rate of unemployment. One factor is the decline in the share of young people in the labor force—a trend that reflects the aging of the population as a whole. Indeed, the percentage of the U.S. labor force aged 16 to 24 fell from 25% in 1980 to 16% in 1998 and to 13% in 2021. A study by Robert Shimer[225] of the University of Chicago concluded that the declining share of younger workers, who are prone to periods of unemployment, can account for the bulk of the decline in the natural rate of unemployment in the United States in the 1980s and 1990s.Measuring the Natural Rate of Unemployment. Because of the prominent role played by the natural rate of unemployment in economic theory, policymakers would like to use measures of the natural rate when they formulate economic policy. In simple terms, if policymakers observe that the unemployment rate is above the natural rate, then the intersection of the AD and SRAS curves must be to the left of the LRAS curve. Thus a policymaker might consider using expansionary monetary policy (which we discuss in Chapter 14) or expansionary fiscal policy (which we discuss in Chapter 15) to shift the AD curve to the right, to bring the economy to its full-employment equilibrium. To use the unemployment rate as an indicator for setting policy, however, the policymaker needs a good measure of the natural rate of unemployment.
Although Fig. 12.9 shows a measure of the natural rate of unemployment created by the Congressional Budget Office (CBO), economists widely disagree about how to measure the natural rate. In addition, even the CBO has often revised its measures of the natural rate of unemployment over time.[226] Economists Douglas Staiger of Dartmouth University, James Stock of Harvard University, and Mark Watson of Princeton University[227] performed a detailed econometric analysis of the precision with which the natural rate can be measured.
They concluded that the number could not be measured at all precisely, despite trying many alternative methods of doing so. Their best estimate for the natural rate of unemployment in 1994, for example, is that it equaled 5 34 %, but that there was so much uncertainty about the number that they were 95% confident that it was between 4.8% and 6.6%. That interval is far too large to be of much use to policymakers.In the face of this evidence, researchers in the late 1990s pondered what policymakers should do. Given uncertainty about the natural rate of unemployment, policymakers may want to be less aggressive with policy changes than they would be if they knew the value of the natural rate more precisely.[228] Some researchers have even blamed the rise of inflation in the 1970s on the Federal Reserve's failure to estimate the natural rate of unemployment properly.[229] Policymakers face the problem, though, that measures of full-employment output may be even more imprecise. So, although economic theory relies on the concepts of full-employment output and the natural rate of unemployment, policymaking is difficult because economists cannot measure these concepts in a precise manner.
12.4
More on the topic The Problem of Unemployment:
- Unemployment of Saudi Women
- CONCLUSIONS: MAJOR FINDINGS FROM THE LITERATURE SURVEY AND IMPLICATIONS FOR FURTHER RESEARCH
- Spain
- Schmoller on law and his economic theory
- The Great Recession that began in the fall of 2008 was caused by a series of complex and connected events.
- Introduction
- Technological change in frictional labor markets
- Statement—Courses of Action
- Intragenerational equity
- Elements of ‘efficient’ dismissal protection regimes