INVESTIGATIONS IN CARDIAC DISEASE
Some important and specific investigations in cardiac disorders are as follows:
Chest X-rays provides valuable information about location and size of the heart as well as status of lung vascularity.
In normal PA view, right border of the heart is formed by SVC, ascending aorta and RA; left border by aortic knuckle, pulmonary conus; cardiac apex by LV; and the base of cardiac silhouette by origin of great vessels. Chest X-ray in a cardiac case should be assessed for:• Abnormal location of cardiac silhouette, e.g. dextrocardia, situs inversus or dextroversion. Abnormal location may also be due to non-cardiac causes, e.g. pneumothorax, collapse or diaphragmatic hernia.
Normal situs is identified by—(a) gastric air bubble on left side, (b) higher dome of diaphragm on right side, (c) straight bronchus on right side. Reversal of these findings along with cardiac apex on right side indicates include situs inversus, while left-sided cardiac apex with normal situs indicates possibility of isolated Dextrocardia.
• Cardiomegaly, by calculating the cardio-thoracic (C:T) ratio, for which thoracic width is measured at widest internal thoracic point (C, Fig. 17.8) and cardiac width
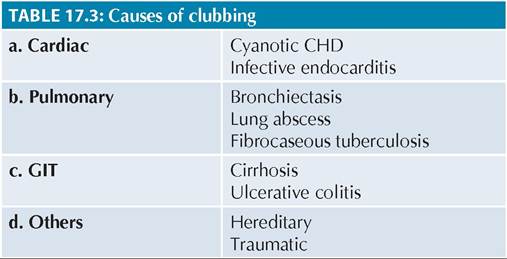
Fig. 17.8: Determination of cardio-thoracic ratio (CTR).
is measured from middle of the spine to ost distant cardiac show on Rt side + Left side (A+B, Fig. 17.8).
Upper limits of C:T ratio in normal children vary with age, being ~0.67 at birth, 0.61 at 1 year, 0.55 at 7 years and ~ 0.5 beyond this age, including adults.
Common causes of cardiomegaly on chest X-ray include—(a) CCF, (b) CHDs, (c) RHDs, (d) pericardial effusion, and (e) myocarditis/cardiomyopathies. Pericardial effusion may be differentiated from cardiomegaly due to CCF or organic heart diseases, on the basis of (a) typical pear-shaped cardiac silhouette, (b) narrow pedicle due to compression of great vessels, (b) oligemic lung fields, and (d) changing shape of cardiac silhouette in standing and decubitus exposures due to shift of fluid.
Heart size may appear reduced in chronic obstructive pulmonary disease (asthma/emphysema) and constructive pericarditis.
• Hypertrophy/dilatation of cardiac chambers, as indicated by (Fig. 17.9A and B):
± Outward and downward shift of the apex in LVH ± Outward but not downward shift of the apex in RVH
± Bulging of right cardiac border in RA dilatation ± Dilatation of LA is not directly visible on PA view due to posterior location of LA, but may be appreciated by—(a) straightening of left border (mitralization), (b) double-atrial shadow, (c) lifting-up of left bronchus, and (d) indentation of enlarged LA on esophagus in lateral barium-swallow plates.
• Status of pulmonary vascularity. In context of pulmonary vascularity, lung fields may be arbitrarily divided into three vertical sectors — the hilum, middle 1 / 3rd and outer 1 / 3rd of lung fields. Normally, pulmonary vessels are visible—easily at hilum, seldom in middle 1/3rd and very rarely in lateral 1/3rd of lung fields. Pulmonary arterial vasculature has better defined architecture on X-ray than pulmonary veins.
Fig. 17.9: Representative cardiac X-rays: (A) Right ventricular hypertrophy with oligemic lung fields; (B) Left ventricular hypertrophy; (C) Pulmonary arterial hypertension; (D) Pulmonary venous hypertension.
- Pulmonary arterial hypertension (PAH) is characterized by prominent hilum due to dilated pulmonary artery with outward fanning of linear vessels which taper suddenly (pruning) at the junction of middle and lateral third of lung fields, not extending up to periphery (Fig. 17.9C).
- Pulmonary venous hypertension (PVH) is characterized by—(a) prominence of upper zone vessels and blurring of lower zone vessels, (b) generalized haziness extending from hilum due to interstitial edema (bat-wing appearance), and (c) horizontal ribbon-like opacities due to engorged lymphatics and inter-septal edema, i.e.
Kerley-Fleischner lines (Fig. 17.9D).- Pulmonary oligemia, i.e. decreased pulmonary blood flow, is more difficult to differentiate from normal, indicated by—(a) absence of pulmonary conus, and (b) relatively poor vascularity at hilum (Fig. 17.9A).
Electrocardiography (ECG) is a 'graphic display of electrical conduction activity in heart', recorded on a special moving paper. Each small square on this paper represents 0.04 seconds on X-axis (duration) and 0.1 mV on Y-axis (voltage amplitude).
Normal electric activity in heart begins at sinoatrial (SA) node, travels through atrial walls to reach atrioventricular (AV) node, from AV node travels along the bundle of His in interventricular septum to reach ventricular walls through right and left bundle branches and Purkinje fibers.
TABLE 17.8: Adult and pediatric ECG: Imp. differences
• Tachycardia, with shorter PR interval, QRS complexes and QT interval
• Right QRS axis with RV dominance (tall R in V12) in infancy
• Inverted T waves from 7th day to 7 years of life
Atrial contractions begin with activation of SA node while ventricular contractions begin only when AV node is activated. Thus there is a time-gap between atrial contractions represented by P wave and ventricular contractions represented by QRS complex; the gap denoted as PR interval.
Pediatric ECGs differ from adult ECGs on various aspects (Table 17.8) due to RV dominance at birth that declines with age. It is important to record a 13-lead ECG in infants with an extra chest lead on right side (V3R) to reflect actual RV status than V1-2 leads. In children, ECGs are mainly used to detect hypertrophy/overload of various heart chambers, apart from other problems, e.g. conduction defects, myocardial ischemia and electrolyte disturbances. ECGs should be assessed in a systemic manner, for following features:
a. Heart rate is calculated by dividing 1500 (small squares covered at regular paper speed in a minute) by number of small squares in P-P or R-R interval.
b. Rhythm: Normal cardiac rhythm is regular and originates from Sinoatrial (SA) node that acts as pacemaker. Electrical impulses from SA node travel to other parts of atrium gt; atrioventricular (AV) node
gt; ventricular structures; and reflected on ECG as P
gt; PR gt; QRS sequence.
Rhythm abnormalities denote generation of abnormal rhythm either from normal site (SA node) or from abnormal site, (e.g. AV node), which may be identified on the basis of: (a) variable P-P or R-R interval, (b) altered relationship between P and R waves, and (c) altered configuration of P waves, as follows:
- Absence or abnormal shape/axis of P wave indicates:
(a) ineffective rhythm generation at SA node (atrial fibrillation), (b) non-conduction of SA node impulse (sinoatrial block), or (c) rhythm generation outside the SA node (AV nodal rhythm).
- Multiple P waves preceding QRS complex indicate - (a) excessive rhythm generation at SA node (atrial fibrillation, atrial flutter), or (b) failed conduction through AV node (AV blocks).
c. P wave represents atrial depolarization. It is normally upright in all leads except aVR and does not exceed 3 mV in amplitude and 0.12 second in duration. Common P wave abnormalities are:
- Tall and peaked (P pulmonale) in RA enlargement.
- Wide and notched (P mitrale) in LA enlargement.
- Absent/multiple P waves per QRS in arrhythmia.
- Inverted P waves (Lead I) in dextrocardia or incorrect placement of electrodes.
d. PR interval, from onset of P to onset of R wave, indicates physiological delay in AV conduction. Although varies with age and HR. Normally, it should be lt;0.08 second up to 3 years and lt;0.12 seconds in older children. Common abnormalities include:
- Prolonged PR interval in myocarditis including rheumatic fever, digitalis toxicity, hyperkalemia, endocardial cushion defect.
- Decreased PR interval in WPW syndrome, glycogen storage disorders, etc.
e. QRS complexes represent ventricular depolarization.
Normal QRS interval increases with age but does not exceed 0.12 second at any age (lt;0.08 second in infants). Common QRS complex abnormalities include:- Low-voltage QRS (lt;5 mm in limb leads or lt;10 mm in chest leads) in pericardial effusion, hypokalemia, hypothyroidism, etc.
- Large QRS in RVH/LVH.
- Wide QRS (gt;0.12 second) in conduction defects, e.g. bundle branch blocks.
- Abnormal configuration (rSR or M pattern) in myocarditis, cardiomyopathy, bundle branch block.
Normally, Q waves are visible only in left-sided chest leads (V5-6). Important Q wave abnormalities include:
- Presence of Q waves in V1-2 in severe RVH.
- Deep Q waves (gt; 5 mV) in V5_6 in LVH.
- Absent Q wave in V5 6 in dextrocardia or LBBB.
- Deep and wide Q waves in myocardial ischemia.
f. ST segment represents time between depolarization and repolarization and should be assessed for ele- vation/depression from isoelectric line (gt;1 mm). Important ST segment abnormalities include:
- Elevated in early pericarditis, digoxin toxicity (tick sign) and myocarditis.
- Depressed in pericarditis with effusion, cardiomyopathies or myocardial ischemia due to any cause, e.g. severe anemia, anomalous coronary vessels, severe hypoxia, etc.
g. T waves represent ventricular depolarization and its configuration changes with age. T waves are upright or flat at birth, turn negative by 7th day and remain so till 7-8 years before becoming positive again, (may remain negative in V1 2). Common T wave abnormalities include:
- Upright T wave in V1-2 (7 days - 7 years) in RVH,
- Flat/inverted T waves (gt;7 years, except in V1-2) in pericardial effusion, myocarditis, digitalis toxicity, hypokalemia and LVH/strain,
- Tall T waves (tent-shaped) in hyperkalemia.
h. QT interval, from beginning of the Q wave to the end of T wave, represents total duration of ventricular systole. As it varies with HR, corrected QT
Fig.
17.10: Graph method for ventricular axis.interval (QTc), i.e. QT interval/RR interval, is more informative, normal being lt; 0.44 second. QTc is:
- Increased in long QT syndrome, myocarditis, Rh carditis, hypocalcemia and quinidine
- Decreased in digitalis effect and hypercalcemia.
i. U waves denoting slower repolarization of Purkinje's fibers and papillary muscles, are rarely visible after T wave with similar polarity. Inverted U waves in children indicate digitalis toxicity, pulmonary embolism and LV overload.
j. QRS axis is calculated using only the limb leads, by any of the two methods, discussed below. ECG in Fig. 17.10 has been used as example for both methods.
a. Graph method (Fig. 17.10):
• Find net QRS amplitude {(+R) + (+S)} in any two leads, e.g. L1 and L3. In given example, net amplitude in L1and L3 is {(+5.5) + (-0.5) = +5.0} and {(+10.0) + (-3.5) = (+6.5)}
• Plot it on corresponding axis of each lead over graph paper.
• Draw perpendiculars to these axes, passing through these two points.
• A line connecting intersector of these perpendiculars with the center represents QRS axis. In given example it is + 65°.
b. Successive approximation method is simple, based on hexaxial reference system (Fig. 17.11):
• Locate the main quadrant of axis, using net pattern of QRS complexes in lead I and aVF. In given example, net positive deflections in lead I and aVF indicate that axis is between 0 and +90.
• Find a lead with equiphasic QRS complex (aVL in example). The QRS axis is perpendicular to this lead and lies within the pre-determined quadrant. In given example it is +60°.
Some characteristics ECG abnormalities in various chamber hypertrophies are shown in Fig. 17.12.
Echocardiography is an extremely valuable diagnostic tool for—(a) direct visualization of cardiac anatomy, (b) evaluation of pressure gradients across various valves
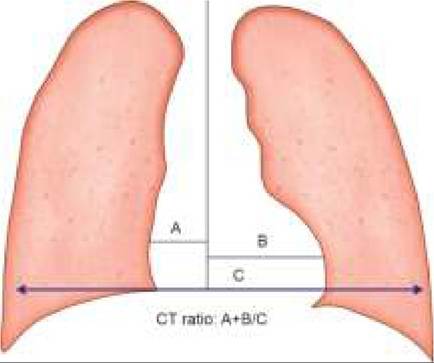
Fig. 17.12: ECG findings in cardiac chamber hypertrophies.
and vessels, (c) assessment of blood flow through shunts, (d) assessment of myocardial functions, and (e) visualization of vegetations, pericardial fluid or intracardiac thrombi, tumors, etc. In addition, it is also useful for—(f) pericardiocentesis and (g) balloon septostomy and other interventional procedures.
Fetal echocardiography may identify CHDs as early as by 17-19th weeks of gestation and is routinely recommended in pregnancies with history of previous child or first- degree relative with CHD.
Echocardiography includes various procedures, e.g.
• M-Mode Echo is a one-dimensional slice of cardiac structures to provide information about anatomy and mobility of valves, measurement of cardiac dimensions and assessment of myocardial contractility. Later is usually denoted in terms of % fractional shortening in LV dimensions during end-systole compared to tha
in end-diastole (LVED - LVES/LVED 100), normal being 30-40%.
• Two-D echo provides flexibility of reconstructing multiple real-time images using different views for different cardiac structures. Accuracy of 2-D echo has obviated the need for invasive studies, e.g. cardiac catheterization in many cardiac lesions.
• Three-D echo is used to measure volume and ejection fraction of unusual ventricular geometries and visualize device placement
• Doppler echo displays the volume, speed and direction of blood-flow across various cardiac chambers and vessels, based on the change in frequency imparted to a sound wave by the movements of blood cells, using either pulse (intermittent) or continuous wave Doppler technique. It is most useful to assess—(a) severity of intracardiac shunts, (b) adequacy of systemic/ pulmonary blood flow, (c) pressure gradients across valves, and (d) reversal of flow in valvular insufficiency.
• Trans-esophageal echocardiography is an extremely sensitive method to visualize small vegetations in infective endocarditis, posteriorly-located lesions and for intra-surgery monitoring.
Cardiac catheterization is a valuable diagnostic and therapeutic tool in cardiology, involving percutaneous passage of a soft, flow-directed, balloon-tipped catheter into RA through femoral/jugular vein, under fluoroscopic guidance. From RA, catheter is further advanced to RV and then to LA/LV via formen ovale.
Left side of heart may also be reached by retrograde p assage of catheter from femoral artery. During catheterization, following procedures may be conduc- ted—(a) collection of blood samples from different chambers to measure oxygen saturation and calculate shunt volumes, (b) measurement of various chamber pressures to calculate transvalvular gradients, (c) injection of a contrast media to selectively delineate cardiac structures, and (d) special procedures, e.g. angiocardiography, balloon angioplasty or valvoplasty, etc.
Indications for cardiac catheterization in children generally include:
• Diagnostic:
± Pre-surgery evaluation of anatomy and shunt size
± Evaluation of pulmonary vascular resistance and its responsiveness to drugs/oxygen
± Post-surgery follow-up in CHDs
• Therapeutic (interventional cardiology)
± Balloon valvuloplasty, i.e. dilatation of stenotic valves, e.g. PS, AS, etc.
± Balloon angioplasty, i.e. dilatation of coarcted aorta or pulmonary branch stenosis with coils/stents.
± Embolization of abnormal communication, e.g. PDA.
± Closure of septal defects, e.g. small/medium ASDs and muscular VSDs, using umbrella, button or clamshell devices.
Complications include aneurysms, infection, arrhythmia and thromboembolic episodes. Lesions underwent balloon valvuloplasty/angioplasty are more likely to get re-stenosed than open-operated cases.
Cardiac magnetic resonance imaging (MRI) and magnetic resonance angiography (MRA) provide tomographic images of the heart in different projections with excellent contrast resolution, permitting assessment of myocardial thickness, chamber volumes, valvular functions and even blood flow velocity/volumes. Being non-invasive modalities, these investigations have gradually replaced the need for diagnostic cardiac catheterization in many cases, specially post-surgical follow-ups.
MRI is particularly useful to evaluate areas not well visualized by echocardiography, e.g. distal pulmonary artery anatomy and anomalies in systemic and pulmonary venous return. Computerized processing of MRA images allows the noninvasive visualization of the cardiovascular system from inside of the heart or vessels, a technique known as fly-through imaging.
Blood investigations in a cardiac disease not only help in assessing the etiology of disease but also to assess the severity and response to treatment (ESR in rheumatic fever) and presence of complications, e.g. polycythemia or metabolic defects in cyanotic CHDs. However the choice of tests depends on the clinical possibilities, with some general suggestions as follows:
• All cases on first contact should be assessed for baseline hematological investigations, e.g. Hb, total count, platelet count (Kawasaki disease), etc.
• Suspected rheumatic fever needs additional ESR, CRP, ASLO and throat swab to assess the presence of rheumatic fever.
• Suspected infective endocarditis requires at-least three blood cultures at different times as discussed in relevant chapter to identify the microbial etiology.
• Suspected myocarditis cases need Troponin and CPK- MB levels to quantify the extent of tissue damage, apart from virological studies to identify etiology.
• Suspected cardiomyopathies need metabolic/enzyme studies as well as endocrinal workup, as required.
17.4
More on the topic INVESTIGATIONS IN CARDIAC DISEASE:
- Cardiac Malignancy
- Agrawal M.. Textbook of Pediatrics. 3rd ed. — CBS Publishers,2025. — 973 p., 2025
- General aspects of antenatal care
- LABORATORY EVALUATION IN CNS DISEASE
- CONGESTIVE CARDIAC FAILURE
- Preconceptional evaluation of women with heart disease
- Care in the puerperium
- Prepregnancy counselling
- REFERENCES
- 3 Critical Care