The Model: Questions and Design
The proximate objective of WELASSIMO is an answer to the question, whether a need for a frequent settlement relocation (as documented by the archaeological record, e.g. Bleicher 2009; Dieckmann et al.
2006, p. 418; Ebersbach 2010) might have arisen out of the land use and the resource demand of the inhabitants of the wetland settlements at the beginning of the 4th Millennium BC. To this aim, I have programmed a simulation of the land use of a group of 1 to 20 households according to the relevant hypotheses integrating archaeological and (paleo-) environmental data. In contrast to the pattern observed by archaeology, households do not relocate after a number of years, but are permanently bound to one location. Thus, I want to observe whether resource scarcity arises after some time. Furthermore, an understanding of the systemic implications of different hypotheses on prehistoric land use as described above and of the resulting landscape is aimed at. I want to know, how large the economic area of the sites was, how the economic activities affected the environment—and vice versa, how the environmental conditions influenced the internal functioning of the sites. A more abstract objective is to analyze the human-environment-system and to define the fundamental parameters and factors. The research is facilitated by the large archaeobiological database published and the exact dating of settlement dynamics with annual resolution, as provided by dendrochronology. As a first step, I reconstructed the environment of a hypothetical settlement based on paleo-environmental and modern data. Therefore I chose an area of 5 X 5 km located in the Lake Constance area with similar geographic properties as in areas with well-known wetland settlements and a good availability of soil data and a high-resolution digital elevation model. This data (Table 9.1) was processed in Arc-GIS and transformed into grid cells with aTable 9.1 Primary and derived data used to reconstruct the idealized environment of WELASSIMO.
(DEM: © LGL Baden-Württemberg; Soil data: LGRB 2013)| Geodata | Derived grid cell data |
| Digital elevation model | Elevation; Slope; Aspect; Walking Chronozones |
| Modern soil map | Soil type; Vegetation cover |
resolution of 25 X 25 m. These were used as the basis to generate a dynamic model environment with NETLOGO. Using the GIS-Extension of this agent-based programming software, a surface was created where every cell is characterized by a set of certain environmental parameters, some of which are static, such as elevation or soil type, others are dynamic and are updated in annual time steps, such as the state of the vegetation cover, the forest development phases or the quantity of relevant resources.
The modern soil map had to be adjusted to assumed Neolithic conditions, as certain modern soiltypes have only developed with intensified human impact since the Neolithic, and others have changed due to natural or anthropogenic processes (Gerlach 2006; Vogt 2014). Since the exact nature and amount of these changes is nearly impossible to assess, the reconstructions are necessarily tentative to a certain degree. Similarly, the allocation of a certain vegetation type to a grid cell is an idealized simplification. I defined standardized forest compositions, based on the naturally dominant tree species in the 4th Millennium as reconstructed by pollen analysis (Rosch 1990; Lechterbeck 2001) and on the modern natural vegetation in the region (Lang 1990), and assigned these communities to certain soil types. The age of the trees in primary lowland deciduous forests is not homogeneously distributed, but instead, these woods are characterized by a mosaic of stands of different development phases, as described by various authors (e.g. Härdtle et al. 2004, p. 85; Bernadzki et al.
1998; Bobiec 2012). Therefore also in WELASSIMO, the forest patches are grouped to “stands” randomly consisting of 1-20 cells sharing the same forest development phase. In the optimal and in the terminal phase, the characteristics and the resource availability are different from the regeneration and the juvenile phase. Especially, livestock fodder value, gathering value and timber availability vary. The stands mature with every model year and, by reaching a defined threshold, enter the next development phase. Thus, a simplified dynamic representation of vegetation succession and forest development phases is generated in a so-called cellular automaton.The economic processes of interest are simulated as a second step inside of this environment. The basic unit (or “agent”) of the model are the households = houses, which are idealized and represent a standardized group of assumed 6 persons comprising adults, children and elderly. The number of households is selectable in a range from 1 to 20, representing a population of 6-120 people. The main driver of the model is the annual demand in calories and non-finite resources of the households. The annual calorie demand of one household is defined as 365 * 6 * 2000 = 4,380,000 kcal, which is the average demand of all potential inhabitants of the houses. In accordance with the objectives of this research, only non-finite resources that exhibit dynamic properties are considered: arable and fertile soil, livestock pasture, hunting/gathering/fishing areas, and suitable timber (see Table 9.2). Finite resources such as flint for tools or clay for pottery are not considered. The households have a set of subsistence strategies that they apply in order to meet their demand (see Fig. 9.2): crop husbandry, livestock husbandry, hunting/fishing and gathering, and timber extraction. While the basic properties, the timing and the functioning of these strategies is predefined and encoded inside of
Table 9.2 Quantitative data on resources per patch (1/16 ha = 25 X 25 m) as assumed in WELASSIMO.
Numbers in brackets are the standard deviations of the specified mean. Values vary according to the forest development phase and environmental stochasticity (not for soil fertility). For livestock fodder, gather-value and soil fertility, the values are relative to 1 (the assumed maximum) and are further quantified in the model; values for suitable timber are absolute and give the range of numbers per patch| Primary forest (beech) on luvisol | Primary forest (alder/ash) on gleysol | Primary forest (alder carr) on histosol | Young fallows | Secondary forest | |
| Livestock fodder | 0.2-0.3 | 0.3-0.4 | 0.2 | 1.0 | 0.5-0.6 |
| Gather-value | 0.005-0.01 | 0.005-0.01 | 0.005 | 0.05-0.6 | 0.6-1.0 |
| Suitable timber | 2-16 | 4-30 | 0 | 0 | 23-34 (7) |
| Soil fertility | 1 (0.1) | 0.7 (0.1) | 0.2 (0.1) |
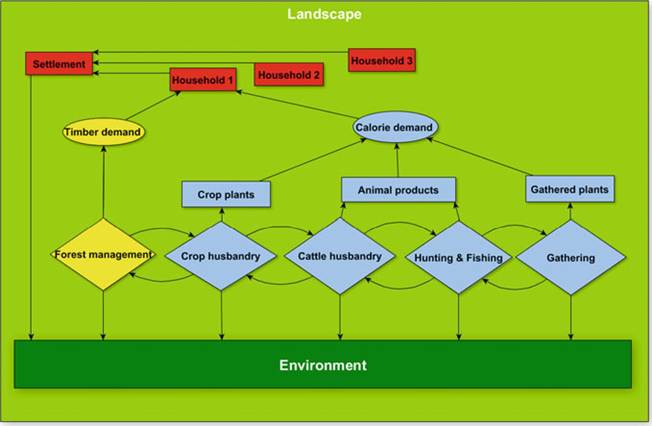
Fig. 9.2 Schema showing the interplay of the various elements of “Landscape” developing in the vicinity of a hypothetical wetland settlement in the 4th Millennium BC. Landscape is understood as the result of anthropogenic and natural processes shaping the human environment. Rectangles symbolize physical elements, diamonds denote processes, and ovals show system drivers. Arrows either denote influence on or affiliation to a certain element
the model, the exact configuration is defined by the observer, so that the outcome of various assumptions and hypotheses can be studied.
The choice options for the observer are summarized in Table 9.3.Table 9.3 Choice options for the observer
| Cropping system | Importance of meat and fish | Source of plant calories (cultivated/gathered) | Source of meat calories (livestock/hunted and fished) |
| SC | Low (5 %) | 100 % cultivated | 100 % livestock |
| IGC | Medium (15 %) | 80/20 | 75/25 |
| NIC | High (25 %) | 50/50 | 50/50 |
| IFH | Not consumed | 20/80 | 25/75 |
| 100 % hunting and fishing |
During a simulation run, the households cover their demand according to the chosen scenario. They always choose the patches with the desired properties which have the minimal traveling cost—a parameter that differs from the mere Euclidean distance in that realistic walking time is calculated by additionally taking into account the decreasing walking speed with increasing slope. For the crop fields, the soil type of the patches must be “Luvisol” and the slope must be below 25°, an arbitrary value. The other soiltypes that supposedly covered relevant areas in the Lake Constance area in the Neolithic are “Gleysol” and “Histosol”, which are less well suited by far and therefore are excluded a priori. The size of the crop fields is calculated at the beginning of the simulation and remains fix for the subsequent years. The underlying assumption is that Neolithic people had acquired or inherited a knowledge about the most appropriate size of their fields, with respect to the available work force and the minimal proportion of crop calories aimed at.
They definitely had experienced that crop yields fluctuate in wide ranges, and that the success and the fulfilling of the aims is dependent on external factors. To account for this context, the annual crop yield is calculated using the assumed average yield for the respective crop husbandry method as described above, modified by a factor for the soil fertility of the patch (which is dependent on the duration of crop production on this spot) and a factor which represents weather stochasticity. The rate of soil degradation is taken from a simulation performed with the crop simulation model “MONICA” (Nendel et al. 2011), while the influence of weather stochasticity is extracted from the same dataset and additionally from the yield series of the Rothamsted Experimental Station (Poulton 2006). An example of both the Rothamsted and the simulated yield series is shown in Fig. 9.3. This procedure means that if the observer chooses a diet comprising of 50 % cultivated plants to be produced with “IGC”, the aim of one household would be to produce (4,380,000/2) = 2,190,000 kcal. As 1kg of cereals equals 3000 kcal, and the average yield in IGC is assumed to be 2400 kg/ha, in this simulation run, one household cultivates an area of 0.3 ha equaling 5 patches. Yet due to stochasticity, yield success is likely to differ from the average yield. For reasons of simplicity, the only crop plant considered are cereals, although pulses, flax and poppy are also documented to a minor extent.Average yields for the use in WELASSIMO are taken from the Rothamsted Dataset for IGC, IFH and NIC and from Ehrmann et al. (2009) for SC, while loss in
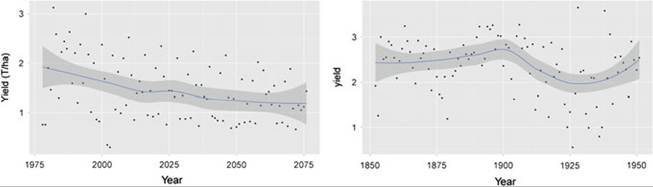
Fig. 9.3 Left Synthetic crop yield series (100 % dry matter) of 100 years simulated with the MONICA-model (Nendel et al. 2011). The scenario is IGC: annual application of manure (10 T/year/ha) and intensive weeding. The declining long-term trend is reflecting loss in soil fertility, while weather variability accounts for the annual variation. Right 100 years yield-series (100 % dry matter) as documented by Rothamsted Research. Yields increase slightly in the beginning due to a very high annual application of 35 T of manure per hectare. The decline in yields after 1900 AD is a consequence of reduced weeding, the rise of the curve is a consequence of renewed engagement and improved husbandry methods (Poulton 2006)
soil fertility is taken from the simulation. The annual demand in patches for livestock pasture and pollarding is dependent on the configuration set by the observer, and additionally on the vegetation cover of the patches. In the Neolithic wetland settlements, the minimum number of livestock individuals (MNI) per household lies between 0.1 and 4 (Ebersbach 2013). The livestock density in WELASSIMO uses these values as minimum and maximum values. Only cattle are considered, even if pigs, goat and sheep are also documented (e.g. Schibler 2006). If the importance of animal products and the proportion of domestics therein is set to high, or if IGC or IFH are selected and the need for animal dung is large, a higher MNI is used than if SC or NIC is chosen, and no livestock products are consumed at all. As shown by various authors, the area necessary to support one cow is highly dependent on the quality of the pasture or the area used for pollarding. While on grassland meadow (for which there is no proof in the Neolithic), 1.2 ha might be sufficient (Ebersbach 2002, p. 156), in a poor pine forest 20-30 ha are needed (Adams 1975, p. 148). In Welassimo, a minimum of 2 ha per cow on young fallowing areas and a maximum of 12 ha per cow in beech forest of the optimal and terminal phase are assumed. Livestock will choose patches with soil type not Histosol without crop fields with the least walking cost.
Also the area required for gathering is dependent on the model configuration as chosen by the observer and the vegetation cover of the respective patches. I assume that the maximal “gathering value” an area can have is reached when it is covered with secondary forest growth dominated by hazel, a vegetation type typical for the wetland sites as documented by palynology (e.g. Lechterbeck 2001; Rosch et al. 2014). Hazelnut kernels are extremely rich in calories (6000 kcal/kg). Using very conservative numbers given by Holst (2010), on one hectare of this vegetation type about 84 bushes may have grown in the Neolithic. 2000 nuts per bush may be harvested, adding up to an average of 900.000 kcal per year and hectare, divided by 16 for the patches (which have the size of 1/16 ha). These patches get the relative value of 1/16. The minimal gathering value a patch can have is arbitrarily set to 0.005/16. Thus, an area covered with mature hazelnut bushes yields 200 times more calories than the poorest areas (e.g. peat bog or optimal/terminal-phase beech forest). While the maximal value for nuts is backed by other studies, the lower number is speculative, and is open to discussion. The requirement in gathered calories of the households is the relative value of 1 * the proportion set by the observer, equaling a potential importance of minimum 0 and maximum 80 % of gathered calories. So, to meet this number, the households visit successively the patches beginning with the ones exhibiting the lowest travel costs, and add the respective gather value to their annual calories provision until the required amount is met.
The required area for hunting and fishing is not (yet) quantified, due to difficulties with finding reliable data. It is hypothetically assumed to have been sustainable; the simplifying assumption behind is that neither the populations of wild animals nor fish are severely limited in quantity as long as relatively small human populations exploit them. Furthermore, the degree of uncertainty with the decline in game or fish density due to human exploitation is dependent on too many factors to be simulated with confidence in this project. The only representation of these activities inside the model is the annual filling up of stocks according to the chosen parameters, with slight variations allowed for. The fluctuation of the success of calorie provision by livestock products, hunting, gathering and fishing in WELASSIMO is lower than the fluctuation of crop yields. If the observer chooses an importance of 5 % for one of these foodstuffs, than the actual value will be around 3-7 %. The reason for this is that field size is fix, and bad yields cannot be compensated by simply harvesting more patches. To the contrary, in hunting, fishing and gathering, endless resources are assumed, if the radius of action is extended. This is only possible because worktime limitations are not accounted for in WELASSIMO. The main reason is that they are used for validation; this is discussed below. As can be seen on the center panels of Figs. 9.4, 9.5, 9.6 and 9.7, in many cases the sum of all foodstuffs does not equal 100 % of the aim, but instead, over-and underachieving happens quite frequently. While in a real situation, people would try to mitigate this by increased investment in other calorie sources, this is not accounted for in WELASSIMO in order to highlight this effect.
The demand in timber is determined by the house age. A few logs are needed every year for reparations, while the probability of a complete reconstruction increases every year. In the year of the breakdown of the house, 120 logs of 520 cm are needed (combined after Luley 1992; Petrequin 1991). The area necessary to meet these numbers is dependent on the numbers of suitable timber per patch— again, patches with lowest travel cost are considered first, suitable timber extracted as needed and provided, and if needed, the next patch will be used as well. In the model, a beech forest in the optimal phase may have no suitable logs at all, while in the regeneration and in the juvenile phase of a mixed alder-ash forest, 400-600 such
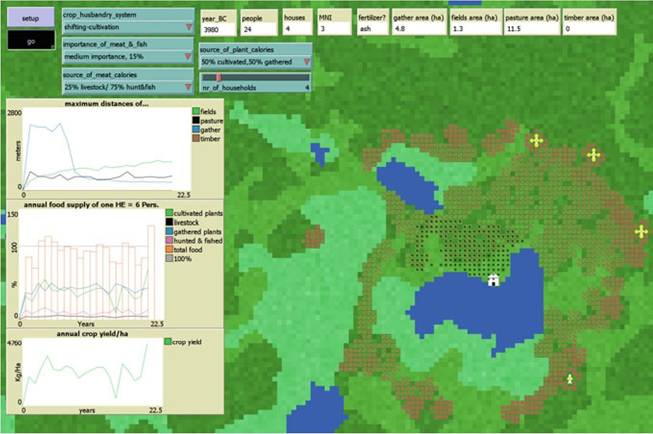
Fig. 9.4 Scenario 1 simulating land use, resource use and economic parameters of a hypothetical Neolithic wetland settlement relying on SC. Grey and blue boxes in the upper left corner are observer choice options, white boxes are monitors displaying current model conditions and results. (MNI = minimum number of individuals = livestock). Blue areas are lakes, different shades of green are forests of different species composition on specific soil, and brownish colors are fallowing patches. Only dark green colors (representing Luvisols) are soils suitable for agriculture. A white house symbol represents the settlement. Black circles mark patches affected by livestock browsing. One raster cell equals 25 * 25 m = 1/16 ha, the largest lake measures 750 m from east to west. Note that the maximum on the y-axis of the lowest panel is higher than in the other three scenarios
trees may be found (calculated after Korpel 1995, S. 127-137). On young secondary forest with ages of 20+ years, an assumed maximum of 700-800 suitable trees per hectare is simulated.
9.5
More on the topic The Model: Questions and Design:
- In the last chapter, we argued that there are two and only two plausible models of legal reasoning, the natural model and the rule model.
- Participatory Design and Training
- In our view, there are only two plausible methods available to judges when they decide cases as a matter of common law, the ‘natural' model of decision-making and the ‘rule' model of decision-making.
- Institutional Design of Muslim Dispute Resolution Mechanisms
- CONSEQUENCES FOR THE DESIGN OF THE INITIATION PROCESS
- Chapter 75 Banking Online: Design for a New Credibility
- The argument from design
- The role of inclusive leadership on job performance through mediators in interior design and construction companies in Vietnam
- Section 2 Development and Design Methodologies
- DESIGN ROUTES WITH REGARD TO ABM
- Rhetorical Design of the Protagonists in Greek Novels