Linking growth to institutional change
6.1. From Schumpeter to Gerschenkron
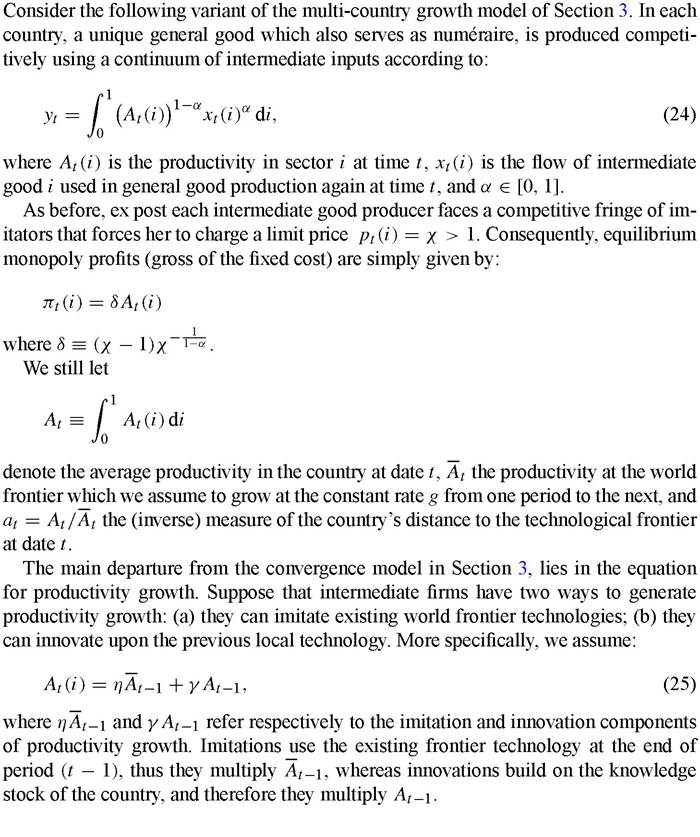
By linking growth to innovation and entrepreneurship, and innovation incentives in turn to characteristics of the economic environment, new growth theories made it possible to analyze the interplay between growth and the design of policies and institutions.
For example, the basic model developed in Section 2 suggested that long-run growth would be best enhanced by a combination of good property right protection (to protect the rents of innovators against imitation), a good education system (to increase the efficiency of R&D activities and/or the supply of skilled manufacturing labor), and a stable macroeconomy to reduce interest rates (and thereby increase the net present value of innovative rents). Our discussion of convergence in Section 3 then suggested that the same policies or institutions would also increase a country’s ability to join the convergence club.However, new growth theories may be criticized by development economists and policy makers, precisely because of the universal nature of the policy recommendations that appear to follow from them: no matter how developed a country or sector currently is, it seems that one should prescribe the same medicines (legal reform to enforce property rights, investment climate favorable to entrepreneurship, education, macrostability, etc.) to maximize the growth prospects of that country or sector.
Yet, in his essay on Economic Backwardness in Historical Perspective, Gerschenkron (1952) argues that relatively backward economies could more rapidly catch up with more advanced countries by introducing “appropriate institutions” that are growthenhancing at an early stage of development but may cease to be so at a later stage. Thus, countries like Japan or Korea managed to achieve very high growth rates between 1945 up until the 1990s with institutional arrangements involving long-term relationships between firms and banks, the predominance of large conglomerates, and strong government intervention through export promotion and subsidized loans to the enterprise sector, all of which depart from the more market-based and laissez-faire institutional model pioneered and promoted by the U.S.
That growth-enhancing institutions or policies might change with a country’s or sector’s distance to the technological frontier, should not come as a total surprise to our readers at this point: in Section 4, we saw that competition could have opposite effects on innovation incentives depending on whether firms were initially closer to or farther below the fringe in the corresponding industry (it would enhance innovations in neck- and-neck industries, and discourage it in industries where innovating firms are far below the frontier). The same type of conclusion turns out to hold true when one looks at the interplay between countries’ distance to the world technology frontier and “openness”. Using a cross-country panel of more than 100 countries over the 1960-2000 period, Acemoglu, Aghion and Zilibotti (2002), henceforth AAZ, regress the average growth rate over a five year period on a country’s distance to the U.S. frontier (measured by the ratio of GDP per capita in that country to per capita GDP in the U.S.) at the beginning of the period. Then, splitting the sample of countries in two groups, corresponding respectively to a high and a low openness group according to Frankel-Romer’s (1999) openness indicator, AAZ show that average growth decreases more rapidly as a country approaches the world frontier when openness is low. Thus, while a low degree of openness does not appear to be detrimental to growth in countries far below the world frontier, it becomes increasingly detrimental to growth as the country approaches the frontier. AAZ repeat the same exercise using entry costs to new firms (measured as in Djankov et al. (2002)) instead of openness, and they obtain a similar conclusion, namely that high entry costs are most damaging to growth when a country is close to the world frontier, unlike in countries far below the frontier.
In this section, we shall argue that Gerschenkron’s idea of “appropriate institutions” can be easily embedded into our growth framework, in a way that can help substantiate the following claims:
1.
Different institutions or policy designs affect productivity growth differently depending upon a country’s or sector’s distance to the technological frontier.2. A country’s distance to the technological frontier affects the type of organizations we observe in this country (e.g., bank versus market finance, vertical integration versus outsourcing, etc.).
The remaining part of the section is organized as follows. We first describe the growth equation which AAZ introduce to embed the notion of “appropriate institutions” into the Schumpeterian growth framework. We then focus on the first question about the effects of institution design on productivity growth, by concentrating on the relationship between growth and the organization of education. Finally, we briefly discuss the effects of distance on equilibrium institutions in a concluding subsection.
6.2. A simple model of appropriate institutions
Now dividing both sides of (25) by At, using the fact that 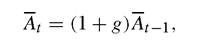 and integrating over all intermediate sectors i, we immediately obtain the following linear relationship between the country’s distance to frontier at at date t and the distance to frontier at _ 1 at date t — 1:

This equation clearly shows that the relative importance of innovation for productivity growth, increases as: (i) the country moves closer to the world technological frontier, i.e. as at_1 moves closer to 1, whereas imitation is more important when the country is far below the frontier, i.e. when at_1 is close to zero; (ii) a new technological revolution (e.g., the ITC revolution) occurs that increases the importance of innovation, i.e.
increases γ.This immediately generates a theory of “appropriate institutions” and growth: suppose that imitation and innovation activities do not require the same institutions. Typically, imitation activities (i.e. η in Equation (26)) will be enhanced by long-term investments within (large) existing firms, which in turn may benefit from long-term bank finance and/or subsidized credit. On the other hand, innovation activities (i.e. γ) require initiative, risk-taking, and also the selection of good projects and talents and the weeding out of projects that turn out not to be profitable. This in turn calls for more market-based and flexible institutions, in particular for a higher reliance on market finance and speculative monitoring, higher competition and trade liberalization to weed out the bad projects, more flexible labor markets for firms to select the most talented or best matched employees, non-integrated firms to increase initiative and entrepreneurship downstream, etc. It then follows from Equation (26) that the growth-maximizing institutions will evolve as a country moves towards the world technological frontier. Far below the frontier, a country will grow faster if it adopts what AAZ refers to as investment-based institutions or policies, whereas closer to the frontier growth will be maximized if the country switches to innovation-based institutions or policies.
A natural question is of course whether institutions actually change when they should from a growth- (or welfare-) maximizing point of view, in other words how do equilibrium institutions at all stages of development compare with the growth-maximizing institutions? This question is addressed in details in AAZ, and we will come back to it briefly in the last subsection.
6.3. Appropriate education systems
In his seminal paper on economic development, Lucas (1988) emphasized the accumulation of human capital as a main engine of growth; thus, according to the analysis in that paper, cross-country differences in growth rates across countries are primarily attributable to differences in rates of accumulation of human capital.
An alternative approach, pioneered by Nelson and Phelps (1966), revived by the Schumpeterian growth literature,31 would instead emphasize the combined effect of the stock of human capital and of the innovation process in generating long-run growth and fostering convergence. In this alternative approach, differences in growth rates across countries are mainly attributable to differences in stocks of human capital, which in turn condition countries’ ability to innovate or adapt to new technologies and thereby catch up with the world technological frontier. Thus, in the basic model of Section 2, the equilibrium R&D investment and therefore the steady-state growth rate were shown to be increasing in the aggregate supply of (skilled) labor L and in the productivity of research λ, both of which refer more to the stock and efficiency of human capital than to its rate of accumulation.Now, whichever approach one takes, and the evidence so far supports the two approaches as being somewhat complementary, one may worry about growth models delivering too general a message, namely that more education is always growth enhancing. In this subsection we try to go one step further and argue that the AAZ specification (summarized by Equation (25)), can be used to analyze the effects, not only of the total amount of education, but more importantly of the organization of education, on growth in countries at different stages of development.
This subsection, which is based on Aghion, Meghir and Vandenbussche (2003),32 henceforth AMV, focuses on one particular aspect of the organization of education systems, namely the mix between primary, secondary, and higher education. We consider a variant of the AAZ model outlined in the previous subsection, in which innovation requires highly educated labor, whereas imitation can be performed by both, highly educated and lower-skill workers. A main prediction emerging from this model, is that the closer a country gets to the world technology frontier, the more growth-enhancing it becomes to invest in higher education.
In the latter part of the subsection we confront this prediction with preliminary cross-country evidence.6.3.1. Distance to frontier and the growth impact of higher education
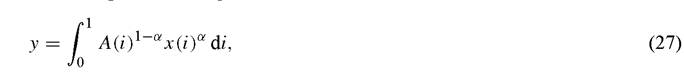
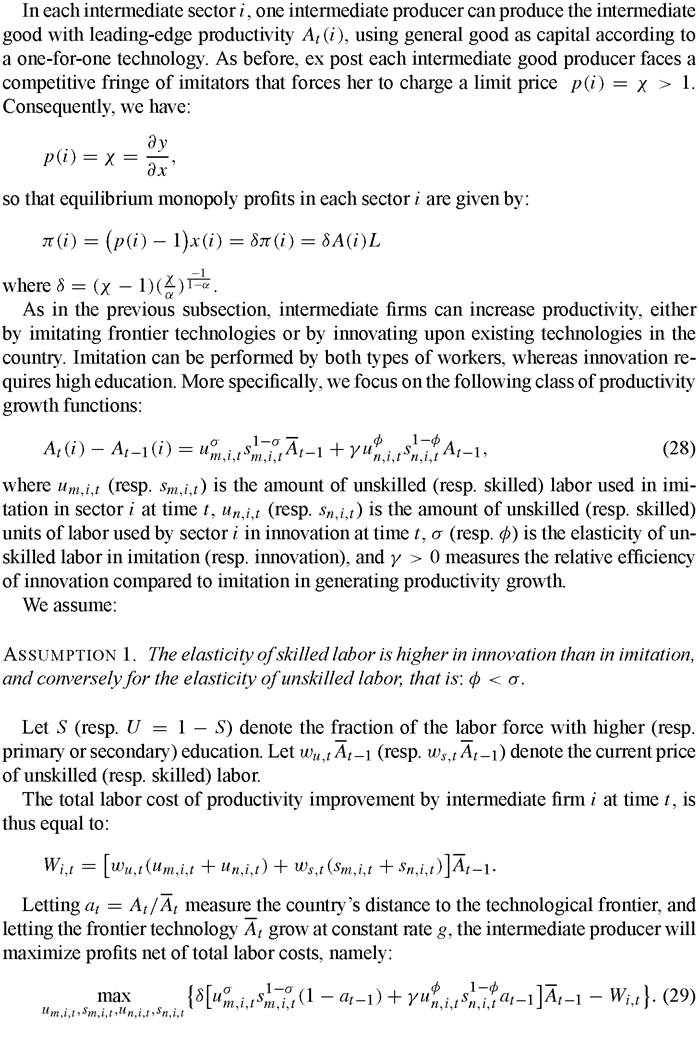
There is again a unique general good, produced competitively using a continuum of intermediate inputs according to:
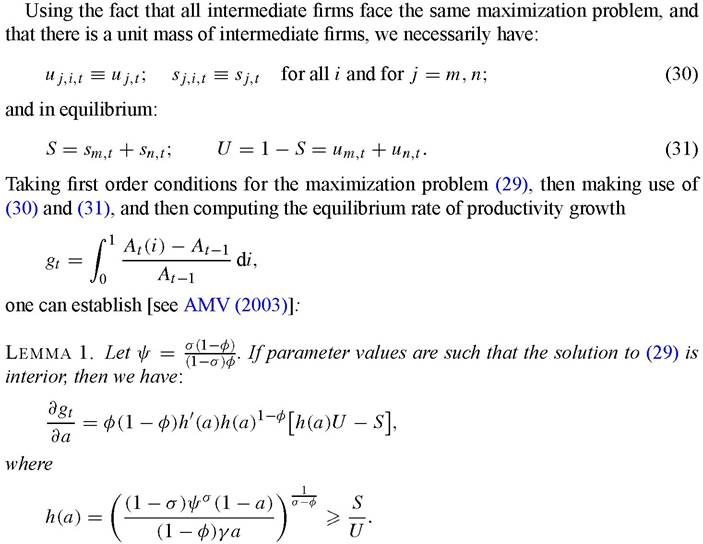
This, together with the fact that h(a) is obviously decreasing in a given our Assumption 1, immediately implies:
Proposition 1. A marginal increase in the fraction of labor with higher education, enhances productivity growth all the more the closer the country is from the world technology frontier, that is:

The intuition follows directly from the Rybczynski theorem in international trade. Stated in the context of a two sector-two input economy, this theorem says that an increase in the supply of input in the sector that uses that input more intensively, should increase “output” in that sector more than proportionally. To transpose this result to the context of our model, consider the effect of an increase in the supply of skilled labor, keeping the supply of unskilled labor fixed and for given a. Given that skilled workers contribute relatively more to productivity growth and profits if employed in innovation rather than in imitation (our Assumption 1), the demand for additional skilled labor will tend to be higher in innovation. But then the marginal productivity of unskilled labor should also increase more in innovation than in imitation, hence a net flow of unskilled workers should also move from imitation into innovation. This in turn will enhance further the marginal productivity of skilled labor in innovation, thereby inducing an ever greater fraction of skilled labor to move to innovation. Now the closer the country is to the technology frontier (i.e. the higher a), the stronger this Rybszynski effect as a higher a increases the efficiency of both, skilled and unskilled labor, in innovation relative to imitation. A second, reinforcing, reason is that an increase in the fraction of skilled labor reduces the amount of unskilled labor available in the economy, hence reducing the marginal productivity of skilled labor in imitation, all the more the closer the country is from the frontier.
We can now confront this prediction with cross-country evidence on higher education, distance to frontier, and productivity growth.
6.3.2. Empirical evidence
The prediction that higher education has stronger growth-enhancing effects close to the technological frontier can be tested using cross-regional or cross-country data. Thus VAMconsiderapaneldatasetof 19 OECD countries over the period 1960-2000. Output and investment data are drawn from Penn World Tables 6.1 (2002) and human capital data from Barro and Lee (2000). The Barro-Lee data indicate the fraction of a country’s population that has reached a certain level of schooling at intervals of five years, so VAM use the fraction that has received some higher education together with their measure of TFP (itself constructed assuming a constant labor share of 0.7 across countries) to perform the following regression:

where ggt is country j’s growth rate over a five year period, disjt-1 is country j’s closeness to the technological frontier at t — 1 (i.e. 5 years before), Λjt-1 is the fraction of the working age population with some higher education in the previous period and α0 j is a country dummy controlling for country fixed effects. The closeness variable is instrumented with its lagged value at t — 2, and the fraction variable is instrumented using expenditure on tertiary education per capita lagged by two periods, and the interaction term is instrumented using the interaction between the two instruments for closeness and for the fraction variables. Finally, the standard errors we report allow for serial correlation and heteroskedasticity.
The results from this regression are shown in Table 2. In particular, as long as we do not fully control for country fixed effects[34] we find a positive and significant interaction between our education measure and a country’s closeness to the frontier, as predicted by the theory in the previous subsection. This result demonstrates that it is more important for growth to expand years of higher education close to the technological frontier.
Table 2
TFP growth equation (fractions BL)
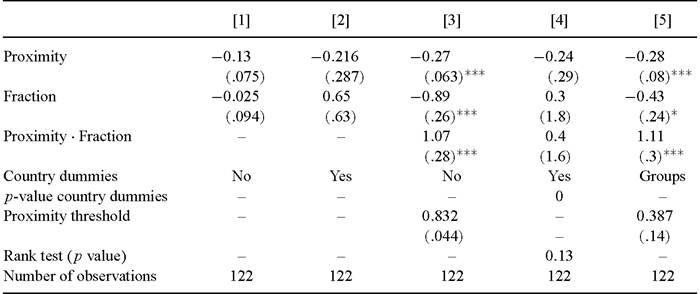
Note: standard errors in parentheses. Time dummies not reported. In column [5], countries are grouped in the following way: Group 1: Canada, New Zealand, USA; Group 2: Austria, Ireland, Italy, Norway, Portugal; Group 3: Belgium, Finland, France, United Kingdom; Group 4: Denmark, Netherlands, Spain, Sweden, Switzerland; Group 5: Australia. Proximity threshold indicates the value of Proximity above which Fraction is growth-enhancing. One, two and three indicate significance at the 10, 5 and 1% level, respectively.
7.
More on the topic Linking growth to institutional change:
- Normative Theories and Institutional Obligations and Rights
- The STEHD framework
- The Four Fundamental Causes
- Alternative Approaches
- The Effect of Institutions on Economic Growth
- The Effect of Institutions on Economic Growth
- References
- Approaches to Institutional Analysis
- THE THEORY AND PRACTICE OF EMPIRE-BUILDING