ANALYSIS AND RESULTS
To analyse the expanded scope of integrating CRM system for cross selling in banks, correlation matrix was established between the Cross
Table 1. Domain of the study along with the sample size
| Sectors | Name of the Banks | Sample Size in Case of Customer Questionnaire | Sector Wise Size | Sample Size in Case of Bank Officials Questionnaire | Sector Wise Size |
| Public Banks | SBI | 68 | 188 | 12 | 35 |
| PNB | 120 | 23 | |||
| Private Banks | ICICI Bank | 78 | 114 | 36 | 45 |
| HDFC | 36 | 9 | |||
| Foreign Banks | HSBC | 8 | 34 | 24 | 43 |
| Standard Chartered | 26 | 19 | |||
| Total | 336 | 336 | 123 | 123 | |
Table 2.
Reliability coefficients| Part of the Questionnaire | Number of Items | Cronbach Alpha |
| 1 | 41 | 0.646 |
| 2 | 17 | 0.602 |
Selling products (dependent variable) of the bank and the CRM practices (independent variable) being implemented by the bank to see the relationship among the variable (Table 3) and later on the impact of the independent variables on the dependent variable were also examined (details in Tables 4 through 10).
Based on the correlation matrix further the impact of independent variables on the individual dependent variables was examined using the regression. Table 11 provides the summary of the above correlation and regression matrix describing the percentage of contribution of cross selling products (dependent variable) and CRM tools (Independent variable).
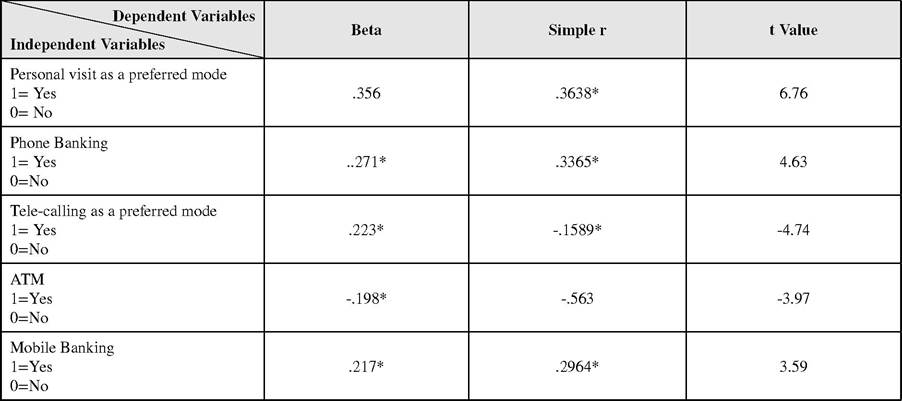
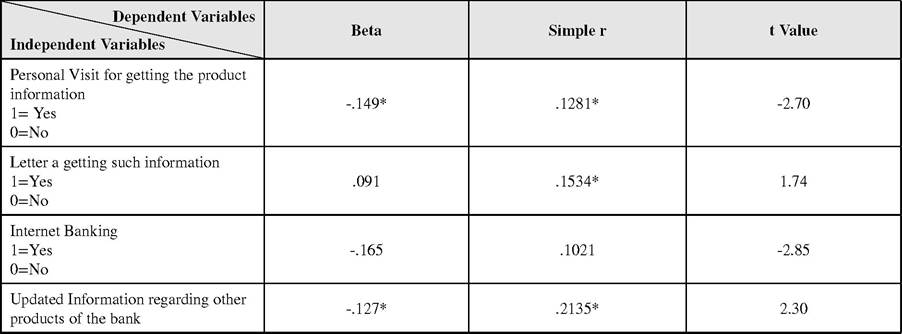
Inference: It has been observed by the above correlation and regression matrix that in Cross selling of home loan/auto loan (41%), personal visit followed by email, phone banking as a CRM tool had played a significant role. Trade account (22%) which seems a specialized product does not get affected by CRM initiatives. Products like trade account, is not that effective as stakeholders in such decisions are many. But opening up of trade account is now becoming the rich source of non - interest income of the bank where in Fixed Deposit (17%), Recurring Deposit (46%) got influenced by personal visit followed by email. So if banks focus on this aspect and use CRM tool more effectively as compared to current scenario then the bank can increase their revenue. 34% of the CRM tools help in selling Credit Card. Credit card is more profitable product of the bank. Banks can focus more on CRM tools for segmenting the customers. They can increase the use of this product by the customers and hence can increase the revenue in the form of non - interest income. 38% of the CRM tools help in selling Mutual Fund. Mutual Fund is more upcoming product of the bank. The banks can focus more on CRM tools for selling mutual funds as the Indian Market is increasing at a very fast pace. This will help them to increase the revenue in the form of non - interest income. 50% of the above CRM tools help in selling Locker facility. With the increase in the customer base and also for the security reason and increasing per capita income this product is more in demand. The increase in per capita income has further increased the demand of this service.
It is also evident that cross selling is more appropriate or justifiable in domain of retail banking/personal banking, due to decision making process as an individual is deciding on such proposals.Table 3. Relationship correlation coefficient of CRM system tools with the products of the bank (N= 336)
| Products CRM Tools | Auto/ Personal/ Home Loan | Trade Account | Fixed Deposit | Recurring Deposit | Credit Card | Mutual Fund | Locker Facility |
| ATM | .1360* | .0698 | .0205 | .1314* | -.0563 | -.0225 | .1314* |
| Internet Banking | .1630* | .0836 | -.0795 | .1575* | .1021 | .1348* | .1575* |
| Phone Banking | .3721* | .1909* | -.0055 | .1109* | .3365* | .1026 | .2352* |
| Mobile Banking | .1530* | .1754* | -.0758 | .0092 | .2964* | .1414* | .0092 |
| Updated Information regarding other products of the bank | .3436* | .0138 | .1108* | .1470* | .2135* | .2667* | .3892* |
| Tele-Calling | .0164 | .1601* | .0138 | .1005 | -.0150 | -.0369 | .0335 |
| .3097* | -.0138 | -.0107 | .1470* | .1669* | .0667 | -.0259 | |
| Letter | .2407* | .1369* | .1508* | .0974 | .1534* | .3386* | .4183* |
| Personal Visit | .1400* | .0000 | .3110* | .4671* | .1281* | .2286* | .3892* |
| Mode Preferred for Information by the Customers | |||||||
| Tele-calling | .0230 | -.1020 | -.0300 | .1024 | -.1589* | -.0658 | .1664* |
| .1060* | .0138 | .1895* | .2162* | .0505 | -.1333* | .0259 | |
| Letter | .3450* | .0534 | -.0534 | .1523* | .1654* | .4057* | .2345* |
| Personal Visit | .4567* | .2028* | .3129* | .5695* | .3638* | .4648* | .4757* |
*significant at.05
Table 4.
Determinants of auto personal/home loans (1 = Availed, 0=Not availed) N= 336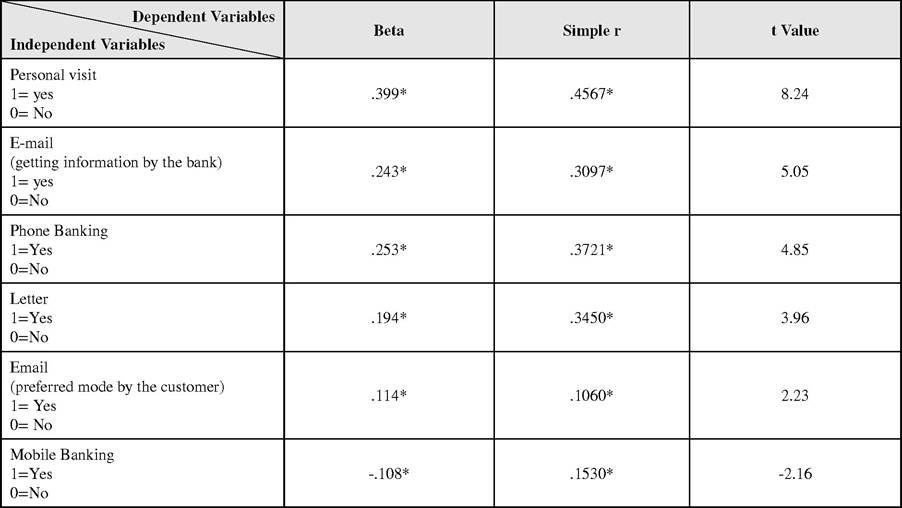
* Significance at.05; Multiple R=.64; R square =.41
Table 5. Determinants of trade account (1 = Availed, O=Not availed) N = 336
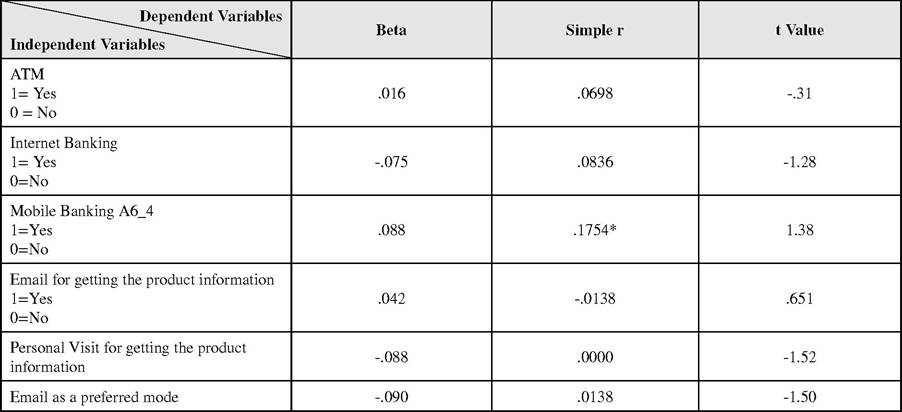
* Significance at.05; Multiple R=.46; R square =.22
Table 6. Determinants of fixed deposit (1 = Availed, 0=Not availed) N= 336
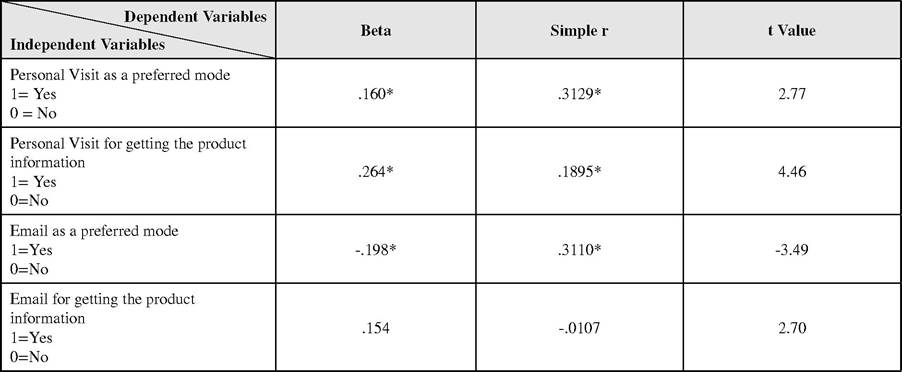
*significance at.05; Multiple R=.41; R square =.17
Further independent chi square tests were applied on cross selling products (dependent variable) and the CRM practices (independent variable) adopted by the bank to see the relationship among the groups (Tables 12 through 17).
Based on the statistics from Table 12, it has been observed that in case of Auto/personal/home loan, the results show that there is a significant difference as indicated by chi-square test (7.86) among the private, public and foreign banks with the significant level at.0197. It has been concluded that private banks are more efficient in granting the auto/personal/home loans. In case of Trade Account, the result shows that there is a significant difference as indicated by chi-square test (12.56) among the private, public and foreign banks
Table 7. Determinants of recurring deposit (1 = Availed, O=Not availed) N= 336
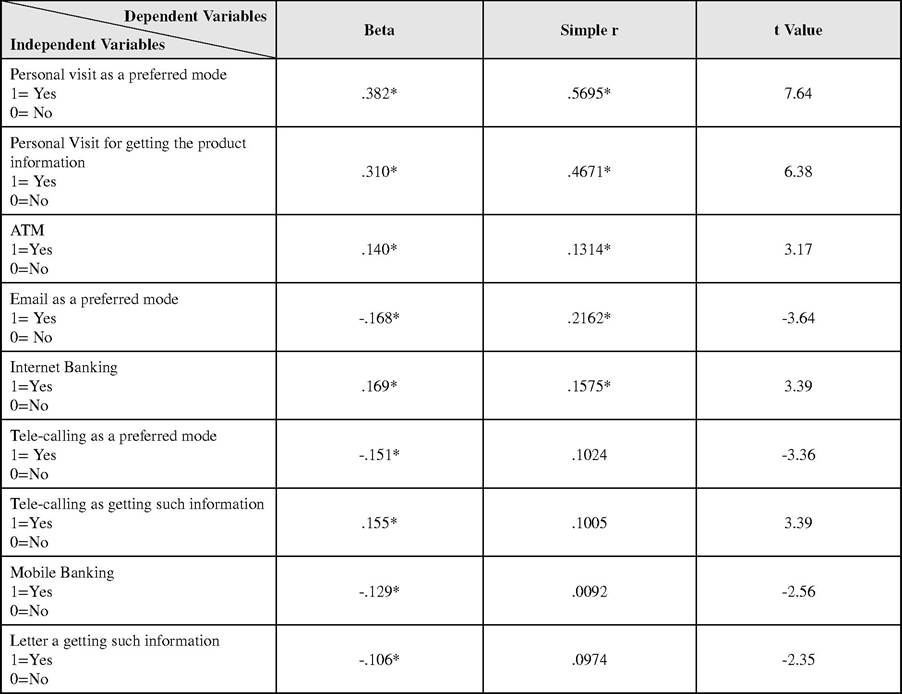
*significance at.05; Multiple R=.68; R square =.46
Table 8. Determinants of credit card (1 = Availed, 0=Not availed) N= 336
continued on following page
Table 8. Continued
*significance at.05; Multiple R=.58; R square =.34
Table 9.
Determinants of mutual fund (1 = Availed, 0=Not availed) N= 336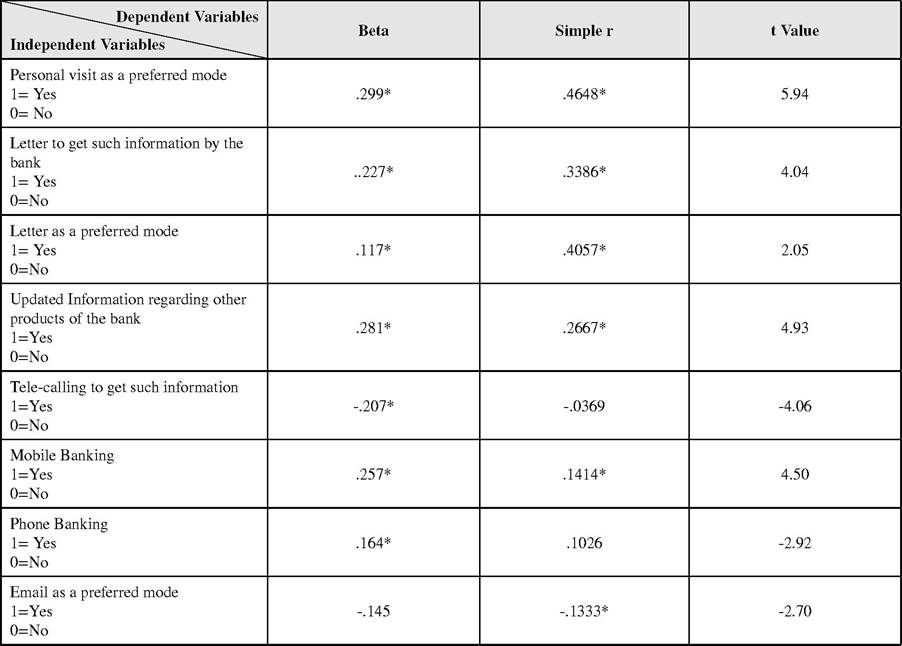
*significance at.05; Multiple R=.62; R square =.38
Table 10. Determinants of locker facility (1 = Availed, O=Not availed) N= 336
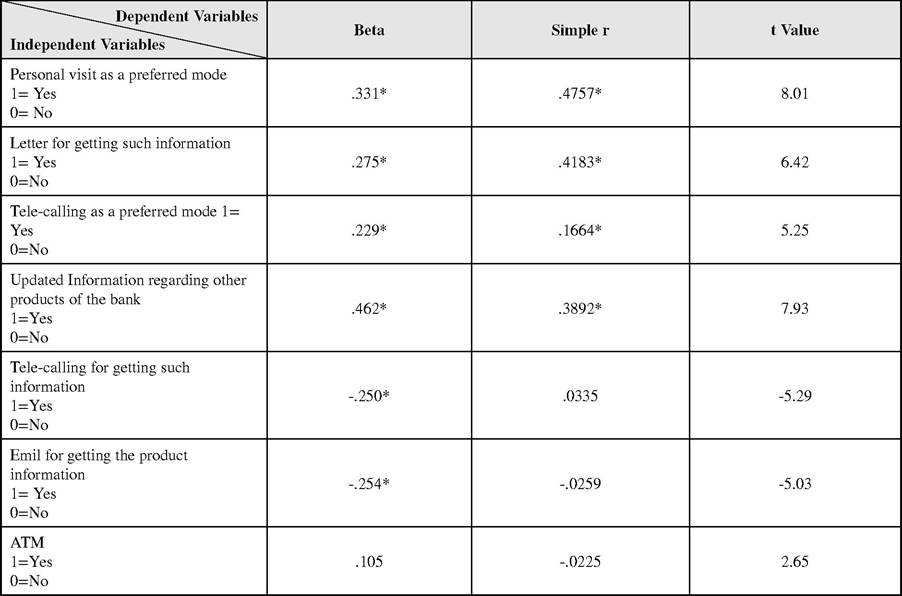
*significance at.05; Multiple R=.71; R square =.50
Table 11. Summary of the correlationn matrix (r2) describing the percentage of contribution of cross selling products (dependent variable) and CRM tools (independent variable)
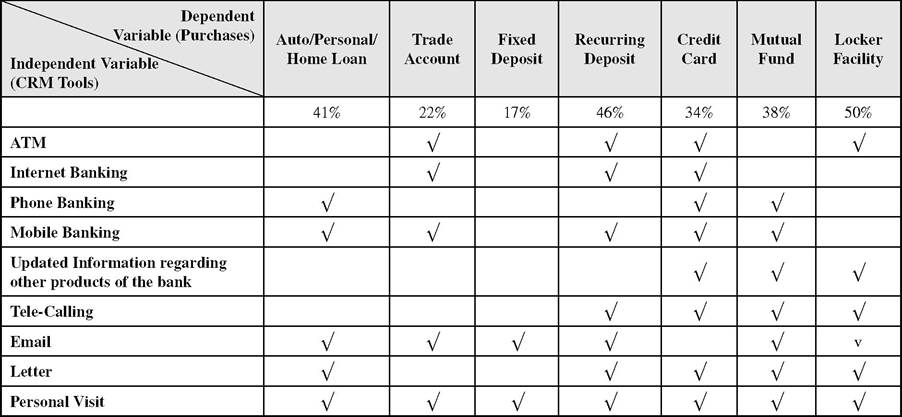
Table 12. Comparison of additional products availed by the customer among the groups
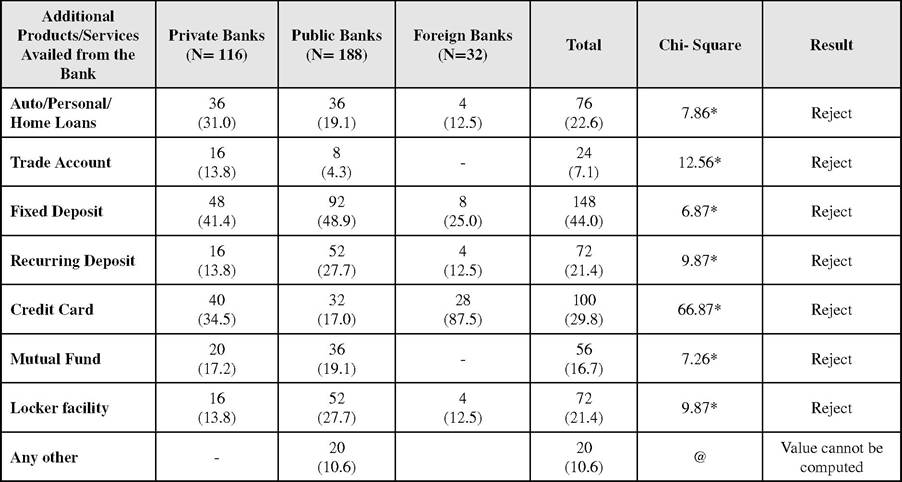
*significant at.05
@Chi square cannot be calculated for as the number of cells with expected frequency is less than five.
with the significant level at.001 that is to say that private banks are more efficient in granting the Trade Account followed by the public banks. The reason being that trade account has become the big business for private banks and they are making their employees to make more efforts in selling the trade accounts. In case of Fixed Deposit, the result shows that there is a significant difference as indicated by chi-square test (6.87) among the private, public and foreign banks with the significant level at.032. Public Sectors banks are better in Fixed Deposit because of the larger customer base and more trust by the public on retail front. Most of the time FD is purchased by the households, retired and their mind-set is always that the money is safe with the public banks. In case of Recurring Deposit, the result shows that there is a significant difference as indicated by chi-square test (9.87) among the private, public and foreign banks with the significant level at.007.
Again Public sector banks top the list as compared to the foreign banks and private banks with the same reason that people trust with the public banks and large number of customer base. Further, the credit card as a factor was examined; it has been found that there is a significant difference as indicated by chi-square test (66.87) among the private, public and foreign banks with the significant level at.0000. Credit card has been more availed by the customers of the private bank because of the easy availability and better access. Public sector banks have many requirements to fulfil before issue of credit cards. Foreign banks service charges are very high and the customer base is also not that high. In case of Mutual Fund, the result shows that there is a significant difference as indicated by chi-square test (7.26) among the private, public and foreign banks with the significant level at.026. Public Sector banks are better in mutual fund and out of the overall survey more of the customers availed the mutual fund facility from the foreign banks. The reason may be that either the foreign banks do not provide this facility or the customer like to purchase the mutual fund from the public banks because of trust. In case of Locker Facility the result shows that there is a significant difference as indicated by chi-square test (9.87) among the private, public and foreign banks with the significant level at.007. More of locker facilities are provided by the Public sector banks as compare to the private and foreign banks because of the large no of branches and more customer base of these banks.There is a significant difference (p =.000) in the service charges for the additional product paid by the customers. The service charges are more with the private sector banks and then to foreign sector banks. The public banks service charges are minimum as compare to other sectors (Table 13).
There is significant difference among the group with p=.000. From the survey it has been found that the service charges of the public sector banks are very reasonable as compared to the private sector and public sector banks (Table 14).
When awareness about the technological services provided by the bank viz. ATM, Internet Banking, Phone Banking and Mobile Banking were examined; the chi-square test showed the significant difference at.05 (Table 15).
Table 16 shows that email is the best preferred as mode or updated information regarding the additional product of the bank as compared to other modes. There is also significant difference among the tools based on the value of the chi square test.
Table 13. Comparison within the groups of any service charges for the additional products purchased from the banks
| Private Banks (N= 116) | Public Banks (N= 188) | Foreign Banks (N=32) | Total | Chi- Square | |
| Any Service Charges paid for the | 72 | 60 | 16 | 148 | 26.97* |
| additional product | (62.1) | (31.9) | (50.0) | (44.0) |
*significant at.05
Table 14. Comparison within the groups of difference in any service charges by the banks
| Factors | Private Banks (N= 116) | Public Banks (N= 188) | Foreign Banks (N=32) | Total | Chi Square |
| Higher | 44 | 4 | 8 | 56 | |
| (37.9) | (2.1) | (25.0) | (16.7) | ||
| Reasonable | 64 | 140 | 20 | 224 | 72.84* |
| (55.2) | (74.5) | (62.5) | (66.7) | ||
| Lesser | 8 | 44 | 4 | 56 | |
| (6.9) | (23.4) | (12.5) | (16.7) |
*significant at.05
Table 15. Awareness about the technological services provided by the bank
| Technological Services | Frequency | Percentage | Chi- Square | Result |
| ATM | 316 | 94.0 | 85.12* | Reject |
| Internet Banking | 308 | 91.7 | ||
| Phone Banking | 228 | 67.9 | ||
| Mobile Banking | 240 | 71.4 |
* Significant at.05
Table 16. Mode for updated information regarding product of the bank
| Mode for Updated Information | Frequency | Percentage | Chi - Square | Result |
| Tele-calling | 84 | 25 | 128.47* | Reject |
| 120 | 35.7 | |||
| Letter | 52 | 15.5 | ||
| Personal Visit | 56 | 16.7 |
*significant at.05
In this case the empirical analysis of all the banks says that to the great extent Information Technology has changed the banking operation and there is significant difference among the variables regarding the extent of use of IT services in banks (Table 17).
From the above mentioned inferences it can inferred that use of effective CRM tools helps banks selling their various products to their existing customer base. It also helps banks to deepen their relationship and also tie the customers with more threads of different services. This will give higher revenue on one side while on the other chances of attrition goes low.
A report published by rediff.com on Crossselling, the retail key (2004) says that SBI top brass has given the employees a heavy mandate to fulfil -- at least 50 per cent of all new customers of housing loans, car loans and tractor loans should be covered by SBI Life’s insurance products. It is not just insurance that is being given a major push. The banking behemoth’s management is also ensuring that adequate number of the branches sell the group’s mutual fund products and credit cards to push the total income. SBI is not alone. ICICI Bank, the country’s second largest bank after SBI, is also working on a similar strategy - to cross-sell products to its 10-million strong customer base. The bank today boasts of 50 per cent of its credit card sales coming from the bank’s depositor base and 25 per cent of home loans from the existing customers. According to ICICI Bank Deputy Managing Director, Kalpana Morparia- “We are aiming to sell 30-35 per cent of home loans in the coming year to our customers. Similarly, we hope to cross-sell credit cards to 60 per cent of the bank’s customers. With ICICI Bank’s huge customer base, cross-selling has become a reality.”
According to S Krishnamurthy, Chief Executive Officer, SBI Life, “We have been able to cover 50 per cent of borrowers of fresh home loans. Since December, we have underwritten about 1,200home loan proposals each month. Against SBI’s expectation of disbursing 200,000 home loans in fiscal 2005, we have targeted to cover 100,000 of these borrowers.” “SBI can expect a fee-based income of about INR 15 crore (INR 150 million) this fiscal, which will increase to INR 50 crore (INR 500 million) in 2004-05 and to over INR 300 crore (INR 3,000 million) in the coming years.”
Table 17. Extent of use of IT services in banks
| Frequency | % | Chi - Square | Result | |
| To a great extent | 106 | 86.2 | 156.49* | Reject |
| Up to some extent | 14 | 11.4 | ||
| Not to the required extent | 3 | 2.4 | ||
| Total | 123 | 100.0 |
*significant at.05
According to a recent market study, 87 per cent of Indian banks have made no attempt to crosssell or up-sell related banking products during the course of customer interaction. “Most of the time, even if customers are themselves enquiring about other bank products, 43 per cent of Indian banks have failed to respond to customers’ inquiries,”
Another report by McKinsey & Co, “Banks lack cross-selling capabilities at the branch level, partly as a result of lack of incentive and the fact that banking products have always been bought and not sold.”
HDFC Bank, relatively a smaller bank as compared to SBI and ICICI Bank, is seen as the third-largest cross-seller of mutual fund products. The entire push towards cross-selling is to increase fee-based income and enhance retail disbursements.
Some of the interesting facts have also been published regarding cross selling with respect to some individual banks taken as the sample:
• ICICI Bank aims at 35% home loans from bank customers;
• The private sector bank targets 60% sale of credit cards to bank customers;
• SBI targets 50% of retail loans to be insured;
• HDFC Bank third largest cross-seller of MFs.
For the analysis of this objective the secondary data source was used regarding interest and non-interest income of the sample banks. This is analysed in the Tables 18 through 22. Banks Compounded Annual Growth Rate (CAGR) of last 10 years of interest and non-interest income was also taken to analyse the growth of non- interest income viz. - viz. interest income.
Inference: It has been observed from Table 18 that the percentage of non-interest income has increased from 12.38 in 2001 to 14.44 in 2010 for PNB, 13.34 in 2001 to 18.36 in 2010 for SBI (average growth rate is 6% approximately for public sector), 15.45 in 2001 to 22.54 in 2010 for ICICI Bank, 12.92 in 2001 to 19.07 in 2010 for HDFC (average growth rate is 8% approximately for private sector) (Table 19), 23.07 in 2001 to 29.25 in 2010 for HSBC, 21.46 in 2001 to 36.75 in 2010 for Standard Chartered Bank (average
Table 18. Percentage of interest income viz. - viz: Non - interest income of the public banks (in INR Cr)
| Years | Public Sector | |||||||||
| PNB | SBI | |||||||||
| Total Income | Interest Income | Percentage | Non Interest | Percentage | Total Income | Interest Income | Percentage | Non Interest | Percentage | |
| 2010 | 25088.62 | 21422.09 | 85.39 | 3621.71 | 14.44 | 86960.52 | 70993.92 | 81.64 | 15966.6 | 18.36 |
| 2009 | 22.496.63 | 19127.22 | 85.02 | 3369.41 | 14.98 | 76482.74 | 63788.42 | 83.4 | 12694.31 | 16.6 |
| 2008 | 16291.48 | 14265.02 | 87.56 | 2026.46 | 12.44 | 58437.42 | 48950.31 | 83.77 | 9487.11 | 16.23 |
| 2007 | 13168.85 | 11236.14 | 85.32 | 1932.71 | 14.68 | 44671.37 | 37242.33 | 83.37 | 7429.04 | 16.63 |
| 2006 | 11485.15 | 9584.15 | 83.45 | 1901 | 16.55 | 43507.73 | 35979.57 | 82.7 | 7528.16 | 17.3 |
| 2005 | 10646.21 | 8459.85 | 79.46 | 2186.36 | 20.54 | 39549.73 | 32428 | 81.99 | 7121.73 | 18.01 |
| 2004 | 9836.11 | 7778.95 | 79.09 | 2047.16 | 20.91 | 38131.55 | 30460.49 | 79.88 | 7671.06 | 20.12 |
| 2003 | 8812.17 | 7485.01 | 84.94 | 1327.16 | 15.06 | 37541.38 | 31087.02 | 82.81 | 6454.36 | 17.19 |
| 2002 | 7733.76 | 6647.87 | 85.96 | 1085.89 | 14.04 | 34061.76 | 29810.09 | 87.52 | 4251.67 | 12.48 |
| 2001 | 6692.19 | 5863.48 | 87.62 | 828.71 | 12.38 | 30161.82 | 26138.59 | 86.66 | 4023.23 | 13.34 |
| CAGR | 13.94 | 13.88 | 15.82 | 10.83 | 10.12 | 12.49 | ||||
Source: Capital Line
growth rate is 11% approximately for foreign sector) (Table 20). Non - interest income has been garnered by product of third party as mutual funds, credit cards and by providing advisory services to customer on various financial and non-financial sectors as Reality services, Trade advisory etc. It has been observed that private banks due to their latest product offering and rich experience in advisory services take a lead in this segment viz. - viz. public sector counterparts. When CAGR of interest income and non-interest income are compared, it clearly indicates that banks having focused on cross selling get substantial growth on non-interest income and also it helps growing their book on lending side and borrowing side, hence increases interest income as well. Leading banks in CRM implementation like ICICI bank has shown CAGR of 31.73% in interest income growth as cross selling help acquiring new customers for interest income from other channels as well. It simply states that by use of cross selling bank can leverage synergy between various channels and be more efficient and productive. This has a significant impact on profitability.
Table 19. Percentage of interest income viz. - viz: Non - interest income of the private banks (in INR Cr)
| Years | Private Sector | |||||||||
| ICICI | HDFC | |||||||||
| Total Income | Interest Income | Percentage | Non Interest | Percentage | Total Income | Interest Income | Percentage | Non Interest | Percentage | |
| 2010 | 33187.23 | 25706.93 | 77.46 | bgcolor=white>7480.322.54 | 19983.52 | 16172.72 | 80.93 | 3810.62 | 19.07 | |
| 2009 | 39268.81 | 31092.55 | 79.18 | 8176.26 | 20.82 | 19802.9 | 16332.26 | 82.47 | 3470.64 | 17.53 |
| 2008 | 39667.19 | 30788.34 | 77.62 | 8878.85 | 22.38 | 12398.15 | 10115 | 81.58 | 2283.15 | 18.42 |
| 2007 | 28958.54 | 21995.59 | 75.96 | 6962.95 | 24.04 | 8242.52 | 6647.93 | 80.65 | 1594.59 | 19.35 |
| 2006 | 19368.35 | 14306.13 | 73.86 | 5062.22 | 26.14 | 5688.98 | 4475.35 | 78.67 | 1213.64 | 21.33 |
| 2005 | 12949.56 | 9409.89 | 72.67 | 3539.67 | 27.33 | 3824.57 | 3093.49 | 80.88 | 731.08 | 19.12 |
| 2004 | 12069.22 | 9002.39 | 74.59 | 3066.83 | 25.41 | 3040.32 | 2548.93 | 83.84 | 491.39 | 16.16 |
| 2003 | 12533.38 | 9368.06 | 74.74 | 3165.32 | 25.26 | 2481.29 | 2013.61 | 81.15 | 467.68 | 18.85 |
| 2002 | 2762.27 | 2151.93 | 77.9 | 610.34 | 22.1 | 2037.05 | 1702.99 | 83.6 | 334.06 | 16.4 |
| 2001 | 1469.09 | 1242.13 | 54.55 | 226.96 | 15.45 | 1446.33 | 1259.46 | 87.08 | 186.87 | 12.92 |
| CAGR | 31.82 | 31.73 | 41.4 | 29 | 28.42 | 33.88 | ||||
Source: Capital Line
Table 20. Percentage of interest income viz. - viz: Non - interest income of the foreign banks (in INR Cr)
| Years | Foreign Sector | |||||||||
| HSBC | Standard Chartered | |||||||||
| Total Income | Interest Income | Percentage | Non Interest | Percentage | Total Income | Interest Income | Percentage | Non Interest | Percentage | |
| 2010 | 7301.36 | 5165.88 | 70.75 | 2135.48 | 29.25 | 8972.57 | 5674.89 | 63.25 | 3297.68 | 36.75 |
| 2009 | 9026.35 | 6326.93 | 70.09 | 2699.42 | 29.91 | 8880.28 | 5649.41 | 63.62 | 3230.87 | 36.38 |
| 2008 | 7153.3 | 4979.22 | 69.61 | 2174.08 | 30.39 | 7302.43 | 4878.06 | 66.8 | 2424.37 | 33.2 |
| 2007 | 4994.04 | 3507.93 | 70.24 | 1483.11 | 29.76 | 5804.13 | 4046.18 | 69.71 | 1757.95 | 30.29 |
| 2006 | 3379.04 | 2201.93 | 65.16 | 1177.11 | 34.84 | 4204.43 | 3056.35 | 72.69 | 1148.08 | 27.31 |
| 2005 | 2373.9 | 1626.83 | 68.53 | 747.07 | 31.47 | 3276.08 | 2492.95 | 76.1 | 783.13 | 23.9 |
| 2004 | 2119.34 | 1413.97 | 66.72 | 705.37 | 33.28 | 3222.55 | 2523.19 | 78.3 | 699.36 | 21.7 |
| 2003 | 1969.09 | 1480.08 | 75.17 | 489.01 | 24.83 | 2847.49 | 2286.96 | 80.31 | 560.53 | 19.69 |
| 2002 | 1979.04 | 1499.47 | 75.77 | 479.57 | 24.23 | 2161.35 | 1644.78 | 76.1 | 516.57 | 23.9 |
| 2001 | 1716.27 | 1320.38 | 76.93 | 395.89 | 23.07 | 1427.82 | 1121.46 | 78.54 | 306.36 | 21.46 |
| CAGR | 17.45 | 16.37 | 17.45 | 22.66 | 19.74 | 22.66 | ||||
Source: Capital Line
For Non-interest income existing customers are the easiest segment for the advisory services and helps banks to increase their share of wallet from customers. The same can be done by using CRM tools and cross sell to the existing customers. As it can be observed from data that trade account has maximum penetration of 16% in private sector banks, credit card is as highest 40% in private sector banks where in FD and RD are more in public sector bank.
The fact has also been verified by the data collected from the survey whether cross selling of banking services and products have increased the share of non-interest income of banks (Table 21).
This has also been confirmed from the bank officials’ survey as well. 88.9% of the private sectors bank employees stated that by cross selling different products to existing customer base, their non- interest income has increased viz. - viz. 77.1% bank employee think on the similar line. Whereas in foreign sector bank, 100% employees think that cross selling of banking services and products have increased the share of non-interest income of the branch. There is also a significant difference among the groups as the value of the chi square (10.68) is significant at.05 (Table 21).
Thus it can be inferred that CRM has helped increased turnover in services provided by the bank and thus augment the not - interest income of the banks.
Same can be further more analysed by Business per employee and Profit per Employee (See Table 22), it is evident that foreign banks leads the pack with highest profit per employee and even private banks with similar level of business levels have far more profitability per employee.
These higher levels of profitability are generated by cross selling various products to existing customer base. It can be achieved by implementing effective CRM tools and focus on Cross selling.
Cross selling is decade old concept in developed countries which was introduced in India by foreign banks later successfully implemented by new age private banks as ICICI and HDFC bank. As per above table Standard Chartered and HSBC shown excellent performance in beginning and later banks like ICICI who focussed on cross selling and offering various products to their customer by becoming Universal Banks their efficiency had shown remarkable growth. Wherein PSU took this concept late due to lack of computerization
Table 21. Do you agree that cross selling of banking services and products have increased the share of non-interest income of your branch?
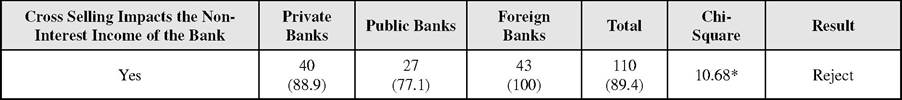
*significant at.05
429
Table 22. Business per employee and profit per employee of different groups of banks (empty cells indicate no data)
| Year | Business per Employee | Profit per Employee | ||||||||||
| Private Banks | Public Banks | Foreign Banks | Private Banks | Public Banks | Foreign Banks | |||||||
| HDFC Bank | ICICI Bank | Punjab National Bank | State Bank of India | HSBC | Standard Chartered | HDFC Bank | ICICI Bank | Punjab National Bank | State Bank of India | HSBC | Standard Chartered | |
| 2011 | 6.53 | 7.35 | 10.18 | 7.05 | 12.22 | 13.46 | 0.07 | 0.1 | 0.08 | 0.04 | 0.23 | 0.26 |
| 2010 | 5.9 | 7.65 | 8.08 | 6.36 | 11.36 | 10.83 | 0.06 | 0.09 | 0.07 | 0.04 | 0.12 | 0.26 |
| 2009 | 4.46 | 11.54 | 6.55 | 5.56 | 9.62 | 9.72 | 0.04 | 0.11 | 0.06 | 0.05 | 0.16 | 0.24 |
| 2008 | 5.06 | 10.08 | 5.05 | 4.56 | 10.12 | 8.17 | 0.05 | 0.1 | 0.04 | 0.04 | 0.17 | 0.2 |
| 2007 | 6.07 | 10.27 | 4.07 | 3.57 | 9.8 | 9.24 | 0.06 | 0.09 | 0.03 | 0.02 | 0.14 | 0.2 |
| 2006 | 7.58 | 9.05 | 3.31 | 2.99 | 9.76 | 8.37 | 0.07 | 0.1 | 0.02 | 0.02 | 0.12 | 0.15 |
| 2005 | 8.06 | 8.8 | 2.77 | 2.43 | 8.53 | 7.86 | 0.09 | 0.11 | 0.02 | 0.02 | 0.1 | 0.12 |
| 2004 | 8.66 | 10.1 | 2.28 | 2.1 | 8.21 | 7.8 | 0.09 | 0.12 | 0.02 | 0.02 | 0.06 | 0.13 |
| 2003 | 8.65 | 11.2 | 1.96 | 1.91 | 6.23 | 4.81 | 0.1 | 0.11 | 0.01 | 0.01 | 0.05 | 0.25 |
| 2002 | 7.78 | 4.86 | 1.68 | 1.73 | 5.96 | 0.1 | 0.05 | 0.01 | 0.01 | 0.05 | ||
| 2001 | 6.43 | 8.15 | 1.42 | 1.37 | 0.09 | 0.1 | 0.01 | 0.01 | ||||
| 2000 | 9.22 | 8.3 | 1.06 | 1.11 | 0.1 | 0.11 | 0.63 | 0.01 | ||||
| 1999 | 5.22 | 5.14 | bgcolor=white>0.94 | 0.1 | 0.07 | |||||||
| 1998 | 4.6 | 4.2 | 0.76 | 0.75 | 0.1 | 0.08 | 0.01 | 0.01 | ||||
| 1997 | 3.61 | 3.74 | 0.65 | 0 | 0.08 | 0.09 | 0 | |||||
Source: Capital Line
Enhancement of Efficiency and Effectiveness in Banking through CRM Systems
and awareness of cross selling but later when they arrived on Core banking System (CBS) platform they started picking on selling various other financial and insurance products to their customers hence giving boost to their non- interest income. Profit per employee has shown remarkable growth from.02 to.08 from 2006 to 2011 in case of PNB who led the PSU pack as taken lead in computerization and tie-up with various Insurance companies for cross selling. By increase in non-interest income (fee revenue), banks had also shown remarkable growth in profit after taxes.
To support the primary data analysis similar related studies with respect to the hypothesis mentioned above has been conducted by different researcher in this regard which is discussed as follows.
A study by Vijay Kumar (2008-09) says that banks also make use of opportunity of cross selling to improve profitability and tapping untapped opportunities in retail segment as retail income continues to grow. There is an immense opportunity for the banks to raise the fee based income.
Mr. K V Kamath Chairman, ICICI Bank Ltd. Stated on cross selling at the time of ICICI bank and ICICI Ltd merger. He has shown how ICICI can really compete with international giants like HSBC and Citigroup, which have bigger clout and financial muscle. The statistics show that the merged entity will have a combined customer base of ten million(six million bond customers and rest bank customers), 390 ATM’s, 150,000 credit card holders, 536 bank branches, 500,000 Internet banking accounts, seven distribution channels an head count of 8,300 employees. He further added that one of the biggest advantages stemming from the new merger will be the ability to cross sell a slew of retail products, such as housing loans, car loans, personal finance and credit cards, reducing that share of projects loans from 70 to 50% of the business,. “Further, the merged entity will be able to compete with any threat from global players I see coming to India, he says, as if he had won the war before it began.
According to him, “This merger will awaken wannabe universal banks in to action. It’s now or never for the global banking giants (HSBC and Citigroup) to push them in the Indian retail market. Now they will find it impossible to penetrate into the domestic market.”
More on the topic ANALYSIS AND RESULTS:
- The Netherlands and the UK: The Witteveen Reports and their contradictory results
- Abrams Peter A.. Competition Theory in Ecology. Oxford University Press,2022. — 336 p., 2022
- The Idiomorphic Constitution of Cyprus
- OUTSOURCING RISK IN E-BANKING
- 8 The Keynesian Model of Income Determination in a Four Sector Economy: Introduction of the Foreign Sector
- FIVE COMPONENTS OF LEGAL COMPETENCIES
- Conflict is ubiquitous in human affairs.
- REVIEW OF FORENSIC ASSESSMENT INSTRUMENTS
- XAT 2009
- CASE 145: Periods of Gestation