THE DU PONT FORMULA
The preceding discussion of sustainable growth introduced a formula that provided insight into earnings per share by disaggregating it into several simple financial ratios.
Disaggregation can be applied in other beneficial ways in equity analysis, most notably in a technique known as the Du Pont Formula. (The idea is generally credited to Donaldson Brown, who developed the formula while at E. I. du Pont de Nemours, then applied it during the 1920s as vice president of finance at General Motors.) With the aid of the Du Pont Formula, the analyst can more readily perceive the sources of a firm’s return on assets:Asset turnover × Return on sales = Return on assets
![]()
Like most ratio analysis, the Du Pont Formula is valuable not only for the questions it answers but also for the new ones it raises. If a company raises its return on assets by finding ways to reduce working capital without impairing competitiveness (thereby improving asset turnover), then it is likely to be able to p erform at the higher level. On the other hand, cutting back on necessary capital expenditures will also have a positive effect—in the short run—on return on assets. Not only will the denominator decline in the asset turnover factor as a result of depreciation, but return on sales will rise as future depreciation charges are reduced by lower capital outlays in the current year. Underspending will eventually hurt competitiveness, and therefore the company’s long-run return on assets, so analysts must probe to determine the true nature of shifts in these ratios.
A Du Pont analysis of the food processing industry (Exhibit 14.7) confirms the value of examining the components of return on equity.
Based on ROE alone, Conagra (13.93%) and Kraft Foods (14.24%) look very similar. They achieved those numbers by very different methods, however. Conagra, a more commodity-oriented company, worked on a narrower sales margin (1.63% vs. 7.54% for Kraft), but turned over its assets much more frequentlyEXHIBIT 14.7 Du Pont Analysis of Food Processing Industry’s 2000 Results*
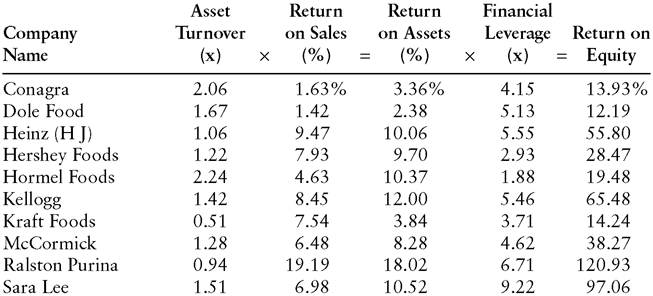
*Calculations are subject to rounding error.
(2.06X vs. 1.28X). McCormick appears to be far more profitable than Hershey Foods, based on the companies’ respective returns on equity of 38.27% and 28.47%. That advantage resulted entirely from more aggressive financial leverage (4.62X for McCormick vs. Hershey’s 2.93X, the second most conservative ratio in the industry). Hershey’s return on sales and, consequently, its return on assets were substantially higher than McCormick’s corresponding figures. The analysis shows investors that to benefit from McCormick’s higher return on equity, they must assume more financial risk than they would expose themselves to by owning the stock of Hershey Foods.
Some of the companies in Exhibit 14.7 achieved returns on equity that seem absurdly high, with Sara Lee at 97.06% and Ralston Purina at 120.93%. In part, those results reflected the two companies’ employment of the highest financial leverage within the industry. In addition, the extremely high ROEs derived from the companies’ very low levels of book value. As producers of branded food products, Sara Lee and Ralston Purina derive their equity value primarily from the consumer acceptance of well-known brands, rather than the physical plants in which they produce their goods.
On June 30, 2001, Ralston Purina’s stock closed at $30.02 a share, yet its book value was only $2.36 a share. The company’s return on equity looks less stratospheric when equity is viewed in terms of market capitalization rather than historical cost (see “Pros and Cons of a Market-Based Equity Figure” in Chapter 2).The Modified Du Pont Formula
Carrying the disaggregation technique a step further, the Modified Du Pont Formula analyzes the sources of return on shareholders’ investment:
Return on assets × Financial leverage = Return on equity
![]()
As noted, the stock market will ordinarily value earnings at lower multiples than they would otherwise command if the earnings were subject to unusual risks. Financial risk, as signified by financial leverage, is one consideration that may penalize a company’s P/E ratio. Generally speaking, an analyst will respond more favorably to a firm that raises its return on equity by increasing its return on assets than one that does so by leveraging its equity more aggressively. Besides introducing greater volatility into the rate of
return, adding debt to the balance sheet demonstrates no management skill in improving operations. Furthermore, a company that has already fully utilized its debt capacity has no additional potential for increasing its return on equity by the same means. A somewhat underborrowed company, on the other hand, has hidden profitability potential that may be exploited (with concomitant benefits to shareholders) at a later point. The Modified Du Pont Formula enables investors to judge the quality of a company’s return on equity in much the same way that other financial tests can be applied to the quality of earnings.
More on the topic THE DU PONT FORMULA:
- Determining the value driver of value-based management using Du Pont extended formula in retail companies in digital marketing era
- Reciting the Opening Formula Aloud (al-Jahr bi'l-Basmala)
- What is the Steinmeier Formula, and why did it become a stumbling block in the peace process?
- Chapter 1 From Metaphysics, book 7, and On the Soul, book 2 Aristotle
- 2 Excluding Statutory Rent Reviews
- In this chapter, we shall be investigating the interaction of metaphysical modalities with vagueness.
- Legacy
- Drug prescription in pediatrics is a complex issue, considering major differences in pharmacokinetics and pharmacodynamics of various drugs and formulations between adults and children.
- CASE 124: Business Managers
- VALUATION THROUGH RESTRUCTURING POTENTIAL
- North Africa, Maghreb