POLARIZATION IN PRACTICE
A few empirical studies on polarization have been conducted both to illustrate the use of the various indices that have been proposed and to motivate the study of polarization (by looking at the links between polarization, inequality, and conflict, for instance).
We end this chapter with brief remarks on such empirical evidence: first, on the links between polarization and inequality; second, on polarization comparisons; and finally, on the linkages between polarization and conflict.5.9.1 Polarization and Inequality
Wolfson (1994) empirically investigated the divergence between inequality and bipolarization using time-series data from the Canadian Surveys of Consumer Finance from 1967 to 1991. Although inequality and polarization often move in the same direction, from 1973 to 1981 they diverged.
Chakravarty and Majumder (2001) used Indian household expenditure survey data for 1987-1988 and 1993-1994 to compare inequality and polarization across time, states, and rural and urban areas. In some states in rural India, overall inequality decreased. The inequality ranking of states is unchanged between the two periods, but polarization rankings do vary. In some states, polarization and inequality moved in opposite directions regardless of polarization parameter values, reinforcing the view that polarization and inequality can behave differently.
Using data come from 28 Chinese provinces between 1983 and 1995, Zhang and Kanbur (2001) found that, contrary to other earlier empirical evidence, polarization measures do not generate significantly different results from standard measures of inequality. Polarization and inequality measures agree broadly over the period considered. This motivates them to consider a measure of socioeconomic polarization ZK, which they find empirically useful to examine the case of the United States, where socioeconomic polarization appears to exist between blacks and whites, and the case of China, where differences between rural and urban as well as between coastal and inland groups are important.
Some of the most extensive empirical evidence on the association between inequality and polarization can be found in Duclos et al. (2004). DER analyze polarization using several waves of LIS data from 21 countries. Their empirical analysis shows that polarization is empirically different from inequality. DER(α = 0) and the Gini index are by definition identical. When α = 0.25, the Gini coefficient and the polarization index yield similar rankings. The correlation between inequality and polarization rankings falls when the polarization parameter α increases. Much of the reordering of countries as α increases to 1 occurs at low values of α. Rank differences between the Gini coefficient and the polarization index are important when α = 1, with a Pearson rank correlation coefficient often lower than 0.7.
Figure 5.24 shows the Duclos et al. (2004) estimates for α = 1 and for the 21 countries of LIS Wave 3. For these countries, a linear regression of inequality on polarization yields an R2 of 0.8—understandably large but not perfect. The Czech Republic has the lowest Gini index of all countries, but ranks 11 out of 21 in terms of polarization. Conversely, Canada, Australia, and the United States exhibit large inequality, but relatively low polarization. The bulk of cross-country variation in polarization comes both from a significant variation in average identification and from variability in average alienation (and not from the covariance between identification and alienation—recall the discussion at the end of section 4.2); this explains why inequality and polarization are correlated but still empirically quite different. The United Kingdom and the United States also provide an interesting comparison. Both have a similar level of average
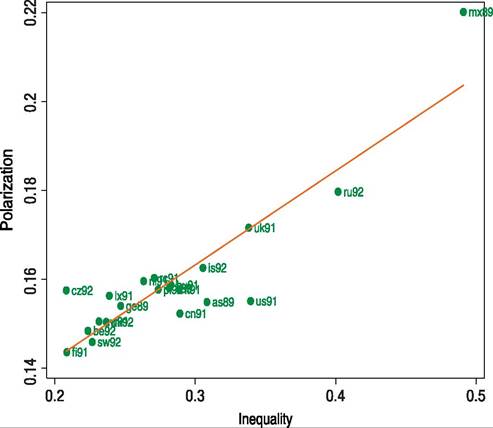
Figure 5.24 Polarization (measured by the DER (a = 1) index) and inequality for 21 countries, LIS Wave 3.
Data source: Duclos et al. (2004).alienation, but the United Kingdom’s density has sharper peaks, with the United States’ density being remarkably flat with thick tails. The United Kingdom then ends up with a higher level of polarization, especially with higher values of α.
5.9.2 Empirical Polarization Comparisons
Using their range-free dominance techniques, Foster and Wolfson (2010/1992) compared bipolarization in the United States and Canada between 1979/1981 and 1988. Polarization and inequality are increasing in the United States but stable in Canada. The United States is robustly more polarized and unequal than Canada.
Duclos and Echevin (2005) applied their first-order bipolarization ordering techniques to rank 29 countries. They established bipolarization comparisons for 32% of the pairs of countries. This percentage increases to 57% when orderings are established solely on sample estimates and statistical uncertainty is ignored. Mexico has the highest level of bipolarization of all 29 countries, the ranking being statistically significant with respect to 26 countries, followed by Russia and the United States.
The extended polarization measure developed by Esteban et al. (2007) is applied to the income distribution of five OECD countries, namely the United States, the United Kingdom, Canada, Germany, and Sweden for the period 1974—2000. The main temporally observed pattern is a decrease in the Esteban and Ray (1994) polarization index combined with a moderate decline in within-group dispersion. Because the Esteban et al. (2007) index is a difference between these two factors, the net pattern is a decrease in the EGR index, especially in Canada and Germany. In 1974, at the beginning of the period, only Sweden presented relatively low polarization; Germany and the United Kingdom had similar levels of polarization, being nearly as polarized as Canada and the United States. By 2000, the United States and the United Kingdom were highly polarized relative to Sweden, Germany, and Canada.
Using the intermediate polarization measure, Chakravarty and D’Ambrosio (2010) compared polarization across four southern European countries, Greece, Italy, Spain, and Portugal. With regard to absolute polarization, Italy is the most polarized country on average, followed by Spain. But with respect to relative and intermediate polarization, Italy is the least polarized country on average, whereas Portugal is the country showing the highest level of polarization.
Anderson (2011) combined the indices of Esteban and Ray (1994) and Duclos et al. (2004) to consider polarization across discrete and continuous variables. Unidimensional polarization is found to have increased between 1990 and 2001 in the six Chinese provincial distributions of urban households considered, over the dimensions of income, living space, and education separately. When the three variables are combined in a multidimensional space, polarization is stable over 1990—2001 for smaller values of polarization aversion and decreasing for higher values.
5.9.3 Polarization and Conflict
Reynal-Querol (2002) estimated the impact of religious polarization and animist diversity on the incidence of ethnic civil war. Her main finding is that religious divisions seem more important than language divisions and natural resources in explaining social ethnic conflicts. She found in particular a positive and robust impact of animist diversity and religious polarization (but not of language fractionalization) on the incidence of ethnic civil war.
The effect of polarization and fractionalization on the incidence of civil and ethnic wars and, indirectly, on economic growth was further studied in Montalvo and Reynal-Querol (2005a). No relationship between fractionalization and conflict emerges for more than two groups. Ethnic polarization has a positive and significant impact on the prevalence of civil wars, as does religious polarization. Fractionalization and polarization are even negatively correlated at higher levels of fractionalization.
Montalvo and Reynal-Querol (2003) further support the evidence (reported in Montalvo and Reynal-Querol, 2002) that religious polarization is more appropriate for measuring the effect of potential conflict on economic development than the traditional fractionalization index. Religious polarization has a negative and significant effect on development through its effect on investment, government expenditure, and the frequency of civil wars. No effect of religious and ethnic fractionalization is found on the incidence of ethnic and civil wars on growth or on investment.
In an extension to the preceding, Montalvo and Reynal-Querol (2005b) reported that ethnolinguistic fractionalization has no statistically significant effect on the incidence of civil war, but that ethnic polarization does have a positive and statistically significant impact. Montalvo and Reynal-Querol (2008) further found that polarization has a positive and significant effect on genocide, whereas fractionalization does not.
Unlike social polarization indices such as that of Reynal-Querol (2002), the socioeconomic polarization index of Permanyer (2010) takes into account the extent of alienation between individuals. Using data from the World Value Surveys on 65 countries, the indices of Reynal-Querol (2002) and Permanyer (2010) are found to be positively but weakly correlated. The evidence in Permanyer (2010) also suggests that socioeconomic polarization indices could be better predictors of the occurrence of conflicts than purely social polarization indices.
Finally, Esteban et al. (2012a) (see also Esteban et al. 2012b) assessed the empirical role of different notions of group division and group dispersion in explaining different types of conflict. Types of conflict differ according to whether it is the allocation of public or of private goods that is the object of dispute; their outcomes also vary according to levels of group cohesion. The exercise helps explore the empirical validity of the theoretical model described at the beginning of this chapter (see section 2). Esteban et al. (2012a) found that the extent of social polarization and fractionalization always empirically matters regardless of model specification. This suggests that sources of disputes both over public and over private goods matter in explaining conflict. Furthermore, and as predicted by the theoretical model, it is found that the greater the degree of relative publicness of conflict prizes, the greater the importance of polarization (which takes into account across-groups distances in utilities of public goods) relative to fractionalization (which does not).
5.10.
More on the topic POLARIZATION IN PRACTICE:
- Contents
- Petrographic Analysis
- Humility and professional practice
- Restorative Justice: social service, paradigm shift, or social justice movement?3
- Conclusions
- The Imperial Self and the Barbarian Other
- Integrity as dissonance reduction
- Conclusion
- Epistemic humility and social media
- WAGE DISPERSION: MEASUREMENT AND STYLIZED FACTS