Unemployment in the Classical Model
unemployment that occur during recessions are a principal reason that policymakers and the public are so concerned about economic downturns.
Classical economists are perfectly aware of this issue, and they have developed more sophisticated versions of the classical business cycle model to account for unemployment.
The main modification they make to the simple supply-and-demand model of the labor market is to drop the model's implicit assumption that all workers and jobs are the same. Rather than all being the same, workers in the real world have different abilities, skills, and interests, among other things; jobs entail different skill requirements, work environments, locations, and other characteristics. Because workers and jobs both vary in so many ways, matching workers to jobs isn't instantaneous and free but time-consuming and costly. The fact that someone who has lost a job or has just entered the labor force must spend time and effort to find a new job helps explain why there always are some unemployed people.Some classical economists suggest that differences among workers and among jobs explain not only why the unemployment rate is always greater than zero, but also why unemployment rises so sharply in recessions. They argue that productivity shocks and other macroeconomic disturbances that cause recessions also often increase the degree of mismatch between workers and firms.[179] Thus a major adverse productivity shock might affect the various industries and regions within the country differently, with jobs being destroyed in some sectors but new opportunities emerging in others. An oil price shock, for example, would eliminate jobs in energy-intensive industries but create new opportunities in industries that supply energy or are light energy users.
Following such a shock, workers in industries and regions where labor demand has fallen will be induced to search elsewhere for jobs, which raises the frictional component of unemployment.
Some of these workers will find that their skills don't match the requirements of industries with growing labor demand; these workers may become chronically unemployed, raising structural unemployment.[180] With many unemployed workers looking for jobs, and because creating new jobs takes a while, the time necessary to find a new job is likely to increase. For all these reasons, an adverse productivity shock may raise unemployment as well as reduce output and employment. Note that this predicted rise in frictional and structural unemployment during recessions is the same as an increase in the natural rate of unemployment (the sum of frictional and structural unemployment rates).What is the evidence of worker-job mismatch and unemployment? The process of job creation and job destruction in U.S. manufacturing has been studied in some detail by Steven Davis of the University of Chicago and John Haltiwanger[181] of the University of Maryland. Using data for 160,000 manufacturing plants, the authors showed that, during the 1973-1986 period, about 11% of all existing manufacturing jobs disappeared, on average, each year, reflecting plant closings and cutbacks. During a typical year, about 81% of these lost jobs were replaced by newly created jobs elsewhere in the manufacturing sector (so that, overall, employment in manufacturing shrank over the period). Thus Davis and Haltiwanger confirmed that a great deal of "churning" of jobs and workers occurs in the economy. They also showed that much of this churning reflected closing of old plants and opening of new ones within the same industries, rather than a general decline in some industries and growth in others. Thus reallocation of workers within industries seems to be as important as movement of workers between industries as a source of unemployment.
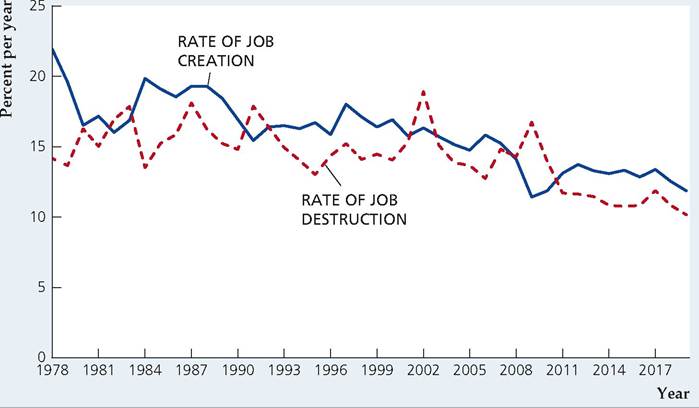
Figure 10.5 shows the rates of job creation and destruction in U.S. nonfarm private businesses for the years 1978-2019.[182] You can see that during or immediately following recession years, such as 1981-1982, 1990-1991, 2001, and 2007-2009, more jobs were destroyed than created—although a significant number of new jobs were created even in recession years, reflecting shifts of workers among firms and industries.
The biggest excess of job destruction over job creation came in the aftermath of the 2007-2009 recession. The rate of job destruction exceeded the rate of job creation by almost 5 percentage points in 2009 and remained nearly 2 percentage points higher than the job creation rate in 2010 before finally falling below the job creation rate in 2011.It seems clear that increased mismatches between workers and jobs can't account for all the increase in unemployment that occurs during recessions. Much of that increase is in the form of temporary layoffs; rather than search for new jobs, many workers who are temporarily laid off simply wait until they are called back by their old firm. Moreover, if recessions were times of increased mismatch in the labor market, more postings of vacancies and help-wanted ads during recessions would be expected; in fact, both vacancies and new job openings fall in recessions.[183] Despite these objections, however, economists generally agree that the dynamic reallocation of workers from shrinking to growing sectors is an important source of unemployment.
FIGURE 10.5
Rates of job creation and job destruction in U.S. private, nonfarm businesses, 1978-2019 The graph shows the rates of job creation and job destruction in the U.S. nonfarm private business sector between 1978 and 2019. Job creation is the number of new jobs created during the year in expanding firms as a percentage of existing jobs. Job destruction is the number of jobs lost during the year as a result of closing or downsizing plants, as a percentage of existing jobs.
Source: Data from U.S. Census Bureau, Business Dynamic Statistics, www.census.gov/ data/datasets/time-series/ econ/bds/bds-datasets.html.
Modifying the classical model to allow for unemployment doesn't change the classical view that fiscal policy should not be actively used to combat recessions. Classical economists point out that raising the aggregate demand for goods (by increasing government purchases, for example) doesn't directly address the problem of unemployment arising from the mismatch that exists at the microeconomic level between workers and jobs.
A better approach, in the classical view, is to eliminate barriers to labor market adjustment, such as high legal minimum wages that price low-skilled workers out of the labor market or burdensome regulations that raise businesses' costs of employing additional workers.Jobless Recoveries
The economy reaches a business-cycle trough when aggregate economic activity stops falling and begins to increase. Because aggregate economic activity is rising after having fallen for a number of months, the increase in aggregate economic activity following a trough is often called a recovery. Recoveries are typically characterized by widespread increases in various economic activities, often including increases in employment. However, the increases in employment following the recessions that ended in 1991, 2001, and 2009 were much slower to materialize and much weaker than the increases in employment following the recessions that ended in the 1960s, 1970s, and 1980s. Because employment actually continued to fall at the beginning of the recoveries that began in 1991, 2001, and 2009, these recoveries have come to be known as "jobless recoveries." When the first of the jobless recoveries developed in 1991, economists did not know whether the jobless nature of the recovery was a one-time aberration or a new feature of the business cycle in the United States. Having now seen three consecutive recoveries that were jobless, it looks as if there has indeed been a change in the cyclical behavior of the U.S. labor market. Economists have considered many potential explanations for these jobless recoveries, but research has yet to identify a convincing explanation.
To illustrate the change in employment around the time of a business-cycle trough, we create an index of employment relative to the level of employment at the business-cycle trough:

Thus the index in the trough month is simply 100.
If the employment in a given month is 5% higher than in the trough month, the index has a value of 105. Similarly, an index value of 98 indicates that employment in the given month is 2% smaller than employment in the trough month.FIGUREJ0.6
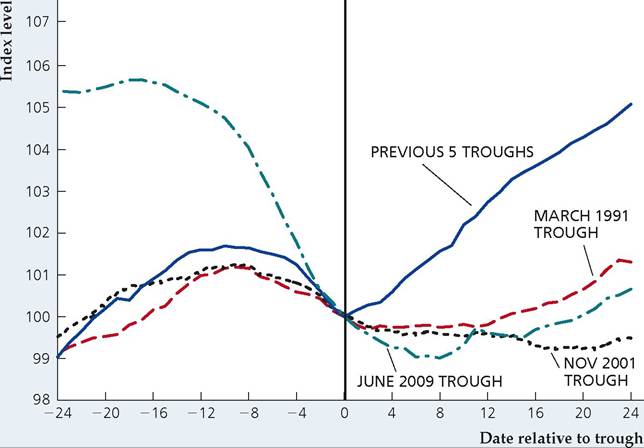
Payroll employment relative to businesscycle trough
The chart shows monthly values for an index of monthly payroll employment calculated as 100 ? (employment in given month )/ (employment in trough month). The values of this index are shown for each month from 24 months before the business-cycle trough (shown as date—24) to 24 months after the business-cycle trough (shown as date 24). The index is scaled so that its value is 100 at businesscycle troughs, which are shown by the vertical line.
Sources: Authors' calculations based on data from Bureau of Labor Statistics, downloaded from Federal Reserve Bank of St. Louis FRED database at fred.stlouisfed.org/series/ PAYEMS.
Figure 10.6 is a graphical device that allows us to compare employment behavior around various business-cycle troughs. The horizontal axis shows the number of months before or after a business-cycle trough. The month of the trough is month 0 and is highlighted by the vertical line in the figure. A month that is 4 months after the trough is shown as month 4 on the horizontal axis; similarly, month -8 is 8 months before the trough. The vertical axis shows the value of the relative employment index defined above. As we have noted, for all businesscycle troughs, the value of the index is 100 in month 0, which is the month of the trough. The line labeled "Previous 5 troughs" shows the average value of the index relative to the business-cycle troughs in February 1961, November 1970, March 1975, July 1980, and November 1982. The graph also shows separate lines for the trough dates in March 1991, November 2001, and June 2009. Because the COVID recession of 2020 led to dramatically unusual swings in employment, we do not show that recession in the graph.
Figure 10.6 clearly shows the jobless nature of the three most recent recoveries. In all three cases, payroll employment continued to fall for months after the businesscycle trough, unlike in the previous five recoveries, which showed employment growth as soon as recovery began. One explanation offered for the jobless recoveries following the 1990-1991 and 2001 recessions was simply that those recessions were mild. That explanation argued that if a recession is mild, the recovery will be weak because there is not much to recover from. But the 2007-2009 recession was very deep, as you can tell by the large decline in the index of payroll employment during the recession, which declined from a value above 105 two years before the trough date. And this very deep recession was also accompanied by a very weak recovery in employment.
Another explanation is that increased labor productivity allows GDP to grow even as employment is declining. Generally, productivity growth is beneficial to the economy, as it raises incomes. But in the short run, according to Federal Reserve Chairman Ben Bernanke in 2003, "given erratic growth in final demand,
[productivity] has also enabled firms to meet the demand for their output without hiring new workers. Thus in the short run, productivity gains, coupled with growth in aggregate demand that has been insufficient to match the expansion in aggregate supply, have contributed to the slowness of the recovery of the labor market."24 While this explanation has some appeal, it does not explain why the three most recent recoveries were jobless while the previous five recoveries exhibited job growth from the start.
10.4
More on the topic Unemployment in the Classical Model:
- Unemployment in the Classical Model
- 4 The Classical Model of Income Determination
- Economists generally agree about the basic business cycle facts outlined in Chapter 8.
- The explanation of unemployment and its cyclical fluctuations is one of the central tasks of macroeconomics.
- Real-Wage Rigidity
- Conclusion
- As already noted, following the Great Depression of the 1930s, the analysis of aggregate fluctuations evolved into macroeconomics, on the basis of Keynesian models.
- Conclusion
- The perfectly competitive new classical models that we analyzed in chapters 13 and 14 are examples of DSGE models in which wages and prices are perfectly flexible and equilibrate both the product and labor markets.
- Unemployment