Bovine TB in Ethiopia
Little is known about the status of BTB in Ethiopia prior to the 1960s when the first cases were documented in the annual abattoir meat inspection report of the Ministry of Agriculture (Hailemariam 1975).
It is assumed that the brief Italian occupation from 1895 to 1896, and the importation of cattle as part of their dairy cattle improvement program during the second occupation in the twentieth century (1935-1941), created opportunities for the introduction of BTB into the country.During the course of recent decades, the situation improved, and more extensive work determining the prevalence and distribution of BTB was done. In the late 1980s,
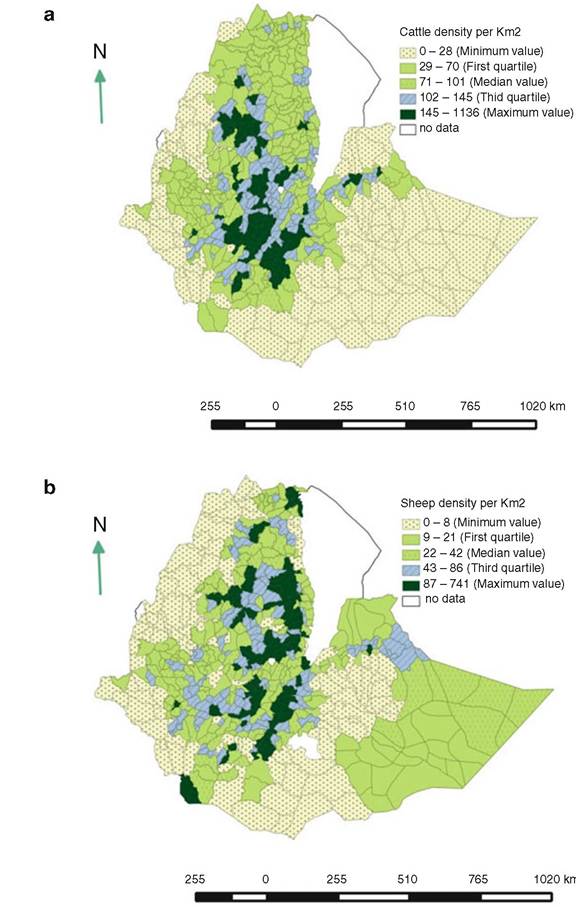
Fig. 14.2 Geospatial distribution of cattle (a), sheep (b), and goat (c) populations in Ethiopia showing higher density (per km2) in the central region (Leta and Mesele 2014)
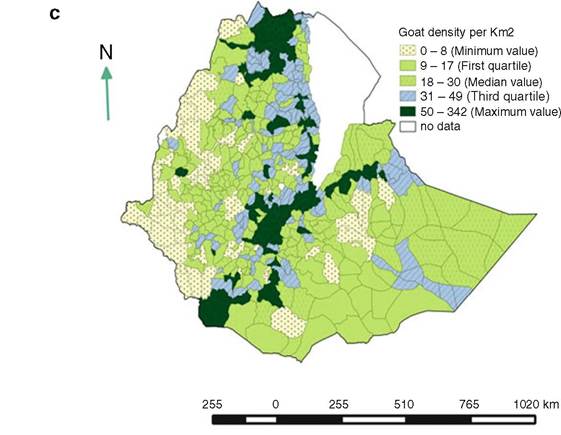
Fig. 14.2 (continued)
the Institute of Agricultural Research (IAR) conducted blanket screening of all state- owned dairy farms in the country, and in 2000 the Armauer Hansen Research Institute (AHRI), a biomedical research institute based in Addis Ababa, expanded its TB research program to include zoonotic TB. The establishment of new veterinary schools at the Jima, Mekele, Hawassa, and Haramaya universities, and expansion of the graduate programs at the College of Veterinary Medicine, Addis Ababa University, enabled extensive surveying of BTB in various regions and agroecological zones in the country. These activities were further enhanced by the establishment of academic and research collaboration between Ethiopian and European universities in mid-2000.
Bovine TB is prevalent in all agroecological zones of the country (Tables 14.1 and 14.2), mainly affecting cattle, sheep, goats, and camels (Table 14.3).
ThediseaseTable 14.1 Prevalence of BTB in various agroecological zones of Ethiopia based on tuberculin skin testing
| Agroecological zonesa | District/area | Number tested | Prevalence (%) | Reference |
| Dega (highland) | Fiche | 1041 | 16.2 | Ameni et al. (2007) |
| (2500-3500 masl) | Salaale/Holeta | 5424 | 13.5 | |
| Woyina-Dega | Arsi | 625 | 12.2 | Dinka and Duressa (2011) |
| (mid-highland) | Addis Ababa | 1869 | 23.7 | Elias et al. (2008) |
| (1500-2500 masl) | Gurage zone | 1214 | 6.8 | Tschopp et al. (2011) |
| Kolla (lowland) | Hamar | 499 | 0.8 | Tschopp et al. (2010a) |
| (500-1500 masl) | Filtu | 421 | 2.0 | Gumi et al. (2012) |
aBased on traditional Ethiopian agroecological zonation criteria; masl-meter above sea level
Table 14.2 Prevalence of BTB in Ethiopia based on abattoir surveys conducted in various regions
| Abattoir | Location | No of carcasses | Prevalence (%) | Reference |
| Addis Ababa | Central | 600 | 15.2 | Biffa et al. (2010) |
| Adama | Southeast | 522 | 24.7 | Biffa et al. (2010) |
| Melge-Wondo | South | 1325 | 4.5 | Biffa et al. (2010) |
| Hawassa | 442 | 8.8 | Biffa et al. (2010) | |
| Yabello | 433 | 4.2 | Biffa et al. (2010) | |
| Butajira | Southwest | 446 | 9.0 | Nemomsa et al. (2014) |
| 4606 | 16.4 | Berg et al. (2009) | ||
| Jinka | South | 3471 | 8.0 | Berg et al. (2009) |
| Gimbi | West | 3250 | 12.7 | Berg et al. (2009) |
| Gonder | North | 14,314 | 1.8 | Berg et al. (2009) |
| Weldiya | 4338 | 5.53 | Berg et al. (2009) | |
| Addis Ababa | Central | 500 | 5.0 | Mekibeb et al. (2013) |
| 1350 | 3.0 | Asseged et al. (2004) | ||
| 984 | 3.5 | Shitaye et al. (2006) | ||
| Jimma | West | 780 | 2.7 | Tigre et al. (2011) |
| 1102 | 5.4 | Bekele and Belay (2011) | ||
| Hossana | Southwest | 751 | 4.5 | Teklu et al. (2004) |
Table 14.3 Prevalence estimates of BTB in different livestock species in Ethiopia
| Species | Diagnostic method | Number examined | Prevalence | Reference |
| Cattle | CCT | 1214 | 6.8 | Tschopp et al. (2011) |
| 499 | 0.8 | Tschopp et al. (2010a) | ||
| 421 | 2.0 | Gumi et al. (2012) | ||
| 110 | 13.6 | Ashenafi et al. (2013) | ||
| Sheep | 77 | 1.3 | Ashenafi et al. (2013) | |
| 203 | 0.5 | Amenu et al. (2010) | ||
| 347 | 1.4 | Mamo et al. (2012) | ||
| Goats | PME | 1744 | 4.4 | Gumi et al. (2012) |
| 1536 | 4.2 | Hiko and Agga (2011) | ||
| CCT | 186 | 0 | Tschopp et al. (2010a) | |
| 518 | 0.2 | Gumi et al. (2012) | ||
| 320 | 6.3 | Ashenafi et al. (2013) | ||
| 1884 | 4.3 | bgcolor=white>Mamo et al. (2012)|||
| SIT | 630 | 7.6 | Tafess et al. (2011) | |
| Camels | PME | 276 | 5.1 | Ethiopie et al. (2009) |
| 906 | 10.0 | Mamo et al. (2011) | ||
| CCT | 479 | 0.41 | Gumi et al. (2012) | |
| 480 | 6.0 | Beyi et al. (2014) | ||
| PME | 398 | 8.3 | Beyi et al. (2014) |
CCT comparative cervical intradermal test, SIT single cervical intradermal test, PME postmortem examination
prevalence is particularly high in crossbred dairy cows in intensive husbandry systems. For example, in a recent study in central Ethiopia where commercial dairy farming is widely practiced, 90% of the herds were positive for BTB, and a prevalence of as high as 41.3% was recorded in some of the large dairy herds (Firdessa et al. 2012).
14.3.1 BTB Epidemiology in Ethiopia
14.3.1.1 Molecular Epidemiology of M. bovis in Ethiopia
Spoligotyping and Deletion Analysis
Three features characterize the East African M. bovis clonal complex (Berg et al. 2011):
1. The majority of spoligotypes isolated in eastern Africa characteristically lack spacers 3-7 in their spoligopattern (Fig. 14.3).
2. All isolates with this feature also lack RDAf2 chromosomal DNA.
3. Parsimonious phylogenetic inferences, based on 43 spacers of spacer oligotyping, suggest that the most recent ancestor of this group of isolates has a spoligopattern similar to that of SB0133 (Berg et al. 2011).
Only 26 unique spoligotypes have been detected in the country to date. Molecular data (Firdessa et al. 2012; Biffa et al. 2010; Berg et al. 2011; Kidane et al. 2002) indicate that unlike in most Western African regions, SB0133 is not the dominant spoligotype but that SB1176 is the most frequently isolated strain. In Ethiopia, the vast majority of the unique spoligotypes belong to the Af2 clonal complex, and it is plausible that the low genetic diversity in this endemic setting reflects an ongoing transmission event (Firdessa et al. 2012). The vast majority of the unique spoligotypes belong to the Af2 clonal complex, and SB1176 is the most frequently isolated strain. SB1476, the second-most-frequently isolated spoligotype in Ethiopia, is also the most frequently isolated non-Af2 spoligotype (Kidane et al. 2002). The BCG-like spoligopattern, SB0120, has only been isolated in Addis Ababa.
MIRU-VNTR Typing
Allelic Diversity of the MIRU-VNTR Typing Tool
Although spoligotyping has been widely used in molecular epidemiological studies in Ethiopia, its discriminatory power does not exceed 90% (0.90) (Biffa et al.
2010), and a considerable amount of genetic diversity is left un-decoded when spoligotyping only is used for typing purposes. MIRU-VNTR is more sensitive
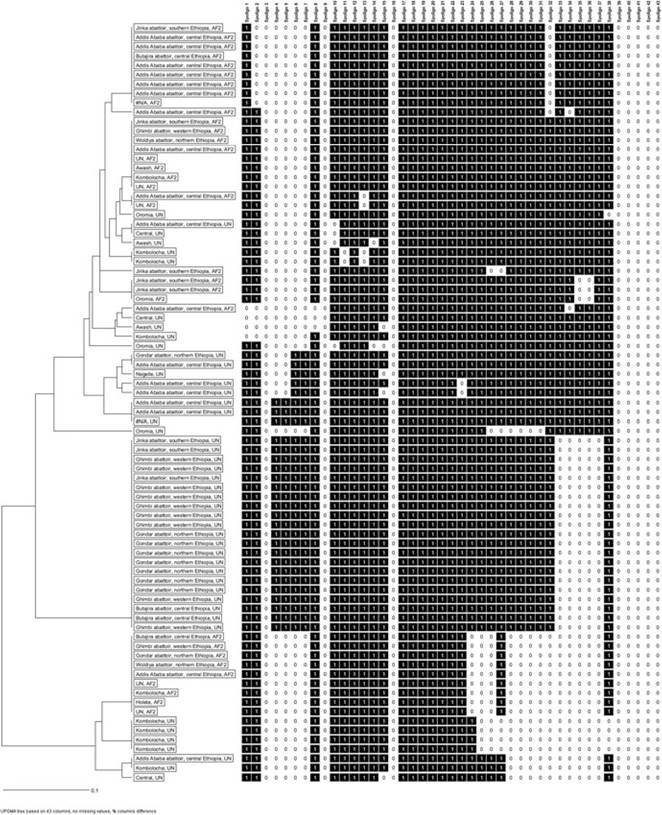
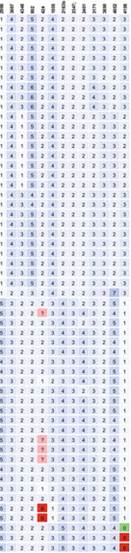
Fig. 14.3 Unweighted pair-group method with arithmetic mean (UPGMA) tree generated based on 64 isolates with 26 unique spoligotypes recovered in specific woredas (districts) of Ethiopia. Note that UN (white color band) represents spoligotypes whose district of origin was not documented
and allows assessment of variable allelic diversity depending on the settings and ecological niches from which the isolates are recovered (Hilty et al. 2005; Muwonge et al. 2014). Of the 55 previously described isolates (Biffa et al. 2010), loci 4052, 2461,4156, 2165, 2163b, and 2059 (Table 14.4), have the highest allelic
Table 14.4 Allelic diversity of 55 Ethiopian M. bovis isolates on a 24 MIRU-VNTR panel. The diversity was calculated using the method of Selander et al. (1986)
| Loci | Allelic diversity |
| 2165 | 0.639 |
| 2461 | 0.678 |
| 577 | 0.551 |
| 580 | 0.442 |
| 3192 | 0.053 |
| 154 | 0.586 |
| 960 | 0.266 |
| 1644 | 0.593 |
| 2059 | 0.605 |
| 2531 | 0.053 |
| 2687 | 0.119 |
| 2996 | 0.587 |
| 3007 | 0.539 |
| 4348 | 0.546 |
| 802 | 0.59 |
| 424 | 0.131 |
| 1955 | 0.564 |
| 2163b | 0.604 |
| 2347 | 0.489 |
| 2401 | 0.477 |
| 3171 | 0.369 |
| 3690 | 0.482 |
| 4052 | 0.727 |
| 4156 | 0.649 |
diversity and should be included in MIRU-VNTR panels of Ethiopian M. bovis isolates.
Genetic Diversity of the Spoligotypes
A previously published dataset (Firdessa et al. 2012; Biffa et al. 2010) was reanalyzed using MIRU-VNTR, allowing analysis of the genetic diversity within a given spoligotype (Fig. 14.4). For this, two spoligotypes (SB1176 and SB0133) belonging to the Af2 clonal complex, and another spoligotype signature (SB0134) that does not belong to the Af2 clonal complex, were chosen because of their high frequency of isolation and also because of the availability of data on the 24 MIRU- VNTR loci. It transpired that the non-Af2 spoligotype is almost exclusively monomorphic, an attribute that is shared by isolates from all geographic regions regardless of how distant they were from each other. The two spoligotypes belonging to Af2 clonal complex, however, exhibited polymorphism that tended to be clustered according to location.
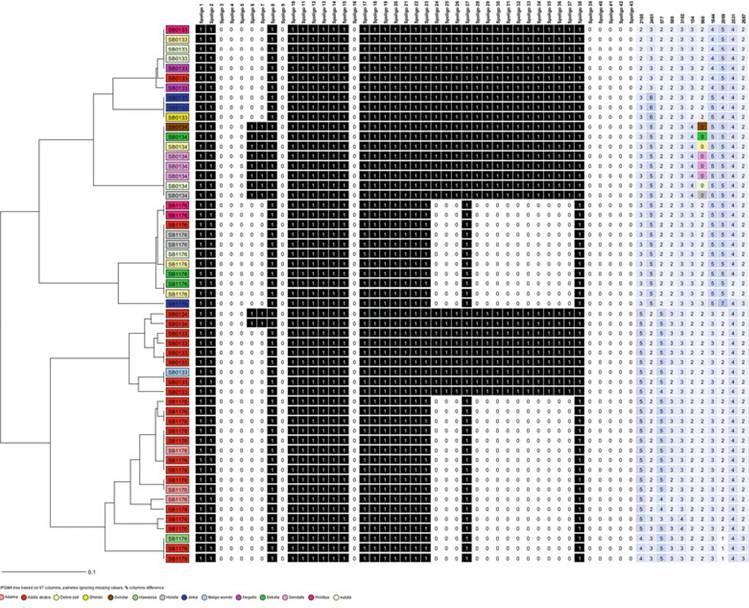
Fig. 14.4 Unweighted pair-group method with arithmetic mean (UPGMA) phylogenetic tree based on 24 MIRU-VNTR loci of three Spoligotypes (SBOl 34, SB1176, and SBO133). The figure was generated using RIDOM MLVA and was based on 55 isolates that produced 26 unique genotypes, with a combined discriminatory power of 0.95% (0.93-0.97), which translates into a cluster rate of 0.52
326 D. B. Areda et al.
14.3.2 Cattle Movement in Ethiopia
Ethiopia’s vast cattle population (FAOSTAT 2005) is farmed in different production systems that provide different opportunities for the transmission of M. bovis. The dissemination of the disease appears to be dependent on two main practices: pastoralism and the search for and the location of markets. Pastoralism is the predominant farming system, and it requires extensive cattle movement over long distances, mainly in search of water and grazing. The location of cattle markets is another important determinant of livestock movement in Ethiopia (Jabbar et al.
2007). The search for markets is driven by price, causing a centripetal movement of cattle to urban areas that offer better prices for livestock. From various rural areas, cattle are moved to Addis Ababa and Holeta, for export to Bati, Tagochale, or Sudanese, Eritrean, and Kenyan markets (Fig. 14.5), thus acting as a conduit for the dissemination of BTB in the country.
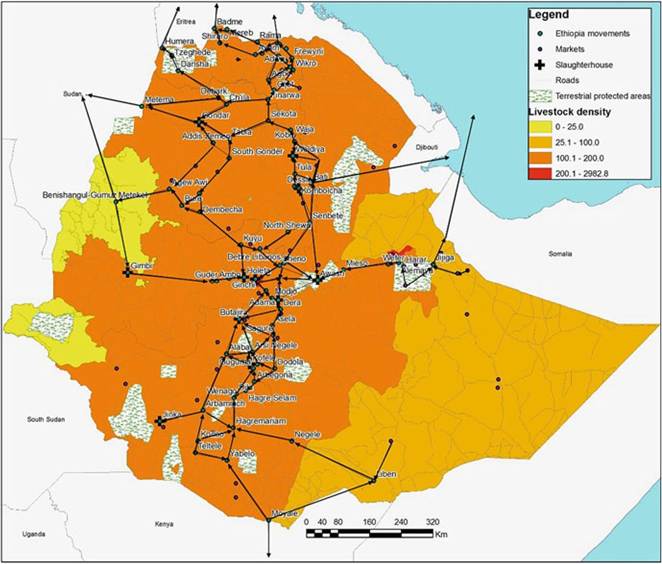
Fig. 14.5 Cattle movement network in Ethiopia (adapted from empirical data collated by Jabbar et al. (2007). Color gradient shows cattle density based on data from FAOSTAT (2005). The map was generated using Arch GIS
14.3.3 Molecular Epidemiology of Mycobacterium bovis in Ethiopia
To understand the distribution of the different M. bovis types in Ethiopia, it is essential to understand the movement of cattle in Ethiopia, as they are the most important maintenance hosts of M. bovis. There appears to be a bi-directional movement of cattle in Ethiopia that influences the spread and distribution of M. bovis types in the country. Cattle from rural areas are brought to and marketed and slaughtered in the urban centers, and new breeding stock is distributed throughout the country from the urban areas.
The distribution of the five most frequently isolated spoligotypes in Ethiopia appears to reflect the cattle movement network from rural areas to the abattoirs (Fig. 14.5). The largest diversity of spoligotypes, which includes almost all the spoligotypes that are present in the country, has also been isolated from cattle in Addis Ababa and its surroundings. The spoligotype diversity observed in the major slaughterhouses in Addis Ababa, and in Debre Zeit, Jinka, and Kombolcha (Figs. 14.6 and 14.7), appears to be a cross-sectional reflection of the molecular diversity of M. bovis isolates from the entire country, rather than that of the M. bovis types present in the greater Addis Ababa area and the other urban centers.
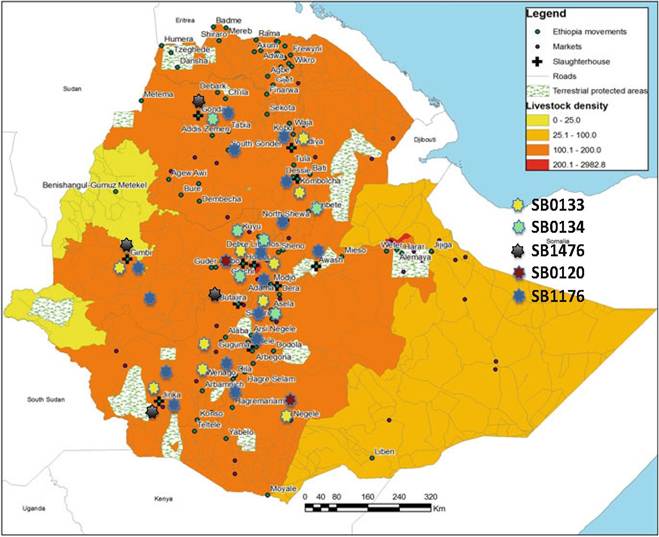
Fig. 14.6 Spatial distribution of the five most frequently isolated spoligotypes in Ethiopia
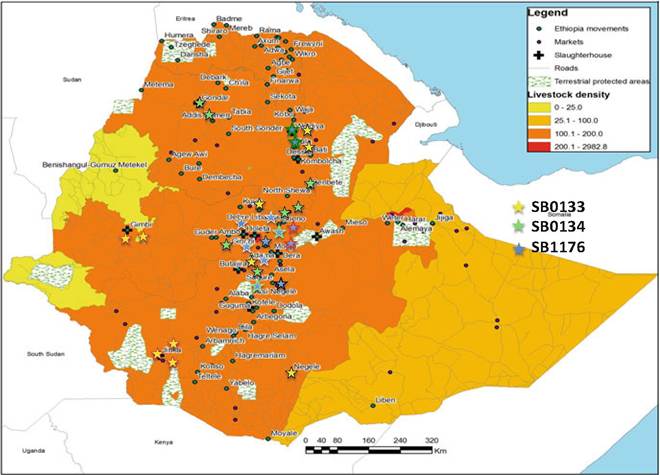
Fig. 14.7 Spatial distribution of the genotypes of the three most frequently isolated spoligotypes in Ethiopia. The color in the middle of the star corresponds to the spoligotype, while the color of the margin of the star corresponds to the specific MIRU-VNTR variant/clone
The centrifugal movement of cattle is the consequence of the recent shift to dairy farming and attempts to improve the milk production of the local breeds, also in rural areas. For this purpose, purebred cattle are imported into the country, mostly through Addis Ababa. The intensive husbandry systems in urban areas into which they are incorporated provide a perfect environment for the transmission of BTB, which is then spread by pure and crossbred bulls when they are distributed to rural breeding centers. It is conceivable that this centrifugal movement of potentially BTB-infected cattle is the reason for the presence of certain identical genotypes, such as SB1176 (the most frequently isolated genotype) throughout the country (Fig. 14.6).
At a granular level, when spoligotyping is combined with MIRU-VNTR, centripetal cattle movement is still discernible. Another dynamic, however, is revealed (Figs. 14.6 and 14.7). Certain clones of the SB0133 and SB1176 circulate exclusively in Addis Ababa and the surrounding towns, Sululta, Senbete, Sendafa, and Debre Zeit. This localization of strains likely reflects the effects of the shift to intensive dairy farming in Addis Ababa and the surrounding towns in response to an increasing demand for milk and, to a lesser extent, meat (Firdessa et al.
2012).
The isolation of identical SB0133 clones from districts (Woredas) as far apart as Nagelle in the south and Weldiya in the north suggests that cattle movement is extensive and linked to the road network. The presence though of two SB0133 genotypes unique to Jinka and Gimbi implies that a mode of animal movement may exist between localities other than that revealed by the empirical data reflecting cattle movement in the country (Fig. 14.7).
14.3.4 Tuberculosis in Ethiopian Wildlife
Ethiopia has diverse geographic and climatic features characterized by an extensive range of rugged mountains (averaging above 13,000 ft.), a vast savanna and rivers, and suitable weather conditions that support a diversity of wildlife and birds. The country has more than 14 major wildlife reserves that represent the entire sub-Saharan ecosystem (Amare 2015), and it is regarded as one of the top 25 countries in the world with a rich endemic collection of higher vertebrate species (Groombridge 1992).
Although diseases threaten wildlife survival worldwide, little is known about their effect on the Ethiopian wildlife populations. Tuberculosis can have serious consequences for wildlife conservation by endangering species, thus affecting biodiversity and national tourism (Tschopp 2015). Bovine TB is known to occur in a wide range of wildlife species, some of which may also serve as maintenance hosts. Many of these wildlife species, particularly larger mammals, known to be natural hosts of, or susceptible to BTB, also occur in Ethiopia (Amare 2015). To our knowledge, only two attempts have been made to investigate BTB in Ethiopian wildlife. None of the members of the M. tuberculosis complex (MTC) was detected in 28 different mammalian species (Tschopp et al. 2010a, b), but environmental mycobacteria, predominantly M. terrae, were abundant. Failure to detect M. bovis was unexpected given the extensive wildlife-livestock interface, which undoubtedly creates many opportunities for the interspecies transmission of M. bovis.
Because of the known presence and spread of BTB in various African wildlife species, it is essential that a carefully designed epidemiological study, employing more sensitive tests and using larger sample sizes, be conducted to determine the status of the disease in Ethiopia wildlife and the role that they can play in sustaining the infection in the country.
14.4
More on the topic Bovine TB in Ethiopia:
- Bovine TB in Ethiopia
- Control of BTB in Ethiopia
- Chapter 23 Bovine Tuberculosis in Zambia
- Cattle Movement Networks in Uganda
- Molecular Epidemiology of Bovine Tuberculosis in Uganda
- Diagnosis of Bovine Tuberculosis in Zambia