Fighting Inequalities
In this section we deal, in turn, with the following issues: the reasons for being interested in inequality and its effects on policy targets, measurement of inequality, causes of inequality and policies against inequality.
To each of them we will devote one of the following subsections.5.6.1 The Reasons for Being Interested in Inequality and Its Effects on Policy Targets
We are interested in income and wealth distribution for a number of reasons. First, we are interested because they are indicators of equity and fairness, which are important requisites for social cohesion (on this, see Wilkinson and Pickett 2009). Inequality is also important for health, education, political and economic stability (especially to avoid low aggregate demand and crises due to the lower propensity to consume of richer households). Moreover, inequality matters for its intergenerational effects, as a poor person tomorrow is likely to be the son of a poor person today (Raitano and Vona 2015; Franzini and Raitano 2016). In addition, it has a negative impact on growth (Cingano 2014). Finally, it tends to reproduce itself over time, as it generates a conservative shift in sentiment among both the rich and the poor (Kelly and Enns 2010). The effects of poverty and inequality on longterm growth have been the object of inquiry of a number of modern theoretical and empirical studies that reach different conclusions.
Let us first deal with theoretical analyses. Voitchovsky (2009) indicates both the positive and the negative effects of inequality on growth. The former are linked to the top part of the income distribution, as this can boost savings available for investment unless they nourish corruption and rent seeking.[85] The latter are linked to the share of the bottom part of the distribution, as the poor cannot save or are trapped in a loop where high fertility rates, low education and low health perpetuate their state.
It is true that the economic motive behind human action pushes towards the prospect of a higher income. Accordingly, some authors hold that inequality can have a positive influence on growth because it provides incentives for innovation and entrepreneurship (Lazear and Rosen 1981). However, just because of this, inequality can discourage effort by the poor (ILO 2015: 19, 20). In poor countries, inequality can allow at least some individuals to acquire a good education and accumulate the minimum needed to start businesses (Barro 2000).But inequality may be harmful for growth because it: i) deprives the poor of the ability to stay healthy and accumulate human capital (Perotti 1996; Galor and Moav 2004; Aghion, Caroli and Garcia-Penalosa 1999); ii) generates political and economic instability that reduces investment (Alesina and Perotti 1996); and iii) impedes the social consensus required to adjust to shocks and sustain growth (Rodrik 1999). The relationship between inequality and growth may be nonlinear, as in the theoretical model of Benhabib (2003), in which increases in inequality from low levels provides growth-enhancing incentives, while increases past some point encourage rent-seeking and lower growth (Ostry, Berg and Tsangarides, 2014: 8). Finally, Ravallion (2016) traces the various reasons underlying a negative impact of inequality on growth. Then different possible effects are at play. In order to assess whether positive or negative effects prevail, empirical analyses can be useful. We refer to only some of them. By exploiting a new data set offering information on inequality, redistribution and growth, Ostry, Berg and Tsangarides (2014) find a positive effect of equality on growth on average across countries and over time. The negative impact on growth of different features of inequality is found by Cingano (2014), who exploits a harmonised data set covering the OECD countries over the past thirty years. Redistributions typically enhanced growth.
Higher growth causes a narrowing of inequality, which also supports faster and more durable growth. In any case, there seems to be no evidence that redistributive policies are harmful to growth unless they are of an extreme kind. Granger causality shows the existence of a double-direction effect between growth and inequality: inequality has a negative impact on growth, whereas growth positively influences inequality, but this latter effect is much lower than the former. In rich countries, lagged inequality is positively correlated with growth, whereas in poor countries, both correlations are negative and significant (Pagano 2004). Banerjee and Duflo (2003) use non-parametric methods and find an inverted U-curve between inequality and growth. This is consistent with Benhabib (2003) and could explain the inconclusiveness of other studies.27
However, these empirical analyses can only indicate some possible regularities across countries and cannot be considered as diriment. In fact, history, the whole set of institutions and the economic and social conditions of each country can be decisive in indicating the possible effects of inequality on growth and other outcomes. Institutional differences can influence growth, as investment in physical and human capital depends on the security of property rights and the efficiency of policies (North 1981). The direction of causality from institutions to growth has been controlled in an attempt to find an exogenous variation of the former among countries colonised by Europeans. Institutions can emerge and persist that are inefficient, i.e., do not enhance growth, because of politically powerful elites, who dictate policies for rent extraction from the rest of the society (Acemoglu, Johnson and Robinson 2001).
5.6.2 MeasurementofInequaIity
Inequality has a multidimensional nature (Aaberge and Brandolini 2014). It can refer to a number of ‘spaces', such as consumption, income, wealth, utility and capability. The most common spaces are income and wealth.
Utility and capability are less common and more difficult to assess. For each space there can be different dimensions. As to income, dimensions of equality can be factor, personal or geographic distribution. Similar dimensions can be the object of analysis of other indicators. Wealth inequality can refer to total wealth, net of debt; specific wealth items such as houses and land; or financial wealth. For each space and dimension, different indices can be calculated. For example, personal distribution of income can be assessed using synthetic indicators such as the Gini or Theil index or more detailed indices, referring to deciles, quartiles or others.Measurement of inequality is preliminary to any analysis and policy indication. Inequality of personal income and wealth seems to change from one period to the next. In addition, even if some common traits are discernible for the various countries, the size and trends of inequality are often divergent. Finally, the indices used for measuring such traits also can differ. But differences, rather than being detrimental, can be of help in detecting some sources of inequality.
Let us consider income inequality first and then wealth inequality. Income distribution can be assessed not only at a country level but also at a global level. We have different measures of equality in each case. The first such measure calculates inequality between nations across mean incomes without population weighting. The second weighs the mean income of each country by its population. The third, global inequality, is similar to the measure of personal income inequality within a country, as it refers to the income of each person (or family) in the world. The three indexes show a different trend through time (see Figure 5.3), as the first index has increased from 1950 to 2000 and then has decreased. The second index is continually decreasing, especially after 1990, mainly because of the rapid growth of two populous countries, China and India.
Global inequality weighted by population continually decreases as an effect of the higher dynamics of population in developing countries. The third index, i.e. global inequality, as measured by the global Gini coefficient, is available only for the two decades after 1988 and oscillates from one year to the next. This is much higher than inequality within specific countries, being almost twice as high as in the United States, which, in turn, is higher than in Sweden (Milanovic 2013). Below we will deal only with the measurement of income inequality for specific countries and for the world as a whole.As to income inequality within specific countries, the findings of various studies, referring to different periods, countries and indicators, differ. From the end of the Civil War to the start of World War II, the United States shows a profile of rising personal income inequality in terms of the Gini coefficient, mainly as an effect of rising monopolisation. The picture is rather different for European countries (Atkinson 2013: figs. 1-3). A general feature of all these countries is that ‘it was the wars of the twentieth century that, to some extent, wiped the past and transformed the structure of inequality' (Piketty 2013: 118, English edn).
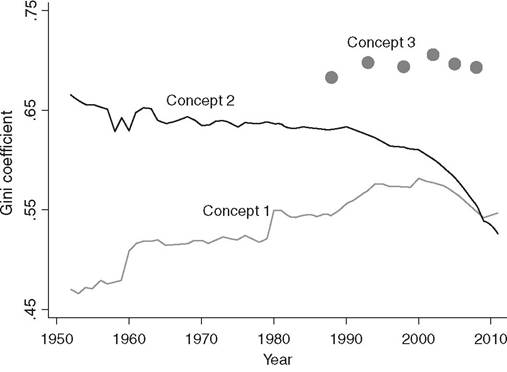
Figure 5.3 International and global inequality, 1952-2011.
(Source: Milanovic 2013)
More recently, the trend in income inequality has changed. With reference to the last three decades, inequality - again in terms of the Gini index - has risen more in transition countries (mainly the Baltic countries), the United States, the United Kingdom and other English-speaking countries, followed by some Nordic countries. It has increased less in other countries, such as Italy, and has remained largely unchanged in Austria, Denmark, France and Germany, in particular, after the eruption of the Great Recession (Salverda et al. 2014).
Some reversal of inequality has taken place more recently in some South American countries, partly as an effect of lower interest rates and higher commodity prices, and in some cases due to a retreat in many places from the free-market policies enacted in the 1980s and 1990s (Galbraith 2016).Using a measure of personal inequality different from the Gini index, this picture is confirmed, and some aspects of the changes are enlightened. In the United States, the share of the top 1 per cent has almost more than doubled from 8 to 9 per cent in 1976 to around 20 per cent in 2011, whereas it has risen less in other Anglo-Saxon countries and much less - or has stayed constant - in major European countries and Japan (Piketty 2013; Alvaredo et al. 2013). The same index also indicates a sharp rising inequality for emerging countries in the last three decades (see Figures 5.4 to 5.6).
As to world inequality, data are only available for the decades after 1998. However, they offer an interesting picture of the gainers and losers. If all the income recipients in the world are ordered from the poorest to the richest as in Figure 5.7, the gainers were mostly low- to medium-income earners from developing countries[86]; in addition, low- to medium-income earners in developed countries lost or had very low gains (Milanovic 2016).[87]
Strictly tied to personal inequality of income is personal inequality of wealth, which is even higher than income inequality. Today, in the second decade of the twenty-first century, inequalities of wealth that had supposedly lowered or disappeared are close to regaining or even surpassing their historical highs (Piketty 2013: 471, English edn). In what follows we will try to throw light on the causes of the rising inequality, both of income and of wealth.
5.6.3 CausesofInequaIity
As to the causes of these trends, if we refer only to postWorld War II experience, a reduction in the Gini coefficient had been fostered until around 1980 by Keynesian policies, active direct redistribution through the public budget and policy interventions in labour and capital markets. After 1980, the rise in inequality was given an important push by pro-market policies favouring liberalisation of goods, labour and capital markets and tax policy.
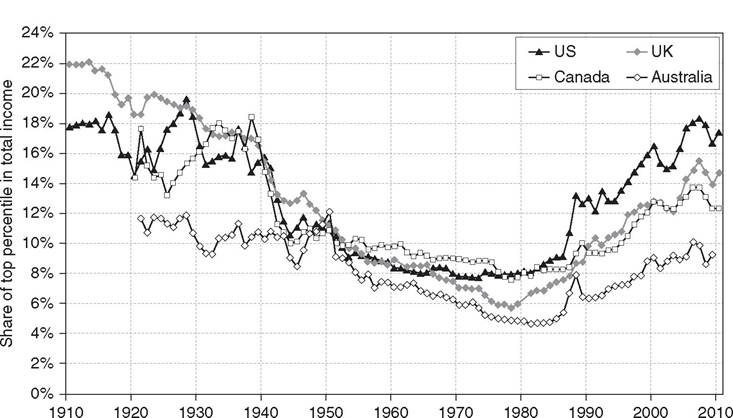
The Share of top percentile in total income rose since the 1970s in all Anglo-saxon countries, but with different magnitudes. Sources and series: see Piketty.pse.ens.fr/capital21c.
Figure 5.4 Top 1 per cent income shares in Anglo-Saxon countries, 1910-2010. (Source: Alvaredo et al 2013)
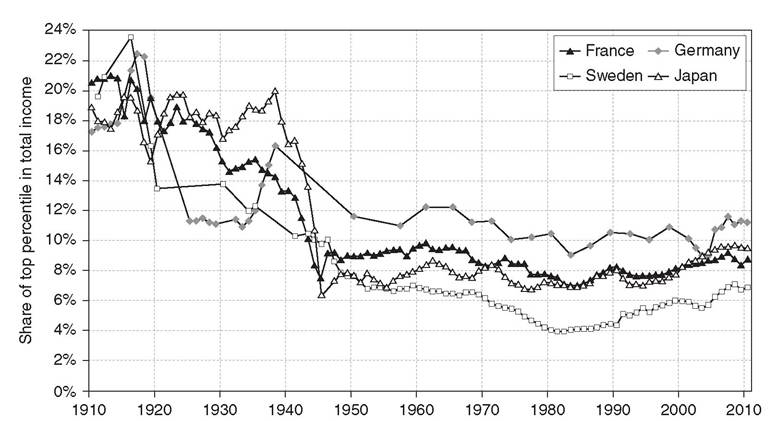
As compared to Anglo-Saxon countries, the share of top percentile barely increased since the 1970s in Continental Europe and Japan. Sources and series: see piketty.pse.ens.fr/capital21c.
Figure 5.5 Top 1 per cent income shares in Continental Europe and Japan, 1910-2010. (Source: Alvaredo et al 2013)
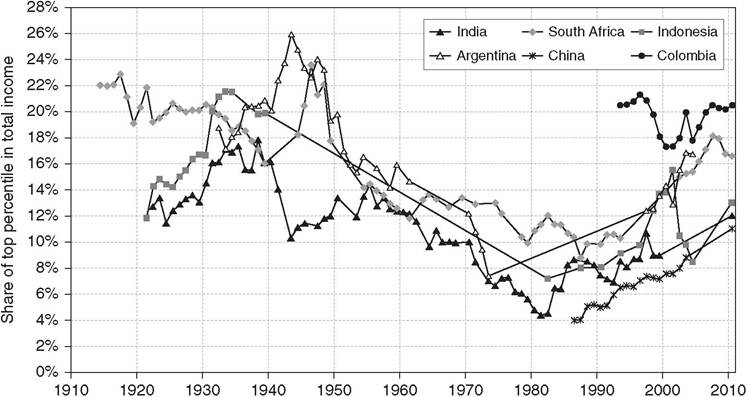
Measured by the top percentile income share, income inequality rose in emerging country since the 1980s rank below US level in 2000-10. Sources and series: see piketty.pse.ens.fr/capital21c.
Figure 5.6 Top 1 per cent income shares in emerging countries, 1910-2010. (Source: Alvaredo et al 2013)
218 The Challenges of the Financial Crisis
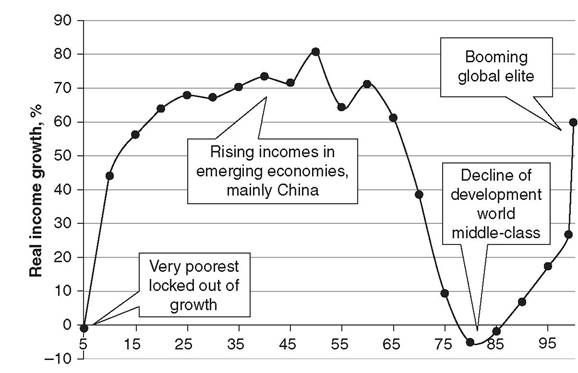
Poorest Percentile of global income distribution → Richest
Figure 5.7 Real income growth by percentile of global income distribution, 1988-2008.
(Source: Milanovic 2013)
In fact, in advanced countries, the liberalisation of markets favoured a drop in earned income, which can be seen from both unadjusted and adjusted labour's share of national income. The former has fallen by around 10 per cent in the three decades to 2010 (Tridico 2017). The latter, ranging in 1991 from 59 to 66 per cent based on country, has fallen by around 4 per cent (Franzini Pianta 2016) (see Figures 5.8 and 5.9).
The role of tax policy is relevant. Its change is the first cause of the rise in the top 1 per cent share of income, as top income tax rates have been lowered (see Table 5.3).[88] Also relevant have been the changing bargaining power of different income earners, individualisation of pay and capital income deriving from accumulation of wealth, favoured also by lower inheritance tax rates (Alvaredo et al. 2013). Moreover, the
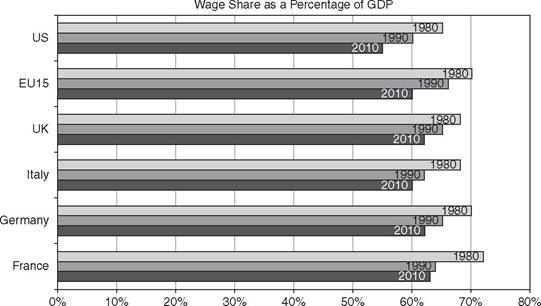
Figure 5.8 Wage shares as a per cent of GDP, various countries, 1980, 1990, 2010.
(Source: Tridico 2017)
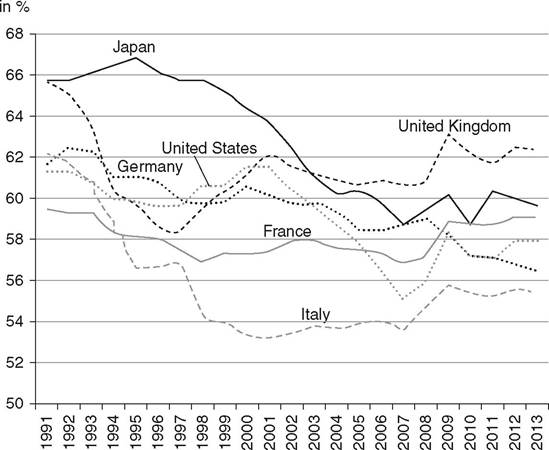
Figure 5.9 Adjusted share of labour income in GDP in selected G20 countries, 1991-2013.
(Source: Franzini Pianta 2016)
Table 5.3 Marginal income tax rates, selected countries (1900-2013)
| France | Germany | United Kingdom | United States | |
| 1900 | 0% | 3% | 0% | 0% |
| 1909 | 0% | 3% | 8% | 0% |
| 1913 | 0% | 3% | 8% | 7% |
| 1918 | 20% | 20% | 53% | 77% |
| 1928 | 33% | 40% | 50% | 25% |
| 1939 | 53% | 60% | 83% | bgcolor=white>79%|
| 1941 | 60% | 60% | 98% | 81% |
| 1944 | 70% | 60% | 98% | 94% |
| 1951 | 60% | 75% | 98% | 91% |
| 1964 | 53% | 53% | 89% | 77% |
| 1980 | 66% | 56% | 75% | 70% |
| 1988 | 57% | 56% | 40% | 28% |
| 2000 | 61% | 51% | 40% | 40% |
| 2005 | 56% | 42% | 40% | 35% |
| 2013 | 53% | 45% | 45% | 40% |
Source: Pedone 2015.
combination of inflation and tax policies implemented has an influence on distribution, as discussed in Chapter 3.
But some of the underlying factors are unclear. Structural imbalances internal to countries - but also tied to financiali- sation, international relations and the global distribution of capital - are likely to be relevant. Inverse relationships between income inequality, on the one hand, and financiali- sation, weakened labour market institutions (for a decline of union density and a reduction in employment protection) and reduced public social spending, on the other, are found by Tridico (2015). It is not strange that income inequality rose less in countries that adopted different policy attitudes, such as some Scandinavian countries. By contrast, the surge in inequality did not derive from technology, or better to say, its role is disputed. The role of education can also be disputed, as in addition to it inequality can be created or amplified by factors deriving from its intergenerational transmission due to networks, soft skills and other factors influencing inequality of opportunities, which are behind the so-called Great Gatsby curve (Corak 2013).
Only partly, and indirectly, was it due to globalisation of goods movements. However, to some extent, immigration and, mainly, financialisation, the liberalisation of goods and capital movements and the capital imbalances that have been created in many countries and areas - such as Europe - have nourished a rise in capital shares, capital gains, bubbles, financial crises and inequalities (Tridico 2012; Dumenil and Levy 2014; Bogliacino and Maestri 2014, 2016; Stiglitz 2015b).[89] An idea of the rising bubbles in the 2000s can be drawn from Figure 5.10.
In addition, globalisation has been given an incentive precisely by pro-market policies and has led to some scaling back of the welfare state and other policies in favour of equity.[90] Similarly, the role of increased education, in particular, in Europe, is not clear probably because ‘the simple increase of educational participation and attainment is too broad a concept for a clear answer to be given' (Ballarino et al. 2014: 144).
The high inequality of wealth is due to demographic reasons (wealth is higher for older people, who represent a higher share of the population) and the inclusion in wealth of debt as a negative component. This enlarges the scale of wealth inequality simply because some people's wealth can be negative. The
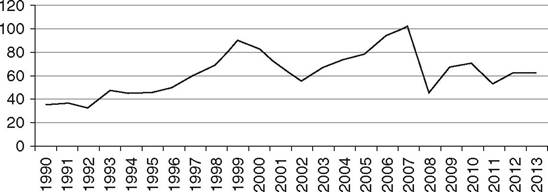
Figure 5.10 Financialisation. Average value of market capitalisation in the stock exchange (per cent of GDP) in thirty- four OECD countries, 1990-2013.
(Source: Tridico 2017)
ratio of wealth to income has increased in the last thirty years as an effect of soaring financial wealth and asset values, but it has declined a little after the financial crisis. This has been accompanied by increasing polarisation of wealth, as both the number of families having zero or negative wealth and the top wealthy families have grown. This growth depended on the increased importance of capital income, diminishing taxation and the allocation of capital to offshore centres. A notable change is also the increasing correlation between capital and labour income.[91] Finally, wealth inequality varies highly between countries, being higher in the United Kingdom, the United States, France and the Scandinavian countries,[92] while East Asian countries, Spain, Ireland and Italy have lower inequality levels (Maestri, Bogliacino and Salverda 2014).
Personal inequality of both income and wealth is linked to worsening factor inequality and, to a large extent, also depends on it. The distribution of income within the labour share has also worsened. Wages of the top 1 per cent of the income distribution have generally risen, more than doubling in the United States and the United Kingdom, whereas labour income for poorer workers has declined (Franzini and Pianta 2016: fig. 2). The decline has derived from lower pay for workers at the low end of skills due to ‘non-standard’ forms of employment (i.e. temporary and precarious jobs), less employment during the Great Recession (ILO 2015) and polarisation between the rates of growth of income and capital.
On the latter factor, Piketty (2013) has dug deeply as a determinant of the distribution of income, referred to all income earners. He shows that the trend in personal inequality has taken a U-form in the last century or so due to the main factor that has accompanied the rise in the average income, i.e. a value of the interest rate that is higher than the rate of growth (see Figure 5.11). This has benefitted wealth owners to the detriment of other income earners.
This is certainly only one of the factors behind the distribution of income. In addition, one should dig further in the determinants of the polarisation between income and capital growth, which have certainly to do with institutional and political factors that are largely country dependent. This point of view is emphasised by Acemoglu and Robinson (2015a), who point out that common stimuli to change have different effects according to the historical, political, institutional and contingent features of each country in a certain epoch. We have indeed shown above that Piketty is certainly aware of the different trends of inequality in different countries.
5.6.4 Policies for Inequality
Among the policies that can be implemented to reduce inequality, some derive from various sources and act on
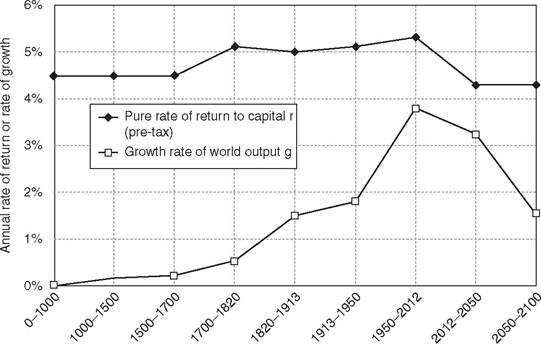
The rate of return to capital (pre-tax) has always been higher than the world growth rate, but the gap was reduced during the 20th century, and might widen again in the 21st century, sources and series: see piketty.pse.ens.fr/capital21c
Figure 5.11 Rate of return versus growth rate at the world level, from antiquity until 2100.
(Source: Piketty 2013)
the primary distribution; others derive from the public budget and contribute to the secondary (or net) distribution. The former include both direct actions influencing wages (e.g. minimum wage regulation, collective bargaining and promotion of equal pay across subgroups) and indirect policies acting on employment (e.g. policies aimed at expanding education through equal access to it, policies tending to increase the skills of the labour force and to promote employment, particularly of those at the bottom of the distribution,[93] and actions to improve matching of labour skill demand and supply, including tax and expenditures scaled for different incomes in order to encourage lower-income individuals to move into employment). As noted by Ravallion (2016), some authors criticise direct policy interventions because of their interference with markets, which should be left free to operate to ensure efficiency. The government should limit the redistribution of the outcomes of free markets. This position, which amounts to anti-poverty policymaking being ‘shy’ - as Ravallion says (2016: 477) - about influencing the working of markets, cannot be held, as we also know of market failures in terms of efficiency and, more generally, because efficiency cannot be separated from equity.
Policies acting on the secondary distribution include taxes and public expenditures. In order not to produce negative incentives on one of the factors influencing the primary distribution (employment, as different from its remuneration), taxes and subsidies should be designed in a proper way. They should help or encourage lower-income individuals to move into employment, as already seen in discussing indirect policies acting on the primary distribution (active employment policies such as support for job search, training, childcare expenses, transportation, etc.; ILO 2015). Piketty (2013) suggests a number of actions to fight inequality. In particular, in order to hit what he thinks to be its principal cause - i.e. the high level of the real interest rate - a highly progressive tax on capital at a global scale (or, more pragmatically, at least at a regional or continental scale) should be implemented, together with enhanced financial transparency, which would add in exposing wealth to democratic scrutiny. This proposal is certainly difficulty to implement. It is true that the proper level for doing so is the world level, but the possibility of agreeing on such a deep and incisive decision is very low, also due to fierce opposition of rich people and, more generally, of those who would loose from the change. Possibly, a more feasible route is to proceed by steps, not only trying to enforce it to a more limited geographic scale (as proposed by Piketty himself) but also trying to solve some issues that facilitate tax evasion or elusion, such as existence of tax holidays.
As a whole, redistributive efforts matter, even if it is difficult to disentangle the effect of the different measures (Marx and Van Rie 2014).
5.7
More on the topic Fighting Inequalities:
- Why did fighting break out in eastern Ukraine in the spring of 2014?
- Reasons for Visiting the Sorcerer
- INTRODUCTION
- GLOBAL IMPACTS
- Political Developments
- Conclusion
- “Our” Universal Peace: From Christ to Constantine
- IMPACTS ON COLONIZED PEOPLES AND TERRITORIES
- Harmonies and Antinomies of Ancient China
- MAINSTREAM ISLAM REJECTS FREEDOM OF CONSCIENCE