Agent-Based Simulation for Investigating Genetic and Cultural Transmission
11.3.1 Motivation
Our aim in using agent-based simulation is to experiment with a new set of parameters to broaden our horizons for reconstructing past phenomena. Our model is related to dual inheritance theory, as we want to observe how genetic and cultural traits spread, but the situation assumed in our model differs from the major models that have been established in other studies of neolithic expansion, being more focused on the relationship between kin-relations and the transmission of cultural skills in the context of realistic demographic dynamics.
Kinship is at the core of social structure for many segmented societies. Marriage is important as it creates and/or strengthens social relationships between groups. For hunter-gatherers, social networks based on kinship are important as a safety net in case of economic crisis, and also serve as the basic system for the transmission of information. In previous studies on the neolithic diffusion process, relocation of the next generation to obtain new land for cultivation has been considered the main mode of demic diffusion, and cultural diffusion mainly assumes adoption of cultivation by hunter-gatherers irrespective of kin relations to farmers. While such a clear distinction may be useful for examining differences between the two modes of diffusion, it may obscure the real process of transmission where kinship plays an important role.
As pointed out above, the nature and extent of migration from northern Kyushu eastward, and how different patterns of migration and acculturation may distribute both genes and cultural traits, are not well understood. Our simulation project intends to gain basic understandings of the relationships between the migration rate and the spread of genetic traits, and how social learning conditions affect the spread of cultural skills under realistic demographic dynamics.
There are no concrete arguments about the size and/or frequency of migrations within the Japanese archipelago in the Incipient and Early Yayoi periods; it is often assumed that the earliest settlement with Yayoi culture in each area was established partly or entirely by new Yayoi settlers. This image is similar to that of the wave-of-advance model proposed for agricultural expansion in Europe. The change from Jomon to Yayoi material culture looks drastic, but indigenous, local cultural traditions can also be recognized in the transitional period in each area. This means that people possessing Yayoi material culture and practicing agriculture did not just split and establish new villages, but always moved into areas or settlements where indigenous people lived, and intermingled with them.
The appearance of Yayoi cultural traits such as Ongagawa-style pottery and rice production as a set indicates that demic diffusion was involved to some extent, but settlement sites with the earliest Yayoi traits are almost always found close to Final Jomon sites in the same area. Some archaeologists regard this situation as evidence of the coexistence of hunter-gatherers who retained Jomon cultural traditions and newly arriving farmers with Yayoi culture. Although this may be the case in some instances, it is reasonable to consider that Yayoi culture may also have spread through other sequences of events. For example, at first a small number of inhabitants of a “Jomon” settlement may have started to adopt Yayoi cultural traits, then the number of such inhabitants increased, and when they finally became the majority they relocated their settlement to land more suitable for wet rice agriculture (Mikasa and Wakabayashi 2011).
In the Jomon period and probably also in the Incipient and Early Yayoi periods, population density in western Japan was low. Settlement size remained generally small and duration tended to be short, suggesting that life was rather mobile. In such small-scale societies, the movement of individuals from group to group should be easier compared to more sedentary societies with a strong sense of territoriality.
Such sporadic movement of people would be beneficial for the reproduction of a small-scale population and for intergroup communication. Recent study shows that a number of pieces of Obora-style pottery, which is produced in the Tohoku region, have been found in Incipient and Early Yayoi sites in western Japan (Kobayashi 2013). While this may indicate that long-distance interactions played an important role in the transitional period, it also suggests there was some westward movement of people. Therefore, we should not restrict the direction of movement to eastward.Neither a typical demic diffusion model nor a cultural diffusion model seems to fit the archaeological observations stated above. Therefore, before assuming a one-way, one-time event of a large-scale eastward migration, we should explore how cultural skills and genetic traits spread under ordinary, ad hoc movements of people. Moreover, it is readily imagined that the remarkably steady spread of cultural traits exhibited in the Yayoi case would be impossible without some form of transmission bias, should we adopt a low-level, random migration model.
Some cultural traits such as pottery decoration may be regarded as neutral and can be understood with models of drift and random transmission (Shennan and Wilkinson 2001; Shennan 2011). But the spread of Yayoi culture, whose central feature is the adoption of agriculture, is a case of the diffusion of innovation where biased transmission should play a major role. It is known that the spread of innovation usually takes an S-shaped increase when the adoption starts with a relatively small number of adopters at the first stage, followed by a rapid increase in adoption before a final phase of slowing down. It has been pointed out that some form of biased transmission is necessary for this pattern to emerge (Henrich 2001; Henrich and McElreath 2003). While there are various reasons for bias in cultural transmission, when it is grounded in the ways that individuals select their mentors for learning cultural skills, the bias could stem from direct assessments of the cultural skills, the social prestige of the person with the skill, or whether the majority of people possess the skill (Henrich 2001).
Some form of model-based bias, probably a skill-bias or success-bias, is assumed in our model. New knowledge and skill in food production would likely be appreciated by hunter-gatherers who are already familiar with the cultivation of beans (Obata et al. 2007). It is also well known from ethnographies that hunter-gatherers often reject the adoption of agriculture even when they are in close contact with farmers, but such cultural barriers would be lowered if the bearer of new culture is not a stranger but a relative.We should be careful in estimating the productivity of the earliest phase of rice agriculture, as population increase does not seem to have resulted soon after its adoption but becomes evident only after several hundred years. The adoption of agriculture definitely increased the productivity of the group, which eventually resulted in a significant population increase, so it is a more adaptive cultural trait. On the other hand, the transition from hunting and gathering to farming accompanies some risk. It is reported that skeletal remains from the Early Neolithic show more stresses compared to their hunter-gatherer predecessors (Cohen and Armelagos 1994), although an increase in stress at the beginning of agriculture is not evident in the case of the Jomon-Yayoi transition.
11.3.2 Simulation System
The simulation system we developed is a multi-agent system. In this system, an individual is implemented as an agent. The purpose of the simulation is to observe how genetic traits and cultural skills are transmitted through kin-relationships
Table 11.1 Simulation parameters
| Parameter | Values/Descriptions |
| Number of years | 500 |
| Number of areas | 5 |
| Initial population per area | 300 |
| Destination of migration | Area(s) directly adjacent |
| Pattern of migration | M1: Individual migration with a probability of 0.001 per year M2: Individual migration with a probability of 0.01 per year M3: Family migration with a probability of 0.001 per year (agent plus her or his relatives within two degrees of relationship) |
| Marriage rule | Start looking for a spouse at the age of 15 |
| Age difference of a couple no greater than 10 years | |
| Monogamous | |
| No divorce | |
| Remarry after death of a spouse | |
| Reproduction | Married females reproduce according to the birth rate (Table 11.2) |
| Genetic trait | One-locus two-allele model Yayoi type = YY, Jomon type = JJ, Hybrid type = YJ |
| Initial genetic distribution | Agents in the area A = YY, agents in areas B, C, D, E = JJ |
| Cultural skill | 1 or 0 |
| Initial skill distribution | Agents in the area A = 1, agents in areas B, C, D, E = 0 |
| Age of skill acquirement | 7 |
| Transmission of skill | From an agent in the same area L1: Random L2: From a relative with a positive skill value if there is one within two degrees of relationship L3: Random from among relatives within two degree of relationship |
without significant one-way migration as supposed in the wave-of-advance model.
Parameters used in the simulation are shown in Table 11.1.The system has areas that represent geographical divisions, or regional boundaries of populations. Areas are connected, and the connections of these areas can be logically represented as a graph in which an area is a node and a connection between areas is an edge. Individuals are born in one of the areas and can move through the connections to others, if she or he decides to move. The system determines if the migration occurs for each individual according to the migration rate.
In our simulation we set five areas connected in series, as areas A-E. Three hundred individuals are generated in each area at the start of the simulation, and data are taken for 30 years until the population structure stabilizes. The size of the initial population may be too modest if it is supposed to represent actual regional populations at the beginning of the Yayoi period, although the latter are difficult to estimate. In order to check if the number of agents affects qualitative features of the output, we experimented with an initial population of 3,000 per area. As the results showed no significant difference due to the increased number of agents, we decided to use the smaller number for efficiency.
Birth and death rates of an individual agent were based on ethnographic and obstetrical data and set to adjust as the population gradually increases (Tables 11.2 and 11.3). The birth rate is a combination of the pregnancy and successful delivery rates. The latter is defined according to age group. The maternal mortality rate is set at 0.01. We are aware that the birth rate setting, configured with a more micro-scale demographic analysis in mind, is too complicated for the current purpose of the simulation, but we kept it in that form because it would not affect the result. The death rate is defined according to age group, with higher death rates for babies and seniors. Population increase or decrease can be controlled to some extent by adjusting the birth and death rates, although the results can vary because of the stochastic nature of the simulation.
An individual is born as a female or a male with a 50 % probability and has knowledge of her or his blood relationship, so that we can set an incest taboo.Each agent has two parameters: a genetic trait and level of cultural skill. The genetic trait is intended to represent a set of genes responsible for the morphological difference between Jomon and Yayoi phenotypes and is defined by a simplified one-locus two-allele model. At the start of each run, all agents in the area A have
Table 11.2 Probability of pregnancy for each age category of married female agents. The probability of successful delivery is 0.8
| Age category | Probability of pregnancy |
| 0-14 | 0.0 |
| 15-19 | 0.25 |
| 20-29 | 0.35 |
| 30-35 | 0.3 |
| 36-42 | 0.2 |
| > 43 | 0.0 |
Table 11.3 Probability of death for each age category
| Age category | Probability of death |
| 0 | 0.25 |
| 1-5 | 0.08 |
| 6-10 | 0.04 |
| 11-35 | 0.02 |
| 36-50 | 0.035 |
| 51-70 | 0.06 |
| 71-75 | 0.1 |
| 76-80 | 0.5 |
| > 80 | 1.0 |
the Yayoi type genetic trait YY and those in the other areas have the Jomon type genetic trait JJ. A child inherits randomly one of the two alleles of each parent.
A simplified binary model is used for cultural skill which may represent knowledge and technology related to wet rice agriculture. An agent's cultural skill level is 0 at birth. If she or he reaches the age of seven, the individual chooses a master and copies that person's level of cultural skill. Copying errors are not considered in the model for simplification. The system has the following three conditions for choosing a master, to simulate the effect of social learning in a simplified manner.
L1. Choose one randomly from all individuals in the same area who are older than the individual.
L2. Choose one who has cultural skill among relatives within two degrees of relationship who live in the same area if available.
L3. Choose one randomly among older relatives within two degrees of relationship who live in the same area.
At the start of each run, all agents in area A have a cultural skill level of 1 and those in all other areas have a cultural skill level of 0.
As for migration, we experimented with the following three conditions to see the effect of the migration rate and whether kinship-based migration has any effect on the speed of genetic or cultural transmission.
M1. An individual moves alone with a probability of 0.001 per year. M2. An individual moves alone with a probability of 0.01 per year.
M3. An individual moves with her or his relatives within two degrees of relationship with a probability of 0.001 per year.
Each individual can move to an adjacent area, meaning that individuals living in area A can move only to area B, while those in area B can move to either area A or C, at the specified rate of probability for each year.
We set the marriage rules as follows. An agent starts to look for her or his spouse at the age of 15. If an individual finds an unmarried agent of the opposite gender living in the same area, whose age is at least 15 and within ±10 years of the individual's own, they marry. For the sake of simplicity, monogamous marriage is the rule, although we are aware of the possibility that polygamy might have played an important role in the spread of genetic and cultural traits at the beginning of Yayoi culture, and have started examining its effect on genetic and cultural transmission (Matsumoto and Sasakura 2015). Agents can get married while they are alive, and remarry after the death of a spouse. Remarriage especially for younger females is considered vital due to the risk of the population dying out given the rather high mortality.
We ran 20 simulations for 500 years for each combination of the three conditions each for social learning (L1, L2, L3) and migration (M1, M2, M3), and examined the results of population increase, spread of genetic value, and spread of skill value.
11.3.3 Results
Means of the 20 runs are shown in the Fig. 11.2, 11.3, 11.4, 11.5, 11.6, 11.7 and 11.8. As the population increase and the spread of the Yayoi genetic trait were not affected by the social learning condition, only the results of the L1 condition are shown. The rate of population increase shows considerable fluctuation due to the stochastic nature of the simulation. The smallest population at the end of the simulation for 500 years in all runs was 749 (area A under the M3 condition) while
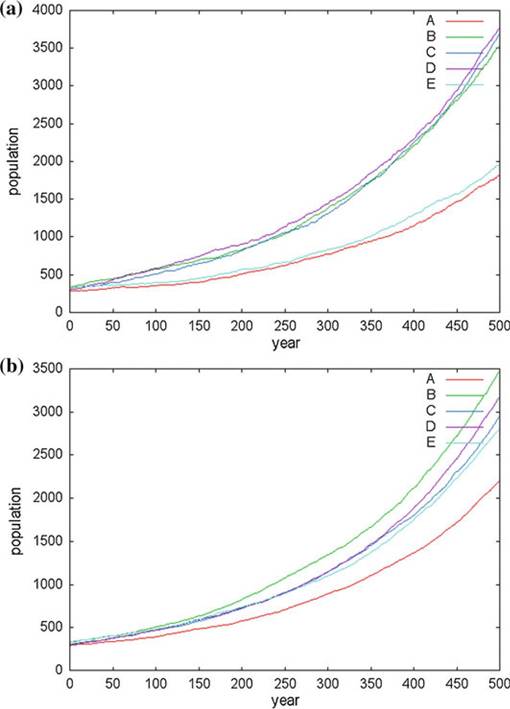
Fig. 11.2 a Population increase under conditions M3 (family migration with a probability of 0.001 per year) and L1 (random transmission of skill from an agent in the same area) b Population increase under conditions M1 (individual migration with a probability of 0.001 per year) and L3 (random transmission of skill from among relatives within two degree of relationship)
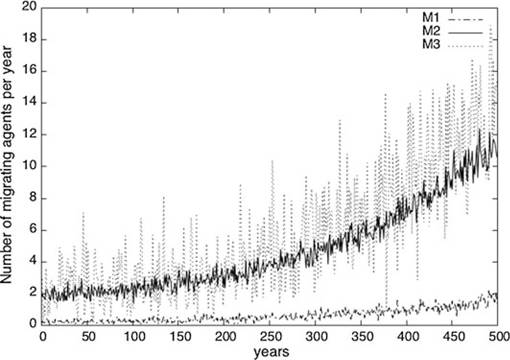
Fig. 11.3 Number of agents migrating per year for conditions Ml (individual migration with a probability of 0.001 per year), M2 (individual migration with a probability of 0.01 per year), and M3 (family migration with a probability of 0.001 per year)
the largest was 5,862 (area D under the M2 condition). In the case of conditions M2 and M3, the population increase rate in areas A and E tended to be slower than in other areas, probably due to a smaller incoming migration as those areas have only one place each supplying and receiving migrants, while the other three areas have two apiece (Fig. 11.2b). This effect is not significant in the Ml condition as the number of migrating agents is small (Fig. 11.2a).
The actual number of agents who move per year under the M1 condition is very small (Fig. 11.3). In the M2 condition, about two agents move every year from the start and the number of migrating agents increases to more than 10 agents near the end of the run. The number of migrating agents does not significantly differ between the M2 and M3 conditions, although the number of people moving per year shows much more fluctuation for M3, because it depends on the number of relatives of the person who decides to migrate.
Although our simulation is not intended to replicate the actual processes of the Jomon-Yayoi transition, the population increase rate in the simulation is consistent with the estimated population increase from the Final Jomon to the Yayoi period based on the number of archaeological sites. Population density in western Japan was quite low in the Jomon period but significantly increases in the Yayoi. Estimated population in the Early Yayoi period can be more than ten times that of the Final Jomon in many areas (Koyama 1978).
However, patterns of the spread of genetic value and skill value seem unaffected by such differences in population increase. The spread of genetic value was almost constant as different migration rates were applied. In the case of M1 where the migration rate is very low, the spread of the Yayoi genetic trait is also very slow
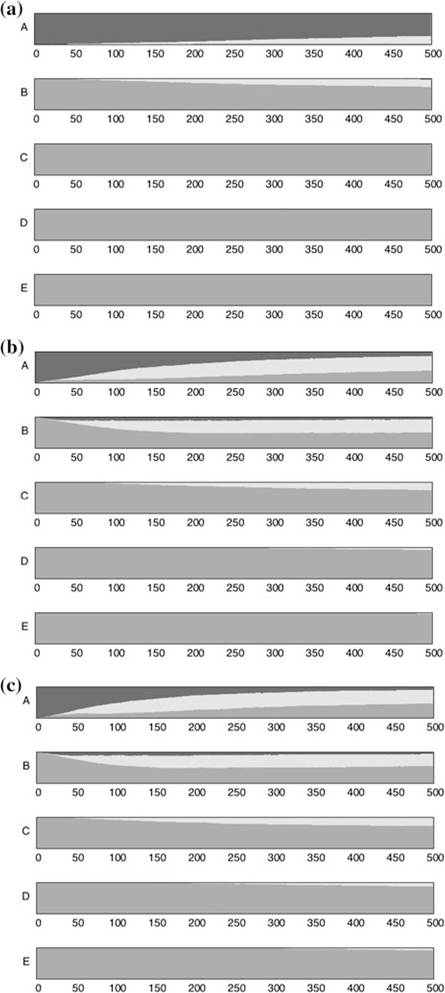
Fig. 11.4 Spread of the Yayoi genetic trait under conditions a Ml (individual migration with a probability of 0.001 per year) b M2 (individual migration with a probability of 0.01 per year) c M3 (family migration with a probability of 0.001 per year) Dark gray = Yayoi type; light gray = hybrid type; gray = Jomon type
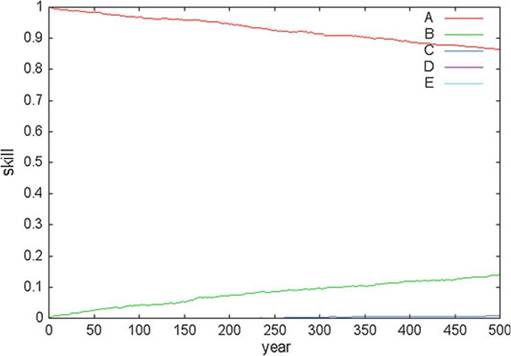
Fig. 11.5 Spread of cultural skill under conditions L1 (random transmission of skill from an agent in the same area) and Ml (individual migration with a probability of 0.001 per year)
(Fig. 11.4). There appear to be some heterozygous individuals slowly increasing in area B over 500 years, but the homozygous Yayoi population is almost entirely restricted to area A. In the case of M2, the number of migrating people is 10 times greater than that in the case of M1. In this condition, the Yayoi genetic trait spreads quicker and the ratio of homozygous Yayoi population decreases. The genetic composition in area B becomes similar to that of area A and about one fourth of the population in area C is heterozygous, but the Yayoi genetic trait barely enters areas D and E (Fig. 11.4a). This situation may fit the physical anthropological evidence in some respects. In the M3 condition, genetic traits spreads slightly quicker than in M2, although the difference is not significant (Fig. 11.4b, c).
On the other hand, the spread of cultural skill showed distinctly different patterns according to the way to choose a master. If individuals select masters at random in the same area, skill spreads very slowly. In the M1 condition, individuals who acquire cultural skill appear in area B soon but barely appear in area C around 250 years after the start (Fig. 11.5). The mean skill value learned at age 7 slightly increases in areas B and C, while that in area A gradually decreases.
If social learning is random, cultural skill spreads rather quickly when the number of migrating people increases in the M2 condition (Fig. 11.6a). Individuals with cultural skill appear in area E in about 200 years. By contrast, the ratio of agents with cultural skill in area A decreases to less than half of the population in 500 years. The result of the M3 condition is similar to that of M2, but the mean cultural skill of area A decreases slightly more (Fig. 11.6b). We have not been able to determine whether this difference is caused by the migration pattern or just by the difference in the number of migrating agents.
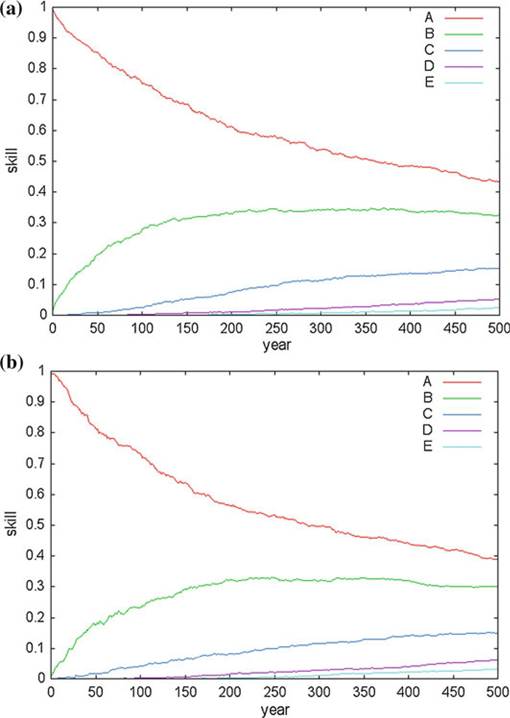
Fig. 11.6 Spread of cultural skill under conditions L1 (random transmission of skill from an agent in the same area) and a M2 (individual migration with a probability of 0.01 per year), b M3 (family migration with a probability of 0.001 per year)
In the L2 condition of biased transmission, a totally different pattern emerges. If one can learn from a skilled relative, about one third of the population in area B acquires cultural skill in 100 years even when the migration rate is very low (Fig. 11.7a). The level of skill does not drop during the diffusion process. Individuals with cultural skill appear in the most distant area E by around 300 years even in the M1 condition, although it takes a long time for the cultural skill to be shared by most of the population in the area. In the M2 condition, culture diffuses quickly (Fig. 11.7b). In about 300 years, cultural skill is held by everyone in all the areas. In the M3 condition, the spread of cultural skill is higher than in M2
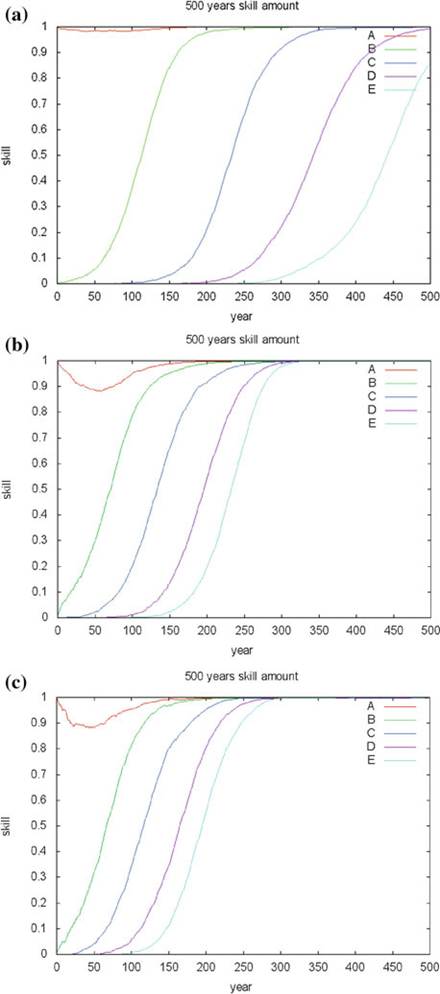
Fig. 11.7 Spread of cultural skill under conditions L2 (transmission of skill from a relative with a positive skill value within two degrees of relationship) and a Ml (individual migration with a probability of 0.001 per year), b M2 (individual migration with a probability of 0.01 per year), c M3 (family migration with a probability of 0.001 per year)
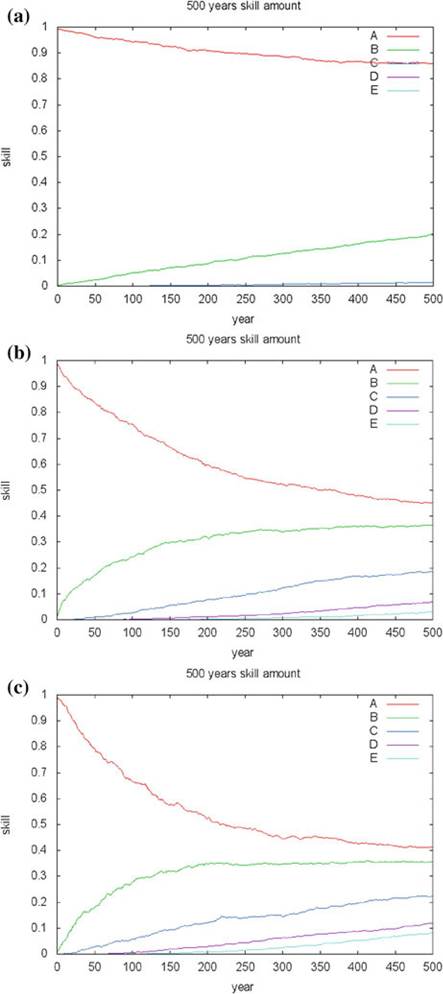
Fig. 11.8 Spread of cultural skill under conditions L3 (random transmission of skill from among relatives within two degree of relationship) and a Ml (individual migration with a probability of 0.001 per year), b M2 (individual migration with a probability of 0.01 per year), c M3 (family migration with a probability of 0.001 per year)
(Fig. 11.7c). This may be because there are more migrating agents in the M3 condition, but the difference between individual (condition M2) and family migration (M3) may be affecting the speed of cultural diffusion, as the number of migrating agents per year does not seem to differ so much during the first 200 years (Fig. 11.3), while a difference in diffusion speed can be observed in this period.
Results with the L3 condition indicate that if there is no preference for cultural skill at all, the resultant pattern of spread is basically the same regardless of the method of master selection (Fig. 11.8). The result would be different if we limit the possible master to parents, as it would resemble the spread of the genetic trait. However, in a society where the average life span is much shorter than that of modern developed societies, it is not uncommon that either one or both parents die before the child becomes old enough to acquire cultural skill. We experimented with a condition restricting the master-apprentice relationship to parent and child, and realized that many children would be left alone without a master and thus cultural skill would be lost eventually. This implies that unlike genetic transmission, strictly vertical transmission cannot be assumed for cultural transmission in most prehistoric societies, and if one can learn from any living relatives, the transmission pattern can be very different from that of genetic transmission. There seems to be a subtle difference between M2 and M3 in the L3 condition as well. As in the case of L1, the ratios of agents with cultural skill in the five areas converge faster in the M3 condition than in M2. Although we are not certain at the moment how family migration contributes to this phenomenon, sporadic group migration may facilitate the spread of cultural skill more than constant individual migration.
The following insights were gained from the analysis.
1. The rate of population increase can vary considerably due to chance factors, while the spread of genetic trait is almost constant as different migration rates were applied.
2. Cultural skill can spread quickly without much loss in the case of biased transmission, even when the migration rate is very low.
3. The spread of cultural skill without significant genetic influence is possible even when cultural transmission is restricted to between relatives.
4. Strictly vertical transmission cannot be assumed for cultural transmission in most prehistoric societies, and if one can learn from any living relative, the transmission pattern can be very different from that of genetic transmission
11.4
More on the topic Agent-Based Simulation for Investigating Genetic and Cultural Transmission:
- Chapter 11 Cultural and Genetic Transmission in the Jomon-Yayoi Transition Examined in an Agent-Based Demographic Simulation
- Chapter 2 Multi-scale Agent-Based Simulation of Long-Term Dispersal Processes: Towards a Sophisticated Simulation Model of Hominin Dispersal
- Agent-Based Modeling and Simulation
- Agent-Based Computer Simulation
- Several design routes regarding the trading agent type, market mechanisms, traded assets, time, and validation have been used in previous works on agent-based financial markets (Lebaron, 2001a).
- Challenges for Scaling Agent-Based Modeling
- Possible Forms of the Cultural Transmission Term
- SIMULATING PAYMENT SYSTEMS BY AGENT BASED MODELING
- Chapter 66 The Adoption Process of Payment Cards: An Agent-Based Approach
- AGENT BASED MODELING IN MARKETS AND PAYMENT SYSTEMS: WHICH WAY FORWARD?
- An Agent-Based Approach[607] [608] to Legal Pluralism
- Chapter 18 Modeling the FX Market Traders’ Behavior: An Agent-Based Approach
- Chapter 5 Population Spread and Cultural Transmission in Neolithic Transitions
- Chapter 12 Liquidity Management in the Large Value Payment Systems: Need for an Agent-Based Model’s Complex Approach
- Chapter 13 ZambeziLand: A Canonical Theory and Agent-Based Model of Polity Cycling in the Zambezi Plateau, Southern Africa
- Chapter 3 An Agent-Based Model of Resource Distribution on Hunter-Gatherer Foraging Strategies: Clumped Habitats Favor Lower Mobility, but Result in Higher Foraging Returns