An Empirical Analysis of Patterns of Consumption
In standard economics textbooks, there is a typical taxonomy of substitutability between coffee and tea, as well as complementarity between coffee and milk. However, such a taxonomy may give us only a superficial classification of price behaviors, because we are less able to decide which good is which by any empirical token.
In the case of complementarity, by definition, an expected behavior merely suggests that demand for each element of a complementary pair has a common direction. But the inverse relation may not hold because of the income effect.Figure 2.8 shows a self-organizing pattern of consumption. We will now move away from the classical inference in the theory of demand. In the classical school, the choice space has no room for a self-organizational force to work. A pattern of consumption is a product of systemic creation. Such a pattern of consumption cannot penetrate the choice space, because this may be partially distorted if choices are largely driven by price variations. In our instance, each income class is characterized by an eigenmode. The free choice set is always about to be encompassed by a self-organizing force emerging from interacting human minds and socio-customs. In some cases, such a force may secure its own direction.
2.3.2.1 An Alternative Way to Affect Household Demand
We now focus on the factors that work together to cause consumer demand fluctuations. There are two main ways to affect household demand:
1. Theincomeeffect
2. Other effects generated by some correlative links (nonrandom factors) either as a result of the necessities of life or some macroscopic business fluctuations.
We use the Japanese economy to monitor the effects of macroscopic correlations among consumption categories of different income classes or heterogeneous agents, and then identify the other nonrandom effects, if any, due to business fluctuations.
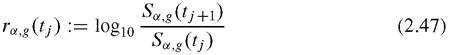
These ideas depend on Iyetomi’s idea (Iyetomi et al. 2011a,b) of distinguishing the principal modes at different industrial levels to construct macroscopic effective demands from random modes using the principle of the random matrix. Iyetomi et al. (2011a,b) showed that there is a structural (nonrandom) cycle in the Japanese economy, and judged the existence of the business cycle by applying the random matrix theory (RMT) to the empirical data of the Indices of Industrial Production (IIP) in Japan.We follow Iyetomi et al. (2011a,b) in using industrial data. The variable is Sa,g(tj/, where a denotes an income class, going from one at the bottom to five at the top, g denotes the ten household expense categories, and tj is expressed by tj = j ∆t. Here It = 1 is a month, and j runs from 1 to N (N = 146 for Jan 2001 to Feb 2012). It then holds for the logarithmic growth rate that:
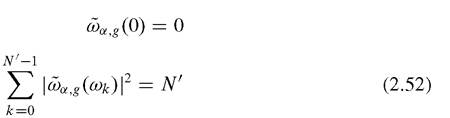
We then normalize them:
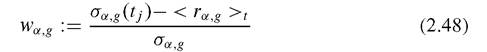
Here < rag >t is the average over all tj, and σαg is the standard deviation of rag over time. The average is zero, and the standard deviation is one, making it suitable for random matrix theory application.
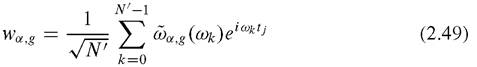
Next, we apply the Fourier decomposition to wag(tj):
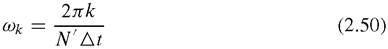
The frequency is defined as:
Since the figures are all real values, it follows that:

It then also follows that:
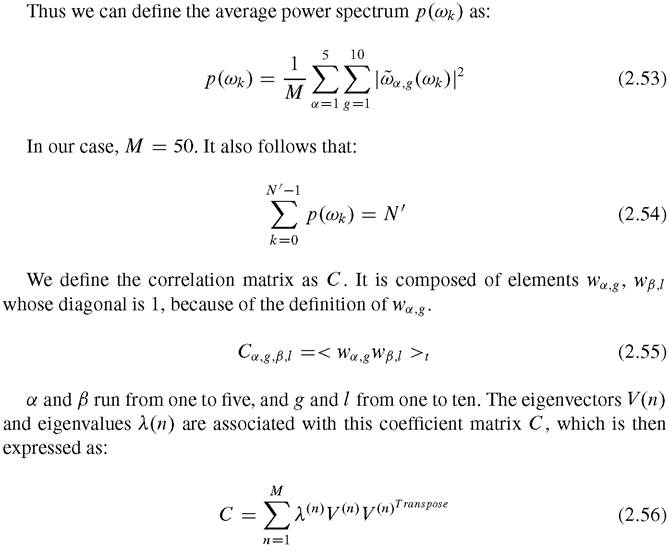
If the data are not all random in the space, we can usually find a distribution of eigenvalues with this configuration, with a few isolated large eigenvalues explicitly separated from the range of smaller values.
The largest group of eigenvalues and associated eigenvectors then corresponds to the dominant factors, which explains co-movements of the fluctuations of different goods. We consider the largest eigenvector to be the first. This vector can be interpreted as the first major or principal component, which accounts for the most influential combination of correlated factors (different goods) over the space of M -dimension. Similarly, the eigenvector for the second-largest eigenvalue is the second principal component that accounts for as much of the correlation as possible in the subspace orthogonal to the first eigenvector, and so on (Iyetomi et al. 2011a). In other words, the second component has an influence independent of the first.2.4
More on the topic An Empirical Analysis of Patterns of Consumption:
- PREPARING THE GROUND FOR EMPIRICAL ANALYSIS
- TERRITORY AND CONFLICT: EMPIRICAL PATTERNS
- EMPIRICAL PATTERNS
- THEORY AND RESEARCH
- LITERATURE REVIEW AND HYPOTHESES DEVELOPMENT
- References and Literature
- Do Negotiators From Different Cultures Use Negotiation Strategies Similarly?
- The Theory of Income Determination
- Glossary
- What Macroeconomists Do