CHALLENGES AND LIMITATIONS
24.4.1 Reconciling Simulated Income with Recorded Income and Macro Statistics
A common problem when using micro-data from surveys for the analysis of policies and income distribution is that aggregate values (e.g., gross earnings or income taxes) do not match estimates from national accounts or other sources of macroeconomic statistics.
This problem also applies to microsimulation studies based on survey data, with one exception. Tax-benefit model calculations of benefit entitlements may match administrative totals better than information on recorded receipt in the data, if there is a problem of underreporting of these sources of income in the survey.Chapter 11 considers the reconciliation of household surveys and national accounts. Here, we focus on a somewhat different issue, also related to the plausibility and usability of empirical findings. This is that the simulated income distribution is not identical to the income distribution that is measured by directly using the underlying survey (or register) micro-data. Typically, measures of income inequality in microsimulated estimates, using the same micro-data and the relevant policy year, are lower. Adjustments in the simulations for the non-take-up of benefits and for tax evasion go some way to reducing the discrepancy, and these issues are discussed in Section 24.4.2. However, they appear not to be the full explanation, and it is clear that the contributory factors differ across countries. Indeed, in some countries for particular datasets and policy years, the differences are small: for example, Figari et al. (2012a) show this to be the case for four EU countries, using data from the EU Statistics on Income and Living Conditions (EU-SILC) and EUROMOD. However, this is by no means always or even often the case, and reconciling simulated and recorded estimates is an important component ofboth the process ofbuilding a tax-benefit model and validating the content of micro-data from surveys.
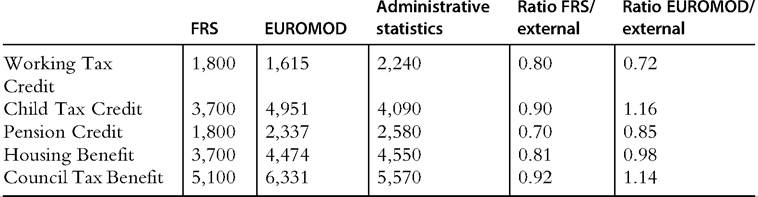
As alluded to above, there is evidence that some surveys underreport recipients of some major cash benefits, when compared with administrative statistics. If the reason for this is failure to report these sources of income by recipients, then simulated benefits may perform better, generally leading to higher incomes at the bottom of the distribution and suggesting that the survey overestimates income inequality. An illustration from the UK is provided in Box 24.2. [549] [550] [551] [552] [553] [554] [555] [556] [557] [558] [559] [560] [561] shortfall is larger. The entitlement here mainly depends on being in low paid work over the year, allowing families to meet the eligibility criteria for the working tax credit for short periods, which is not captured by the simulations based on current income and circumstances. For the other two payments shown in the table, EUROMOD over- rather than underestimates recipiency. The overestimation of Child Tax Credit recipients is to some extent explained by the administrative statistics not containing some long-term recipients of income support, whose child payments are still waiting to be migrated to the tax credit system. Most simulated and nonsimulated benefits are included in the means-test for Council Tax Benefit: its overestimation is expected to the extent that some nonsimulated benefits are underreported and tax credits are undersimulated. Clearly, simulating receipt is not a solution in itself, and a comprehensive reconciliation needs other benefit-specific factors to be taken into account. Numbers of recipients of selected UK benefits in the 2009-2010 tax year: estimates from Family Resources Survey (FRS), EUROMOD, and administrative statistics (thousands) Source: EUROMOD version F6.20 with adjustments for non-take-up, using Family Resources Survey 2009/10 updated to 2010—2011 incomes. Shortfalls in the reported receipt of means-tested welfare benefits compared with administrative information are also found in US surveys on a larger scale (Meyer et al., 2009). Wheaton (2007) uses microsimulation to calculate entitlement and then to calibrate the numbers of recipients so that they match administrative statistics. The result is a large increase in the estimated extent of poverty reduction due to the programs in question. However, as illustrated in Box 24.2, underreporting ofbenefit income may not be the only source of the problem. Ifpart of the reason for the shortfall in the survey is that benefit recipients are more likely to be nonrespondents, then microsimulation of eligibility and entitlement is unlikely to solve the problem on its own, and benefit recipiency estimates will still not match administrative information. In this case recalculation of the survey weights, including controls for characteristics that are correlated with benefit receipt and also underrepresented in the survey, may in principle provide a solution, if such characteristics can be identified and external information is available to control the process. This is not often the case. There are many possible reasons for discrepancies in each simulated income component. Here we discuss income tax as an important example. First, survey estimates of income tax may not relate to the current year or may include only withholding taxes. Second, survey gross incomes (and hence taxes) may have been imputed from net income (see also Section 24.2.1), but their quality and consistency with calculations in the taxbenefit model are usually difficult to establish due to detailed documentation not being made available. We might also expect some discrepancies when the values are compared with fiscal data. Such comparisons need to take national specifics into account, including the nature of the tax structure and administration, as well as the questions asked in the survey. The nature of the comparison and the conclusions that are drawn also depend on whether fiscal data are available at the micro level and whether they can be matched to the survey. Microsimulation estimates of income taxes may be over- or underestimated relative to what is shown by fiscal data. For example, income tax may be underestimated because the market incomes that make up the tax base are underreported or the survey does not adequately represent high-income taxpayers. In this case estimates of income distribution are sometimes adjusted by inflating incomes at the top of the distribution, informed by fiscal data. This is the case for the official estimates of poverty and income distribution produced by the UK Department ofWork and Pensions (DWP, 2013), though the same adjustment is not (to our knowledge) applied in UK tax-benefit models. In contrast, the French model TAXIPP merges micro-data and statistics from many sources for its input database.27 This includes information on top incomes specifically used to correctly capture the very top of the distribution and particularly the taxes paid by that section of the population (Bozio et al., 2012). Income tax may be overestimated because of tax evasion that has not been modeled (see Section 24.4.2) or because it is not possible to model or measure the size of some tax reliefs and common avoidance measures. It may also be under- or overestimated in line with other simulated income components that are taxable. Combinations of these factors may occur, and indeed it is possible for the simulated tax aggregate to match well that from fiscal data but for the distribution of tax paid to be very different—see Appendix B for an example of this. In addition, estimates of gross income and tax liability from fiscal data may be subject to error due to tax evasion. Time periods for income assessments are also important. Generally, simulations are only as good as the underlying micro-data and, in the cases where they are necessary, as good as the imputations and adjustments that must be carried out in the absence of all the necessary information. This in turn depends on the specifics of the national benefit and tax systems as well as the quality of the data. In some circumstances it might be appropriate to calibrate and reweight to try and adjust the baseline simulated distribution of income and its components to match that given by the data directly. Generally, however, such an approach will distort the estimates of change due to a policy reform. A better approach is to try and understand the source of each problem and to make adjustments that can be applied in a consistent way, and with transparent assumptions, across policy scenarios. This highlights the importance not only of validation and adjustment but also of documenting the process so that users of the models and readers of model applications can make their own assessment, based on the research questions at hand. 24.4.2 Modeling Non-Take-Up and Noncompliance One particular challenge arises with benefit non-take-up and tax noncompliance.[562] There is no natural data source with explicit information about these phenomena, and modeling each is highly context-specific. Accounting for take-up and noncompliance behavior in tax-benefit models is important because it affects estimates of fiscal aggregates (i.e., total benefit expenditures and tax revenues), but even more importantly, it can affect various parts of the income distribution in a different way. Furthermore, take-up and compliance behavior are likely to be affected by tax-benefit policy reforms and, hence, are themselves endogenous factors in the analysis. Even if microsimulation models commonly assume full take-up and compliance, this has an important implication for crossnational comparisons as results are unlikely to be consistent, as long as the prevalence and patterns of non-take-up and noncompliance vary across countries. Benefit non-take-up refers to the situation in which those eligible for a given benefit do not successfully claim it for various reasons. This could simply be due to people not being aware of their entitlement (or even the existence of a particular form of public support), being put off by a complex or time-consuming claiming process, or related to social stigma, such as not wanting to appear vulnerable and dependent on others’ support. In an economic context, these factors can be summarized as implied costs related to takeup (Hernandez et al., 2007). Anotherlikely key determinant is the size of the entitlement (Blundell et al., 1988), both in absolute terms and relative to other income sources and wealth of the claimant. Benefit take-up tends to be higher for universal benefits because the claiming process is simpler and the associated social stigma lower. Arguably, people are most likely to claim contributory benefits (e.g., for old age and maternity) because these are directly linked to their own previous contributions and, hence, entitlement is perceived to be more justified, while take-up of means-tested benefits tends to be lower. Therefore, assuming full take-up can distort comparisons between various benefits and make some benefits seem more effective than in fact they are. It also matters how extensive and long-established the benefit scheme is, because the benefit’s scale and longevity contribute to the spread of knowledge among the population. A related phenomenon is benefit leakage, meaning that a benefit is received by those who should not be eligible. This could either indicate an unintentional error on behalf of the benefit administrator or claimant, or benefit fraud. 28 Studies estimating the scale and determinants of benefit take-up require information on eligibility for a given benefit and actual benefit awards. Because benefit eligibility is not directly observed (for a wider population), it must be inferred from relevant individual and household characteristics on the basis of benefit rules, and as such, it constitutes a microsimulation exercise in itself.Depending on the nature of the rules, especially when means-testing is involved, there can be complex interactions with other tax-benefit instruments, as well as with tax compliance. It is difficult to overemphasize the importance of data quality in this context, and most precise estimates can presumably be obtained with administrative data providing information as close as possible to that used by the welfare agencies, as well as actual benefit receipt (e.g., Bargain et al., 2012). Forthis to cover all potentially eligible people and not just claimants, it implies that agencies rely (mainly) on information from existing registries (e.g., tax records) rather than data collection from the claimants. Even then, there can still be some scope for simulation error if the claiming process involves factors such as discretion on behalf of officials awarding benefits. For example, in some countries, local social welfare offices are given a considerable level of discretion in deciding who is in greater need and, hence, more qualified for public support. On the other hand, there could be also errors made by the program administrators in the assessment of the eligibility, resulting in incorrect approval or rejection of the claim. This type of administrative data, if it exists, is usually not accessible, and most empirical studies have relied on survey data instead. There are, however, additional challenges with survey data due to potential measurement error in the observed benefit receipts and other characteristics affecting the eligibility and the entitlement calculation (see Section 24.4.1). For example, survey respondents may have simply forgotten the receipt of a particular benefit, associated it with an incorrect period or benefit type, or intentionally left it unreported (e.g., because of social stigma). Often, there is also a time delay between becoming entitled and receiving a first payment. Therefore, a careful assessment and cleaning of benefit data are usually required (e.g., Hancock and Barker, 2005; Matsaganis et al., 2010). Similarly, individual and household characteristics relevant for determining benefit eligibility and entitlement might be reported with error, especially other income sources and/or assets in the case of means-tested benefits. There have been only a few attempts to model the various errors explicitly (Duclos, 1995, 1997; Hernandez and Pudney, 2007; Zantomio et al., 2010). The modeling of benefit take-up becomes even more complicated when considering the receipt of multiple benefits (e.g., Dorsett and Heady, 1991; Hancock et al., 2004), interactions with labor supply (e.g., Bingley and Walker, 1997, 2001; Keane and Moffitt, 1998; Moffitt, 1983) or dynamics in take-up behavior (e.g., Anderson and Meyer, 1997; Blank and Ruggles, 1996). Analyses combining several of these aspects are rare (e.g., Chan, 2013), and avoiding behavioral responses in other dimensions, such as labor supply, is one reason why many of the recent advances in take-up modeling have concentrated on take-up among the retired or others unable to work (e.g., Hernandez and Pudney, 2007; Pudney et al., 2006; Zantomio et al., 2010). Much of the applied research has been done for the UK and US (see above), but, among others, there are also studies for Canada (Whelan, 2010), Finland (Bargain et al., 2012), Germany (Bruckmeier and Wiemers, 2012; Riphahn, 2001), Greece and Spain (Matsaganis et al., 201 0).[563] For recent reviews, see Hernanz et al. (2004) and Currie (2004). Despite general progress with modeling take-up, it remains a challenge to deal with in microsimulation models due to the data requirements and complexities involved. Ideally, tax-benefit models should treat take-up endogenously in simulations, because policy reforms can change take-up behavior (e.g., Zantomio et al., 2010). Such attempts remain scarce (see Pudney et al., 2006). A second best approach is to predict the probability of take-up conditional on personal characteristics that are not affected by policy changes and hence remain constant in policy simulations. To predict take-up on the basis of previously estimated statistical models, the same explanatory variables need to be present in the data used for the tax-benefit model. Furthermore, take-up is highly circumstantial, and a prediction model developed for one benefit in one country is unlikely to perform satisfactorily for other benefits or countries. A simpler approach commonly used to account for incomplete benefit take-up in tax-benefit models is to assign take-up randomly among the group of eligible units for a given benefit such that the aggregate take-up rate matches that in official statistics or previous studies (e.g., Hancock and Pudney, 2014; Redmond et al., 1998; Sutherland et al., 2008). This is obviously a rather crude approach because some people are more likely to claim than others, and, hence, it may not be sufficient to align aggregate benefit expenditure with official statistics, particularly if take-up is correlated with the level of entitlement. Another option is to link benefit entitlement to the observed receipt, which, however, seriously limits the scope for simulations. Tax noncompliance (or tax evasion) is the other side of the coin and refers to intentional effort to lower tax liability in unlawful ways. In the context of tax-benefit models, this primarily concerns income tax and payroll tax evasion, in the form of underreporting taxable income or overreporting (income tax) deductions. Compared to benefit non take-up, this is an even more challenging issue for several reasons. First, take-up is binary by nature (i.e., an eligible person either claims or not), but tax compliance is often partial. Second, there is no single data source that would allow the precise measurement of tax evasion. Although tax records contain income reported to the tax authority, “true” income remains unobserved. Third, evading taxes may also affect how related incomes are reported to surveys. These constraints point towards the need to combine and utilize multiple data sources to study tax evasion and help to explain why hard empirical evidence at the individual level is very scarce. Studies estimating the extent and determinants of tax noncompliance by individuals have mainly relied on audited tax records (e.g., Clotfelter, 1983; Erard, 1993, 1997; Erard and Ho, 2001; Feinstein, 1991; Martinez-Vazquez and Rider, 2005). Although tax audits are designed to detect tax noncompliance, these are not often carried out randomly and target those more likely to evade on the basis of initial screening. Repeated and extensive random tax audits, from which insights into tax evasion can be inferred for a broader population, have been primarily carried out in the US. However, even audits are unable to detect all noncompliance, especially income underreporting in which cash transactions are involved, and usually have very limited information on individual characteristics. Surveys offer a much richer set of information on individuals but usually lack a good measure of noncompliance. Some surveys include explicit questions on compliance (e.g., Forest and Sheffrin, 2002), but given its sensitivity, the reliability of such self-reported data is unclear (Elffers et al., 1992). On the other hand, studies such as Pissarides and Weber (1989), Lyssiotou et al. (2004), and Hurst et al. (2014) have relied on indirect methods, employing econometric models that contrast surveyed income and consumption. These, however, are inevitably cruder and allow for a less detailed analysis of compliance. Finally, laboratory experiments are common in tax compliance research, (Alm et al., 1992, 2009, 2012; Laury and Wallace, 2005). Although experiments allow one potential determinant to be isolated from the rest and for clearer conclusions to be drawn about causality, it is unclear how well conditions in the laboratory reflect actual behavior, not least as the subjects are typically students without substantial experience paying taxes. Overall, there is substantial evidence on factors influencing people’s decision to evade taxes. There are also studies showing that tax noncompliance is more prevalent for income sources that are less easily tracked by the tax authority (see Klepper and Nagin, 1989; Kleven et al., 2011). For example, the extent of underreporting income from self-employment is notably higher compared to wages and salaries because the latter are usually subject to third-party reporting (i.e., by employers), which reduces opportunities for evasion (though it does not necessarily eliminate these). Fewer studies have focused on the distributional implications of tax noncompliance (e.g., Doerrenberg and Duncan, 2013; Johns and Slemrod, 2010), some in combination with microsimulation modeling (Benedek and Lelkes, 2011; Leventi et al., 2013). For reviews of theoretical and empirical literature on tax evasion, see Andreoni et al. (1998), Slemrod (2007) and Alm (2012). However, given the highly specific datasets that are often involved in the study of tax compliance, it is not straightforward to utilize previous findings in tax-benefit models, nor is it easy to provide one’s own estimates with the type of data commonly used for microsimulation. This helps to explain why attempts to account for tax noncompliance in tax-benefit models seem to remain very limited (e.g., Ceriani et al., 2013; Matsaganis and Leventi, 2013). On the other hand, this may also reflect the fact that microsimulation studies lack details on such adjustments. Therefore, the first step towards improving the modeling of tax noncompliance (as well as benefit take-up) is increasing transparency about how this is handled (if at all) in existing models and studies. 24.4.3 Assessing the Reliability of Microsimulation Estimates The overall credibility of a microsimulation model in simulating the effects of a given taxbenefit policy encompasses different aspects, some of which are interrelated, and include the application of “sound principles of inference in the estimation, testing and validation” (Klevmarken, 2002). First, the reliability of a microsimulation model is closely tied to its validation and transparency, which are indicated by the extent to which solid documentation exists for the internal features of the model and the validation of the results against external statistics. Unfortunately, a high level of transparency does not characterize many of the microsimulation models used in the academic and policy literature, which tend to be “black boxes.” Good practice is to provide a detailed description of all tax-benefit components simulated, including details of assumptions used, as well as information about the input data and related transformations or imputations. Documented validation of the output against external statistics on benefit recipients and taxpayers and total expenditure/ revenue is also an important component of the informed use of microsimulation models. Nevertheless, such validation is not a comprehensive assessment for three reasons. First, as illustrated in Section 24.4.1, microsimulation estimates and the information available in official statistics may not be comparable conceptually. Second, in some countries, limited external information is available, and in all it is rarely available without a time delay. Third, although it is possible to validate results for existing and past systems, it is usually not possible to find independent estimates of the effects of policy reforms. A correct baseline does not ensure that the model or its input data can correctly estimate the effect of a reform. In addition, as mentioned by Wolf (2004), a persistent failure of most microsimulation applications is the lack of recognition of the degree of statistical uncertainty associated with the results, some of which is inherent in the sampling process that underlies the input micro-data and some of which is propagated from simulation errors and estimated parameters. The accuracy of the underlying data, the correct and detailed representation of the tax-benefit rules, and the actual implementation of the policy parameters in the simulation code determine the point-estimate of the simulated policy. Nevertheless, the correct interpretation of the results should take into account their statistical inference—an aspect often neglected in the microsimulation literature—which also depends on the nature of the model and whether it is purely deterministic or also involves probabilistic or econometric specifications. To start with, simulations are subject to the same degree of sampling error, measurement error, and misreporting as any other analysis based on survey data. On the one hand, as discussed in Section 24.4.1, simulations can improve the accuracy of results by simulating the exact rules rather than relying on observed values that might be misreported. On the other hand, the simulation process can introduce other sources of errors due to, for example, approximations in the simulation of tax benefit rules, adjustments for noncompliance or non-take-up, updating ofmonetary parameters and sociodemographic characteristics to the simulation year, or ignoring behavioral responses or market adjustments. In the case of simulation of the first-order effects of policy changes, Goedeme et al. (2013) argue that the lack of attention to the statistical significance of the results is undesirable and unjustified due to the availability of standard routines embedded in most standard statistical software. Moreover, when comparing the statistics related to different scenarios, they show the importance of taking into account not only the sampling variance of the separate point estimates but also the covariance between simulated and baseline statistics which are based on the same underlying sample. This can lead to a generally high degree of precision for estimates of the effects of a reform on a particular statistic of interest. The situation is much less straightforward in the case of more complex simulations involving revenue-neutral reforms or behavioral reactions that add additional sources of uncertainty due to the use of estimated wage rates for constructing the budget set and the preference parameters estimated using econometric models. Despite the growing literature on estimating the labor supply effects of policy changes (see Section 24.3.3), there are only a few examples of studies focusing on the analytical properties of the sampling distribution of the microsimulation outcomes that are affected by simulation uncertainty and estimation uncertainty. The former stems from the simulated choice set that can be different from the one that an agent would choose in reality. The estimation variability comes from the sampling variability of the estimated parameters ofthe labor supply model (Aaberge et al., 2000). Pudney and Sutherland (1994) derived the asymptotic sampling properties of the most important statistics usually reported in microsimulation studies, taking into account the additional uncertainty introduced by the imposition of revenue neutrality in the construction of the confidence intervals. Pudney and Sutherland (1996) augmented the previous analysis, deriving analytically the asymptotically valid confidence intervals of a number of statistics, allowing for errors associated with sampling variability, econometric estimation of parameters of a multinomial logit model of female labor supply, and stochastic simulation in the calculations. They concluded that sampling error is the largest source of uncertainty, but parameter estimation errors may add additional uncertainty that undermines the practical use of such behavioral models. The complexity of the analytical solution associated with very detailed microsimulation models, rather complex policy simulation and sophisticated econometric models, has lead to the use of more tractable empirical approaches. Creedy et al. (2007) opted for a simulation approach to approximate the sampling distribution of statistics of interest based on the sampling distribution of the estimated parameters. The approach relies on a number of draws from the parameter distribution of the underlying behavioral model. Moreover, they suggest a simpler and more practical approach in which the functional form of the sampling distribution is assumed to be normal, requiring a small number of draws from the parameter distribution and leading to generally accurate results. Furthermore, to avoid having to assume the normal distribution for stochastic terms, and exploiting the increasingly available computer power, assessing the statistical reliability of the estimates now commonly relies on resampling methods such as the bootstrap, which allows one to obtain a set of replicated econometric estimates used in one or more simulation runs. The variance of the replicated estimates is then used to capture the variability of the statistics of interest. Although the additional uncertainty added by behavioral modeling is not found to be critical for most analysis (e.g., Bargain et al., 2014), there are reasons for concern when the estimates refer to specific small demographic groups, and further developments in this research area are needed. 24.5.
More on the topic CHALLENGES AND LIMITATIONS:
- CHALLENGES AND LIMITATIONS
- The Interfaces of Community Groups and Segments
- Textual Challenges to Constitutional Unamendability
- Contents
- Challenges to Dialogue
- THE CHALLENGE IN writing about rights in the Pakistani context is to describe the specificity of their articulation without making exaggerated claims about their distribution.
- In this chapter, we introduce a framework for learning from experience through reflection, an adaptation of Marsick and Watkins’ model of informal and incidental learning (Cseh, Watkins, and Marsick, 1999; Marsick and Watkins, 1990; Watkins and Marsick, 1993) and relate it to the challenges of conflict resolution.
- The Challenge of Ambiguity
- Strategies for Improving Communication and Conflict Management
- Introduction