DATA
6.2.1 Data Sources
It is not difficult to imagine instances where there is a known, finite set of incomereceivers and where the income associated with each income-receiver is observable (example: if there are 50 states in a federation and one wishes to analyze the change in the distribution of announced military contracts awarded by the federal government among those 50 states).
Under those circumstances, a complete enumeration of the relevant “population” (the 50 states) is possible, and the income of each member of this “population” is measured with complete accuracy (from the federal government announcement). There is very little to do in terms of statistical analysis and no data problem. But this kind of example is rarely encountered in practice and might be dismissed as somewhat contrived. It is much more common to have to deal with situations in which an enumeration of the population is impossible and we have to rely on some sort of sample.6.2.1.1 AdministrativeData
Governments and government agencies have long published summaries of income distributions in grouped form; in many countries, official data providers have gone further and made available to researchers microdata from official sources that could be used, for example, to analyze the distribution of income and wealth. The data made available in this way used to be of similar size to sample surveys (discussed later). However, it is increasingly the case that very large data sets have been opened up for research, an order of magnitude larger—effectively complete collections of administrative data rather than official samples from them. It might be tempting to treat these as methodologically equivalent to the complete enumeration case described earlier. But this would overlook two points. First, administrative data will only contain what is legally permissible and what government agencies find convenient to release.
If, for example, one is interested in the distribution of personal incomes, a very large data set of tax records could be extremely useful, but it will miss many of those persons who are not required to file tax returns. Second, the design of the data set may not match what the social scientist or economist would wish: For example, if one wishes to adjust the data to allow for differences in need according to the type of household or family in which each person lives, the required information for constructing an appropriate equivalence scale may not be present in the same data set.6.2.1.2 Survey Data
The problems from administrative data stem largely from the fact that the data are the by-product of information gathered for other purposes. It is clear that specially designed surveys have a potential advantage in this respect. However, although surveys are usually purpose-built (and often purpose-built using advice from social scientists), one also has to be cautious about their limitations. This concerns the smaller size and worse response rate than the administrative data counterparts. Once again the survey design may exclude some sections of the population (a survey based on households would obviously miss people who are homeless and those in institutions), and where there is an attempt to create longer series of surveys, the criteria for the design of contemporary surveys may follow a standardized format determined by conventions that are no longer relevant.
6.2.2 Data Structure
In implementing the statistical criteria discussed in this chapter, one needs to be clear about the relevant assumptions concerning the way the sample was drawn.
6.2.2.1 Simple Design
In the majority of this chapter, we will take it that simple random sampling is an appropriate assumption. By this we mean that the sample has been designed in such a way that each member of the population has an equal probability of being included in the sample.
This can be taken as an ideal case that enables one to focus on the central issues of statistical inference.
Even the supposedly “ideal” case may not be ideal in practice if the sampling frame is inappropriate—it could be out of date or it could be specified in such a way that part of the population is excluded (see the remarks earlier about homeless people).6.2.2.2 ComplexDesign
In practice, there are often simple practical reasons why something other than simple random sampling is used.[181] Two features in particular are often built into the design of the sample. Clustering the observations by geographical location may reduce the costs ofrun- ning the survey, both in terms of initial visits to carry out the survey and in follow-up visits for monitoring and completing missing information. Stratification is a common technique for deliberately oversampling certain categories of respondent to ensure that there is adequate representation in the combined sample of certain types of individuals or households that are of particular interest but that are likely to show up comparatively rarely either because they are genuinely rare in the population or because they are less likely to respond to the survey (for example, it is commonly found that richer households are overrepresented in the “nonresponse” category, and if one were just to ignore that possibility, there would be the danger of having a biased sample). In effect one divides up the population of interest into subpopulations and chooses a sample for each subpopulation—each stratum—at an appropriate sampling rate.
Although the assumption of a simple random sample sweeps aside practical problems associated with the design of the survey, this idealized case gives us a good base for explaining the core issues in estimation and inference. At appropriate points in Sections 6.4 and 6.5, we will comment on the extensions to the complex data case and other related issues.[182]
Other problems with the data merit special discussion. We briefly outline the nature of these problems here and then return to a formal analysis of them (in Section 6.6) after we have extensively discussed conventional inference problems in the preceding sections.
6.2.3 Data Problems
6.2.3.1 Measurement Error and Data Contamination
Measurement error in income distribution analysis can be handled in a way similar to measurement error in other contexts. Observed income is true income adjusted by an error term (Chesher and Schluter, 2002), and the resulting model resembles the problem of decomposition by factor source; data contamination can be represented as a mixture of a true distribution and a contamination distribution. The resulting model resembles the problem of decomposition by population subgroup (Cowell, 2000; Cowell and Fiorio, 2011). However, the appropriate model for analyzing this second type of problem uses tools that are useful for the analysis of questions beyond the narrow data contamination question. This will be discussed in Sections 6.4-6.6.
6.2.3.2 Incomplete Information
In many practical applications, we need to deal with situations in which some parts of the sample space are excluded completely from the sample data or where information in part of the sample is missing; for convenience we will refer to this part of the sample as the “excluded” subset, even though some information may be available. The exclusion of information may be imposed by the data provider, for example, because of reasons of confidentiality, or it may be introduced by the researcher to deal pragmatically with some other problem in the data.
Table 6.2, taken from Cowell and Victoria-Feser (2003), sets out the main cases that are of interest. There are two principal issues for the researcher to consider, as follows:
Boundaries of the excluded subset. What determines the boundaries of the excluded subset of the sample space? There are two possible cases summarized in the rows of Table 6.2: (i) a subset of Y is specified, or (ii) a subset of Q is specified. In the first case, the incomeboundaries of the excluded subset (z, ^z) are fixed, but the proportions of the excluded subsets (β, β) are unknown, although these proportions can be estimated if enough information is available.
In the second case, the boundaries of the excluded sample are fixed by the trimming proportions in the lower and upper tail (β, β), and the incomes at the boundary of the excluded samples (z, z) are unknown.Information in the excluded subset. There are several assumptions about the availability of information in the excluded part of the sample. The situation is going to depend on the particular problem in hand, and the principal cases are summarized in the columns of Table 6.2. At one extreme, the excluded subset is just terra incognita (left-hand column). On the other hand, it may be that the data provider makes available several summary statistics related to excluded subset (right-hand column). 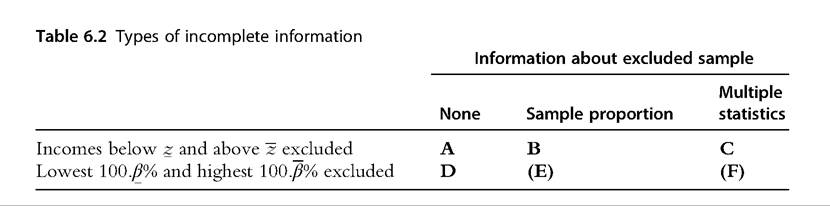
So, in principle there are altogether six possible cases, but in practice only four are relevant:[183]
• Case A is the standard form of truncation.
• Case B represents “censoring”; in this case there are point masses at the boundaries
 that estimate the population-share of the excluded part.[184]
• Case C is an extension of standard estimation problem with grouped data (Gastwirth etal., 1986).
• Case D represents the case of trimming.
The implications of these issues for distributional analysis are considered in Section 6.6.2.
6.2.4 Grouped Data
For reasons of economy and convenience, it used to be common practice for statistical offices to make income distribution data available only in grouped form (see Case C in Table 6.2). Typically, this would involve a simple table with a comprehensive set of preset income intervals, the numbers of individuals or households falling into each interval, and (sometimes) the average income associated with each interval. Tabulated data are less usual today, although researchers are increasingly using historical data to construct long- run time series.
So, it is useful to consider briefly the analytical issues that arise in connection with this type of data.One way of using such data effectively is to estimate the underlying income distribution using parametric modeling. This can be done either by using interpolation methods in each of the intervals (see, for example, Cowell, 2011) or by fitting a distribution to the bulk of the data—suitable parametric methods are discussed in Section 6.3.1. Nonparametric methods are necessarily quite limited because of the restrictions imposed by the data.[185] However, an interesting problem presented by any sort of grouped data is to compute bounds on inequality indices. One uses the available information to compute a maximum-inequality distribution and a minimum inequality distribution by making alternative extreme assumptions about the way the data are distributed within each interval (Cowell, 1991; Gastwirth, 1972, 1975).
6.3.
More on the topic DATA:
- Answers to Analyzing Data 14.1 Questions
- The Epidemiology of BTB in Malawi
- Prevalence and Epidemiology of BTB in Rwanda
- Principles of the Rule of Law, the Factor of Honour, and Pragmatism According to Data from Field Research
- Molecular Epidemiology of Bovine Tuberculosis in Uganda
- Abel A.B., Bernanke B., Croushore D.. Macroeconomics. 10th Edition, Global Edition. — Pearson,2021. — 690 pp., 2021
- EXERCISE
- Introduction