Inequality among the Poor
Given the long-standing interest in inequality among the poor, we first enquire whether M0 can be extended to reflect inequality among the poor. To make a long story short, it can easily do so.
But the problem is that the resulting measure loses the property of dimensional breakdown that provides critical information for policy. So, taking a step back, we consider key properties a measure should have in order to reflect inequality among the poor and be analysed in tandem with M0. Our chosen measure uses the distribution of censored deprivation scores to compute a form of variance across the multidimensionally poor. We also illustrate interesting related applications of this measure: for example, assessing horizontal disparities across groups.Chapter 5 showed that the Adjusted Headcount Ratio (M0) can be expressed as a product of the incidence of poverty (H) and the intensity of poverty (A) among the poor. Thus, M0 captures two very important components of poverty—incidence and intensity. But it remains silent on a third important component: inequality across the poor. Now, the ultimate objective is to eradicate poverty—not merely reduce inequality among the poor. However, the consideration of inequality is important because the same average intensity can hide widely varying levels of inequality among the poor. For this reason, following the seminal article by Sen (1976), numerous efforts were made to incorporate inequality into unidimensional and latterly multidimensional poverty measures.[226]
This section explores how inequality among the poor can be examined when poverty analyses are conducted using the M0 measure (Alkire and Foster 2013; Seth and Alkire 2014a).[227]
9.1.1 INTEGRATING INEQUALITY INTO POVERTY MEASURES
Section 5.7.2 already presented one way of bringing inequality into multidimensional poverty measures.
This was achieved by using M2 or some other gap measure applied to cardinal data, where the exponent on the normalized gap is strictly greater than one. Such an approach is linked to Kolm (1977) and generalizes the notion of a progressive transfer (or more broadly a Lorenz comparison) to the multidimensional setting by applying the same bistochastic matrix to every variable to smooth out the distribution of each variable (the powered normalized gap) while preserving its mean.[228] Poverty measures that are sensitive to inequality fall (or at least do not rise) in this case.A second form of multidimensional inequality is linked to the work of Atkinson and Bourguignon (1982) and relies on patterns of achievements across dimensions. Imagine a case where one poor person initially has more of everything than another poor person and the two persons switch achievements for a single dimension in which both are deprived. This can be interpreted as a progressive transfer that preserves the marginal distribution of each variable and lowers inequality by relaxing the positive association across variables under the assumption that the dimensions are substitutes. The resulting transfer principle specifies conditions under which this alternative form of progressive transfer among the poor should lower poverty, or at least not raise it. The transfer properties are motivated by the idea that poverty should be sensitive to the level of inequality among the poor, with greater inequality being associated with a higher (or at least not lower) level of poverty.[229] Alkire and Foster (2011a) observe that the AF class of measures can be easily adjusted to respect the strict version of the second kind of transfer (the strong deprivation rearrangement property as discussed in section 2.5.2), involving a change in association between dimensions by replacing the deprivation count or score Mα(xi.;z) with a related individual poverty function [Mα (xi.;z)]β for some β > 0, and averaging across persons.[230]
Many multidimensional poverty measures that employ cardinal data, including Mα, satisfy one or both of these transfer principles.[231] Alkire and Foster (2013) formulate a strict version of distribution sensitivity—dimensional transfer (defined in section 2.5.2)—which is applicable to poverty measures such as M0 that use ordinal data.
This property follows the Atkinson-Bourguignon type of distribution sensitivity, in which greater inequality among the poor strictly raises poverty. Alkire and Foster (2013) also prove a general result establishing that ‘the highly desirable and practical properties of subgroup decomposability, dimensional breakdown, and symmetry prevent a poverty measure from satisfying the dimensional transfer property’. In other words, M0 does not reflect inequality among the poor, and, furthermore, no measure that satisfies dimensional breakdown and symmetry will be found that does satisfy dimensional transfer.Given that it is necessary to choose between measures that satisfy dimensional transfer and those that can be broken down by dimension, and given that both properties are arguably important, how should empirical studies proceed? The first option is to employ measures that respect dimensional breakdown and to supplement these with associated inequality measures. The second is to employ poverty measures that are inequality-sensitive but cannot be broken down by dimension, and to supplement them with separate dimensional analyses.
9.1.2 ANALYSING INEQUALITY SEPARATELY: A DESCRIPTIVE TOOL
While both should be explored, this book favours the first route in applied work for several reasons. Dimensional breakdown enriches the informational content of poverty measures for policy, enabling them to be used to tailor policies to the composition of poverty, to monitor changes by dimension, and to make comparisons across time and space. Poverty reduction in measures respecting dimensional breakdown can be accounted for in terms of changes in deprivations among the poor and analysed by region and dimension. This creates positive feedback loops that reward effective policies. Also, the inequality-adjusted poverty measures may lack the intuitive appeal of the M0 measure. Some of the inequality-adjusted measures (Chakravarty and D’Ambrosio 2006; Rippin 2012) are broken down into different components separately capturing incidence, intensity, and inequality, but without clarifying the relative weights attached to these components.
Whether or not an inequality measure is computed, M0 measures can be supplemented by direct descriptions of inequality among the poor. A first descriptive but powerfully informative tool is to report subsets of poor people which have mutually exclusive and collectively exhaustive graded bands of deprivation scores. This is possible by effectively ordering all q poor persons according to the value of their deprivation score ci (k) and dividing them into groups. If the poverty cutoff is 30%, the analysis might then report the percentage of poor people whose deprivation scores fall in the band of 30-39.9% of deprivations, 40-49.9%, and so on to 100%. The percentage of people who experience
Chakravarty and D’Ambrosio (2006), Maasoumi and Lugo (2008), Aaberge and Peluso (2012), Bossert, Chakravarty, and D’Ambrosio (2013), and Silber and Yalonetzky (2014).
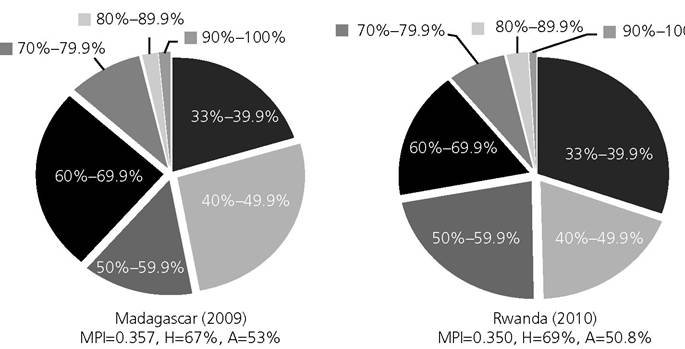
Figure 9.1. Distribution of intensities among the poor in Madagascar and Rwanda
Source: Country briefings, MPI 2013,
different intensity gradients of poverty across regions and time can be compared to see how inequality among the poor is evolving.[232] Figure 9.1 presents an example of two countries—Madagascar and Rwanda—which have similar multidimensional headcount ratios (H) and global MPIs. However, the distributions of intensities across the poor are quite different. Also, data permitting, these intensity groups can be decomposed by population subgroups such as region or ethnicity. The comparisons can be enriched by applying a dimensional breakdown to examine the dimensional composition of poverty experienced by those having different ranges of deprivation scores.
9.1.3 Usingaseparate inequality measure
Another option is to supplement M0 with a measure of inequality among the poor. Using the distribution of (censored) deprivation scores across the poor or some transformation of these, it is actually elementary to create an inequality measure, much in the same way that traditional inequality measures such as Atkinson, Theil, or Gini are constructed.
Such measures will offer a window onto one type of multidimensional inequality—one that is oriented to the breadth of deprivations people experience. This approach is quite different from other constructions of multidimensional inequality, but it is useful, particularly when data are ordinal. Building on Chakravarty (2001), Seth and Alkire (2014a) propose such an inequality measure that is founded on certain properties. Note that these are properties of inequality measures and are defined differently from those presented in Chapter 2 (despite similar names), but introduced intuitively in section 9.1.3.1. Let us briefly discuss these properties before introducing the measure.9.1.3.1 Properties
The first property, translation invariance, requires inequality not to change if the deprivation score of every poor person increases by the same amount. Implicitly, we assume that the measure reflects absolute inequality. Seth and Alkire (2014a) argue that measures reflecting absolute inequality are more appropriate when each deprivation is judged to be of intrinsic importance. In addition, the use of the absolute inequality measure ensures that inequality remains the same whether poverty is measured by counting the number of deprivations or by counting the number of attainments. The use of the relative inequality measure is more common in the case of income inequality, where it is often assumed that as long as people’s relative incomes remain unchanged, inequality should not change. However, it is difficult to argue that inequality between two poor persons who are deprived in one and two dimensions respectively is the same as the inequality between two poor persons who are deprived in five and ten dimensions, respectively, if these deprivations referred to, for example, serious human rights violations. Any relative inequality measure, such as the Generalized Entropy measures (which include the Squared Coefficient of Variation associated with the FGT2 index) or Gini Coefficient, would evaluate these two situations as having identical inequality across the poor.
Moreover, a relative inequality measure may provide a counterintuitive conclusion while assessing inequality within a counting approach framework. In fact, no non-constant inequality measure exists that is simultaneously invariant to absolute as well as relative changes in a distribution.The second property requires that the inequality measure should be additively decomposable so that overall inequality in any society can be broken down into within-group and between-group components. This can be quite useful for policy (Stewart 2010). We have shown in Chapter 5 that the additive structure of the indices in the AF class allows the overall poverty figure to be decomposed across various population subgroups. A country or a region with the same level of overall poverty may have very different poverty levels across different subgroups, or a country may have the same level of poverty across two time periods, but the distribution of poverty across different subgroups may change over time. Furthermore, within each population subgroup, there may be different distributions of deprivation scores across poor persons, thus various levels of within-group inequality can be compared with poverty levels.
The third property, within-group mean independence, requires that overall within-group inequality should be expressed as a weighted average of the subgroup inequalities, where the weight attached to a subgroup is equal to the population share of that subgroup. This assumption makes the interpretation and analysis of the inequality measure more intuitive.
Four additional properties are commonly satisfied when constructing any inequality measure. The anonymity property requires that a permutation of deprivation scores should not alter inequality. According to the replication invariance property, a mere replication of population leaves the inequality measure unaltered. The normalization property requires that the inequality measure should be equal to zero when the deprivation scores are equal for all. The transfer property requires that a progressive dimensional rearrangement among the poor should decrease inequality.
9.1.3.2 ADecomposableMeasure
The proposed inequality measure, which is the only one to satisfy those properties, takes the general form
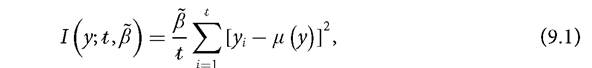
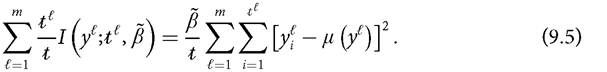
wherey = (y 1,...,yt) is a vector with t elements. Relevant applications using our familiar notation are provided in equations (9.6) and (9.7) below, but we first present the general form and notation. As we show below, in relevant applications an element yi, may be the deprivation score of a person ci or ci (k) or the average poverty level of a region. The size of the vector y for an entire population would be t = n and for the poor it would be t = q.'' The functional form in equation (9.1) is a positive multiple (β) of the variance. The measure reflects the average squared difference between person i’s deprivation score and the mean of the deprivation scores in y. The value of parameter β can be chosen in such a way that it normalizes the inequality measure to lie between 0 and 1.
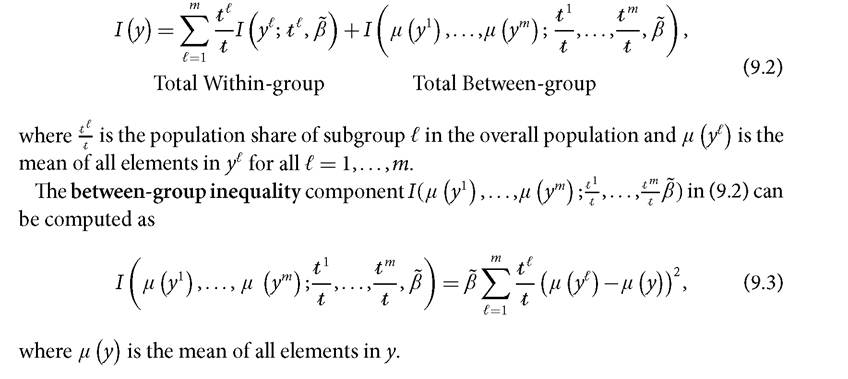
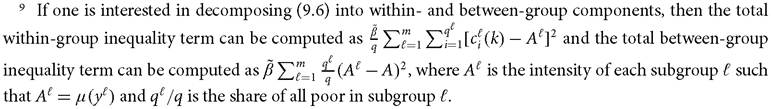
The overall inequality in y may be decomposed into two components: total within-group inequality and between-group inequality. Following the notation in Chapter 2, suppose there are m ≥ 2 population subgroups. The deprivation score vector of subgroup f is denoted by yc with te elements. The decomposition expression is given as follows:
8 There are many variations. For example, if data are relatively accurate one might consider inequality using the uncensored deprivation score vector c and alternatively if one only wishes to capture inequality within some subgroup Λ then y = C and t = nl.
The within-group inequality component of subgroup ˆ can be computed using
(9.1) as
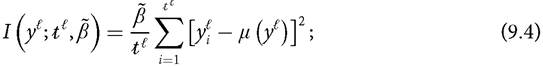
and thus the total within-group inequality component in (9.2) can be computed as
9.1.3.3 TwolmportantApplications
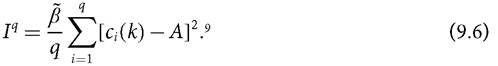
There are different relevant applications of this inequality framework to multidimensional poverty analyses based on M0. The first central case is to assess inequality among the poor. To do so we suppose that the deprivation scores are ordered in a descending 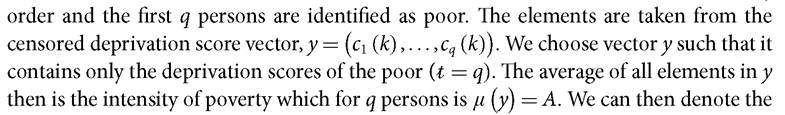 inequality measure that reflects inequality in multiple deprivations only among the poor by Iq, which can be expressed as
The Iq measure effectively summarizes the information underlying Figure 9.1. It goes well beyond that figure because each individual deprivation score is used, which effectively creates a much finer gradation of intensity than that figure portrays. Furthermore, it can be decomposed by subgroup to permit comparisons of within-subgroup inequalities among the poor. It can also be used over time to show how inequality among the poor changed.
Our second central case considers inequalities in poverty levels across population subgroups. It is motivated by studies of horizontal inequalities that find group-based inequalities to predict tension and in some cases conflict (Stewart 2010). Essentially, the measure reflects population-weighted disparities in poverty levels across population subgroups.
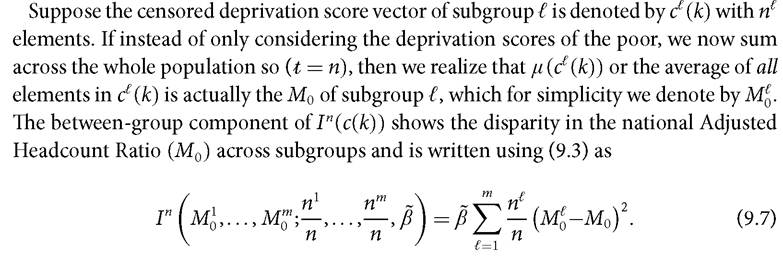
Thus, equation (9.7) captures the disparity in M0s across m population subgroups, which can be used to detect patterns in horizontal disparities over time. Naturally, the number and population share of the subgroups must be considered in such comparisons.
While studying disparity in MPIs across subnational regions, Alkire, Roche, and Seth (2011) found that the national MPIs masked a large amount of subnational disparity within countries, and Alkire and Seth (2013b, 2015) and Alkire, Roche, and Vaz (2014) found considerable disparity in poverty trends across subnational groups. In some countries, the overall situation of the poor improved, but not all subgroups shared the equal fruit of success in poverty reduction and indeed poverty levels may have stagnated or risen in some groups. Therefore, it is also important to look at inequality or disparity in poverty across population subgroups. This separate inequality measure, elaborated in Seth and Alkire (2014a), provides such framework.
9.1.3.4 AnIllustration
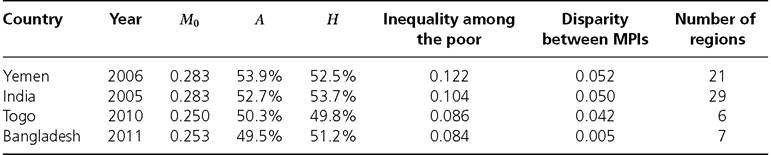
Table 9.1 presents two pairwise comparisons. For the inequality measure, we choose /3 = 4 because the deprivation scoresare bounded between 0 and 1; hence the maximum possible variance is 0.25. ensures that the inequality measure lies
between 0 and 1. The first pair of countries, India and Yemen, have exactly the same levels of MPI. The multidimensional headcount ratios and the intensities of poverty are also similar. However, the inequality among the poor—computed using equation (9.6)—is much higher in Yemen than in India. We also measure disparity across subnational regions. Yemen has twenty-one subnational regions, whereas India has twenty-nine subnational regions. We find that, like the national MPIs, the disparities across subnational MPIs—computed using equation (9.7)—are similar. This means that the inequality in Yemen is not primarily due to regional disparities in poverty levels, but may be affected by non-geographic divides such as cultural or rural-urban.
A contrasting finding for regional disparity is obtained across Togo and Bangladesh. As before, the MPIs, headcount ratios, and intensities are quite similar across the two countries—but with two differences. The inequality among the poor is very similar, but
Table 9.1 Countries with similar levels of MPI but different levels of inequality among the poor and different levels of disparity across regional MPIs
Source: Seth and Alkire (2014a)
the regional disparities are stark. Even though both countries have a similar number of subnational regions, the level of subnational disparity is much higher in Togo than that in Bangladesh.
9.2
More on the topic Inequality among the Poor:
- BETWEEN- AND WiTHiN-COUNTRY INEQUALITY
- WHY STUDY THE GLOBAL DISTRIBUTION OF INCOME?
- INTRODUCTION
- THE FIRST POVERTY ENLIGHTENMENT
- Cross-Country Income Differences
- Cross-Country Income Differences
- POVERTY: LEVELS
- INEQUALITY: TRENDS
- DIFFERENT FACETS OF INEQUALITY
- CHOOSING A YARDSTICK AND ITS COMPONENTS