POVERTY: TRENDS
In the last decades the developing world has made undeniable progress toward the goal of ending absolute poverty. The evidence suggests that the first goal of the Millennium Development Goals—to halve extreme poverty from 1990 to 2015—was already met in 2010 for the aggregate of developing countries.
However, the strong decline in global absolute poverty hides substantial heterogeneities across economies and over time. In this section we document and characterize trends in income poverty in the countries of the developing world since the early 1980s to 2010 and trace those changes to economic growth and distributive changes.[547] [548]The literature on international poverty trends can be divided into two main strands. The first one makes comparisons based exclusively on household survey microdata. This ambitious road that requires access to surveys for many countries over time has been taken by several initiatives at the regional level and by the World Bank at a global scale, mainly through the work of Martin Ravallion and Shaohua Chen. The second strand combines estimates of the national income distributions with GDP or aggregate consumption data drawn from National Accounts to anchor the mean. Bourguignon and Morrison (2002), Bhalla (2002), Karshenas (2003), and Sala-i-Martin (2006) are examples of this literature. In this section we mainly document the results of the first approach.
9.6.1 Trends in Income Poverty
Data from PovcalNet reveal a widespread fall in absolute income poverty in the developing countries over the last three decades (Figure 9.20). Only for a few nations poverty in 2010 was not lower than in 1981; that set includes some economies in Eastern Europe,
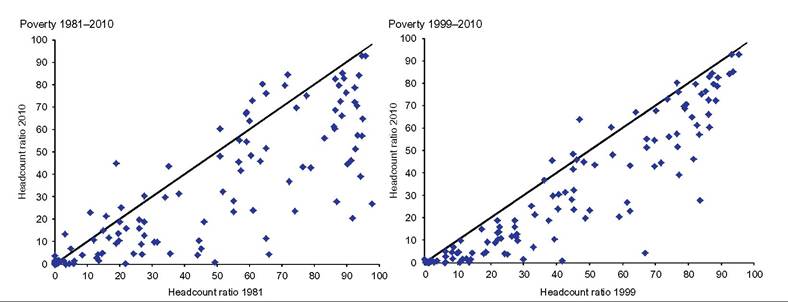
Figure 9.20 Poverty headcount ratio.
Developing countries. Note: Poverty computed over the distribution of consumption/income per capita with the PPP-adjusted $2-a-day line. Source: Own calculations based on PovcalNet (2013).Central Asia, and sub-Saharan Africa and only a few in Latin America and the Caribbean. The poverty decline in the 2000s was even more generalized: in only 8 out of 121 countries did poverty increase between 1999 and 2010 (5 in sub-Saharan Africa).
The proportion of the population in the developing world living with less than $1.25 per day decreased from 52% in 1981 to 20.8% in 2010, which implies a trend decline of around one point per year (Figure 9.21).[549] This is a remarkable achievement that should not be overlooked. It would be hard to find other episodes in history where the extent of extreme poverty was reduced so massively in such a short period of time.
However, this extraordinary result should be put in perspective. First, even after this global social improvement one of every five persons in the developing world still lives in extremely deprived conditions (less than $1.25 a day), whereas four out of 10 people have household per capita consumption levels lower than a frugal $2 per day.
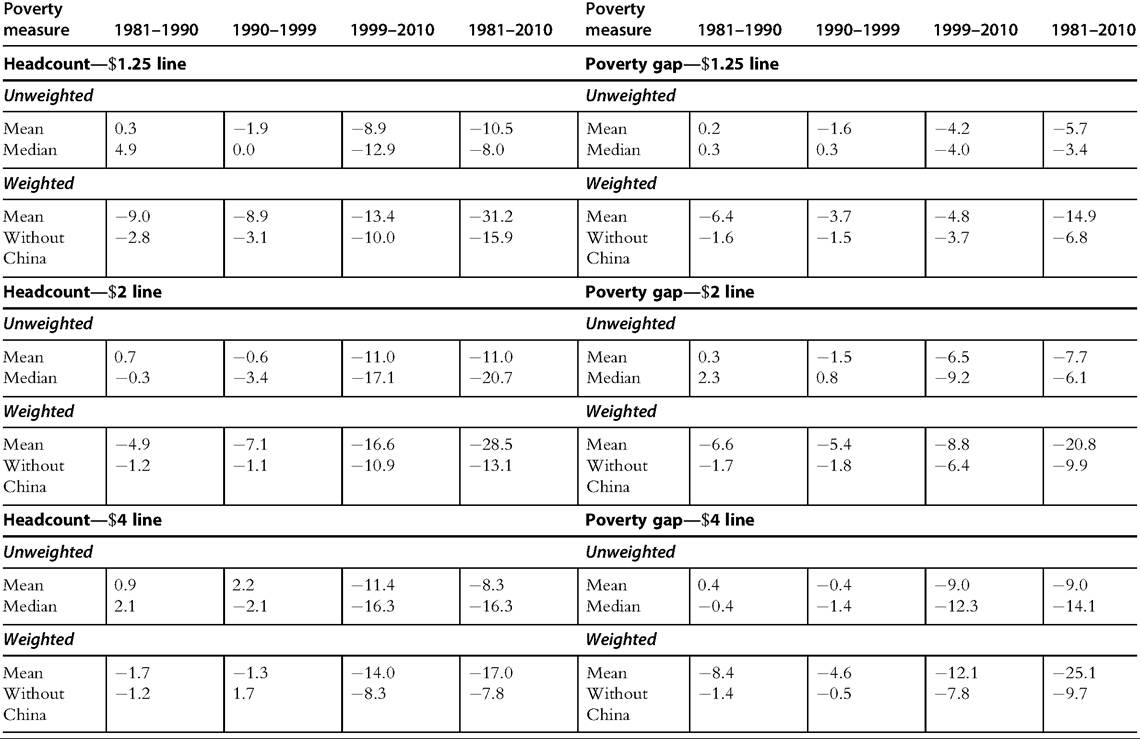
Second, the positive performance of China is key for the global result. Ignoring China, the poverty decline is less impressive: the headcount ratio fell 16 instead of 31 points in three decades (Table 9.14).[550] In fact, when ignoring China, it is not clear that the developing world could meet the MDG for poverty reduction in 2015. Although the population-weighted mean of the poverty rate dropped 31 points between
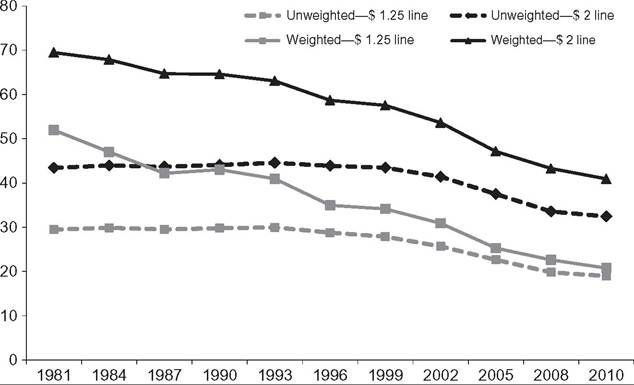
Figure 9.21 Poverty headcount ratio. Weighted and unweighted means, developing countries, 1981-2010. Note: Poverty computed over the distribution of consumption/income per capita. Source: Own calculations based on PovcalNet (2013).
1981 and 2010, the unweighted mean declined about 10 points, and the median went down just 8 points.
The extreme poverty rate ($1.25) of a typical developing country was reduced from 29.5% in 1981 to 19% in 2010, which represents a fall of around a third of a point per year, a figure less impressive than the corresponding one for the global poverty rate (one point a year). In fact, this decline took place only since the late- 1990s. A typical developing country did not experience any improvement for almost two decades: the unweighted poverty rate for the developing world was 29.5% in 1981, 29.8% in 1990, and 28.8% in 1996. From then on poverty declined more consistently, especially between 2002 and 2008, when for a typical developing economy the rate of poverty reduction was almost one point a year.The fall in poverty appears less startling when using higher poverty lines. Whereas the headcount ratio with the $1.25 line fell 60% from 1981 to 2010, it declined 41% when measured with the $2 line and 20% with the $4 line. In fact, although the MDG goal of halving $1.25-a-day poverty from the value in 1990 was already met in 2010, the assessment is different when using the $2 line: the headcount ratio in 2010 was about two- thirds of the value in 1990.
The performance of the developing world in terms of poverty reduction also looks much less spectacular when considering poverty counts, instead of the typical measures that are invariant to the size of the population. In fact, for the majority of the developing countries (63%) the number ofpoor people was higher in 2010 than in 1981. Even during the booming 2000s the poverty count increased in 30% of the nations. The number
Note: Poverty computed over the distribution of consumption/income per capita. Source: Own calculations based on PovcalNet (2013).
of poor people was in the late 2000s only slightly lower than in the early 1980s (2585 million in 1981 and 2394 million in 2010 with the $2 line); ignoring China, the poverty count actually increased in 422 million (from 1613 to 2035).
Some authors have suggested that the difference in the assessment of world poverty when alternatively using the headcount ratio or the number of poor people may be behind some of the controversies in the public debate about globalization and the social performance of the world in the last decades.[551]Because the calculation of global poverty with microdata is very cumbersome and requires having a large number of comparable household surveys, some authors estimate the changes in poverty with National Accounts data, anchoring the mean of the income distribution to output or domestic consumption taken from National Accounts, using secondary distributive data and making assumptions about the functional form of the income distribution, typically the lognormal parameterization (Ahluwalia et al., 1979; Bhalla, 2002; Chotikapanich et al., 1997; Pinkovskiy and Sala-i-Martin, 2009; Sala-i-Martin, 2006).[552] This methodology allows ambitious calculations in terms ofcoverage, but it faces some obvious caveats as changes in National Accounts aggregates may be misleading proxies for changes in household per capita income, and the secondary distributive data in which the estimates are usually based are mined with several comparability problems.[553]
According to the estimates by Pinkovskiy and Sala-i-Martin (2009) (PSM) using a sample of 191 countries, and distributive data from the WIID, world poverty rates ($2 line) went down from 45.2% in 1970 to 37.8% in 1981, 24.9% in 1990, 16.8% in 1999, and 13% in 2006. That pattern implies a fall substantially faster than what is estimated with household surveys data alone in the 1980s and 1990s, but slower in the 2000s.[554] For instance, although for 2008 the magnitude of the poverty rates in PSM for the $3 line is similar than in PovcalNet with the $1.25 line, the declines have been different. In PSM the headcount ratio fell at annual 2.6% and 3.5% in the 1980s and 1990s, respectively, whereas the rates were 2.1% and 2.5% with PovcalNet data.
Instead, in the 2000s poverty fell at annual 3.1% in PSM and at annual 4.4% in PovcalNet.9.6.2 Decomposing Poverty Changes
Researchers frequently use decompositions of changes in poverty into growth and redistribution effects to characterize poverty trends.[555] The growth effect refers to the poverty change between two years that would have occurred if the mean income had changed as it did, but the shape of the distribution had stayed fixed. On the other hand, the redistribution effect records the poverty change between two years that would have occurred if the shape of the distribution had changed in the way it did, but the mean had remained fixed. Of course, this is just a mechanical exercise, as indicators of economic growth and changes in inequality and poverty are just three different ways of aggregate information on income dynamics, and therefore they are all jointly determined by the general equilibrium of the economy. In that sense the decompositions are helpful to illustrate the way incomes have changed and affected poverty, but they are silent on the fundamental factors underlying poverty changes and on the policies recommended to reduce deprivations more effectively.
The change in the growth-inequality-poverty triangle was very different in the 2000s compared to the previous decade. Table 9.15 illustrates this difference showing the unweighted mean of the growth and redistribution effects of changes in poverty for a sample of 76 developing countries with information on deciles shares in PovcalNet.[556] The mild fall in the poverty headcount ratio ($2 line) in the 1990s can be decomposed into a poverty-decreasing growth effect that outweighed a poverty-increasing redistribution effect. On average (unweighted) mean consumption grew at an annual 0.2%, and the Gini increased about 0.3 points per year, implying a very modest decline in poverty. In contrast, in the 2000s both effects contributed to a falling poverty.
A robust increase of mean consumption (more than 3% a year) and a slow fall in inequality (around 0.1 GiniTable 9.15 Decomposition of poverty changes
Developing countries, 1990-2010
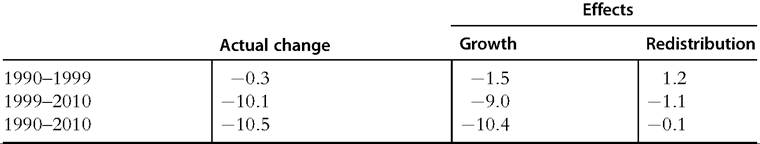
Note: The columns show unweightedmeans across a sample of76 developing countries ofthe change inpoverty headcount ratio ($2 line), and the growth and redistribution effects from the poverty change decomposition.
Source: Own calculations based on data from PovcalNet.
points a year) combined to yield a substantial reduction in indicators of material deprivation. The growth effect was particularly large, accounting for 90% of the fall in the headcount ratio ($2 line). This result does not mean that distributive changes are not important, but instead that they have not been the main drivers of poverty reduction in the past.
9.6.2 The Cost of Closing the Poverty gap
Although still a challenging problem, eliminating absolute extreme income poverty is an increasingly affordable target. Based on PovcalNet data, we computed the population- weighted poverty gap index in the developing world as a share of global GDP. This fraction, which indicates the fiscal effort required to end poverty in a scenario of perfect targeting, absent behavioral responses, has been substantially falling over time as poverty decreased and global GDP went up. The resources needed to close the poverty gap with the $1.25 line as a share of global GDP declined from 1.3% in 1981 to 0.2% in 2010 (the corresponding values for the $2 line are 3.6% and 1%).[557] As a share of the GDP in the developing world the cost of closing the poverty gap fell from 1.9% in 1981 to 0.4% in 2010 (5.4% and 1.8% for the $2 line).
Kanbur and Sumner (2011) highlight the fact that although in 1990 over 90% of the world’s extremely poor people ($1.25) lived in countries classified as low-income countries (LICs), by the late 2000s this share dropped to less than 30%. From the fact that most of the world’s poor live in middle-income countries with the domestic financial capacity to end at least extreme poverty, Sumner (2012) concludes that poverty reduction is increasingly becoming a domestic issue of national distribution and domestic political economy, rather than primarily an aid and international issue. Table 9.16 suggests than on average (unweighted) across developing countries the redistributive national effort to end extreme poverty under perfect targeting fell from 8.2% of GDP in 1981 to 4% in 2010. The median value is much lower and has fallen from 1.9% in 1981 to 0.5% in 2010. The third column shows the share of countries where the cost of eliminating extreme income poverty is less than 1 GDP point. That share substantially increased in the 2000s, from 41.3% in 1999 to 55.4% in 2010. Similarly, the share of countries for which closing the poverty gap is fiscally very burdensome (in the table more than three GDP points) fell from more than 50% in 1990 to about 30% in 2010. Sumner (2012) reports similar trends, although a lower proportion of countries with poverty gap/GDP less than 1%. Ravallion (2010) also notes that most middle-income countries would require very small additional taxation to end poverty.
110
Table 9.16 Poverty gap as share of GDP
Mean, median, share of countries with gap/GDP less than 1% and greater than 3% Developing countries, 1981-2010
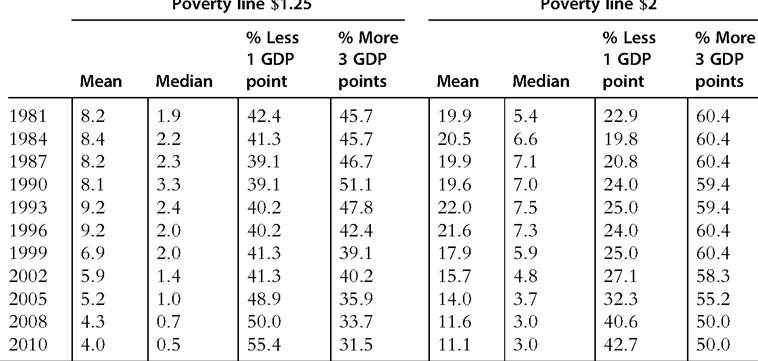
Note: Poverty computed over the distribution of consumption/income per capita. Unweighted statistics. Source: Own calculations based on PovcalNet (2013).
9.6.4 Regional Trends
The patterns in income poverty over time have been heterogeneous across the geographic regions of the developing world (Table 9.17). At least three facts are worth stressing: (i) the remarkable decline in poverty in Asia over the last three decades, (ii) the lack of significant progress in the rest of the regions in the 1980s and 1990s, and (iii) the generalized fall in poverty in the 2000s.
Arguably, the main fact about poverty dynamics in the last three decades has been the noteworthy decline in Asia. The share of people living with less than $2 a day went down from 92.4% to 29.7% between 1981 and 2010 in EastAsia and Pacific, and from 87.2% to 66.7% in South Asia. The performance ofEAP is enhanced by the presence of China, but also the unweighted mean dramatically fell in this region (from 70.4% in 1981 to 38.4% in 2010). The fall in the unweighted mean was similar in South Asia (from 80.3% to 43.5%). Almost all countries in Asia experienced drops in income poverty over the period 1981—2010. The reductions were on average larger in the 2000s than in the previous decades. For instance, in South Asia the unweighted mean fell 5.6 points in the 1980s, 10.9 in the 1990s, and 20.4 in the 2000s.
In the rest of the developing world the performance was weak and even negative in the 1980s and 1990s. Income poverty rose in Latin America in the 1980s, in Eastern Europe and Central Asia in the 1990s, and in sub-Saharan Africa in both decades. In contrast, all regions experienced falling poverty in the 2000s. The reductions were large and in general outweighed the weak performance of the previous decades. For instance, on
Table 9.17 Poverty headcount ratio, developing world 1981-2010 Weighted and unweighted means
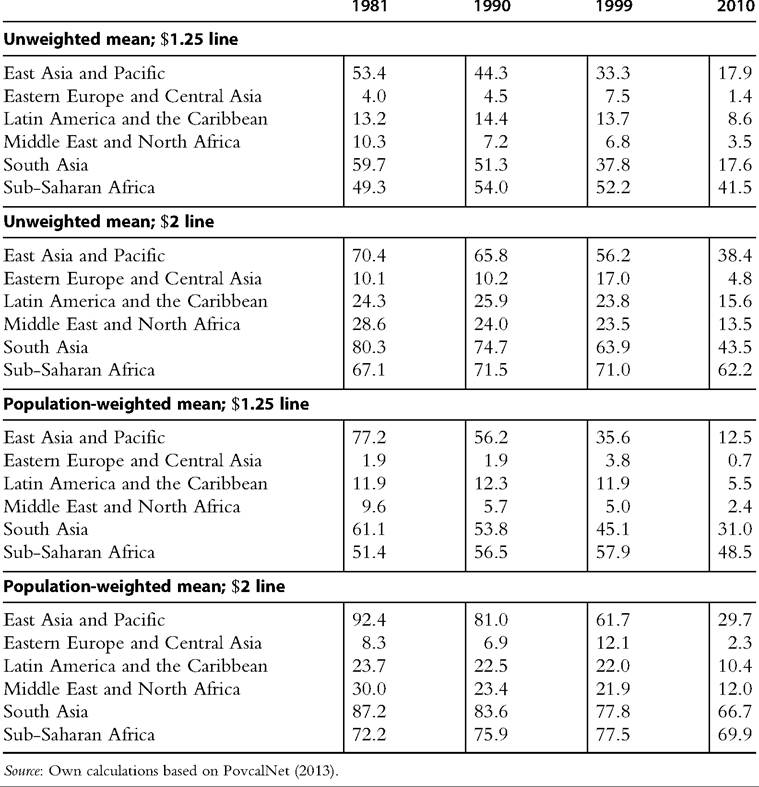
average (unweighted) income poverty ($2 line) went down 72% in ECA, 43% in MENA, 34% in LAC, and 12% in SSA. The proportion of countries where the headcount ratio fell more than 5% in the 2000s is above 90% in all these regions, with the exception of SSA, where the corresponding proportion is 66%.
The contrast between Asia and the rest of the developing world in terms of poverty reduction is even more dramatic when the calculations are carried out anchoring the mean of the income distribution to GDP from National Accounts. Figure 9.22 shows regional estimates taken from Pinkovskiy and Sala-i-Martin (2009), where the sharp
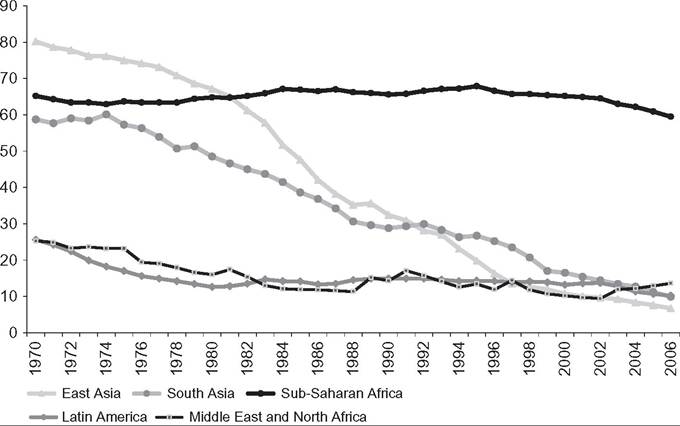
Figure 9.22 Poverty headcount ratio. Developing countries, 1970-2006. Note: Poverty line $2 a day. Source: Pinkovskiy and Sala-i-Martin (2009).
declines in poverty in East and South Asia stand out. According to these estimates there would be poverty convergence across the regions of the developing world, with the exception of sub-Saharan Africa.
Regions have been different in terms of the growth-inequality-poverty triangle (Table 9.18). The growth effect was strong in Asia dwarfing a much smaller (and sometimes poverty-increasing) redistribution effect. The increase in poverty in ECA in the 1990s is associated with both negative growth and inequality rise, whereas the fall in poverty in the following decade is mostly accounted for by neutral positive growth. In Latin America growth contributed in both decades, but only in the 2000s did the redistribution effect become poverty-reducing. Finally, in Africa (MENA and SSA) the growth effect in the 2000s was the major contributing factor to the fall in poverty.
In the rest of this section we take a closer look at the changes in poverty reported by the literature in each geographic region of the developing world.
9.6.4.1 East Asia and Pacific
As mentioned earlier, East Asia and Pacific has achieved an impressive record in terms of poverty reduction. The fall in the indicators of material deprivation has been strong, sustained over the two last decades and widespread across countries.[558] The poverty headcount ratio with the $2 line fell from 92.4% in 1981 to 81% in 1990, 61.7% in 1999, and 29.7% in 2010.
111
Table 9.18 Decomposition of poverty changes Developing countries
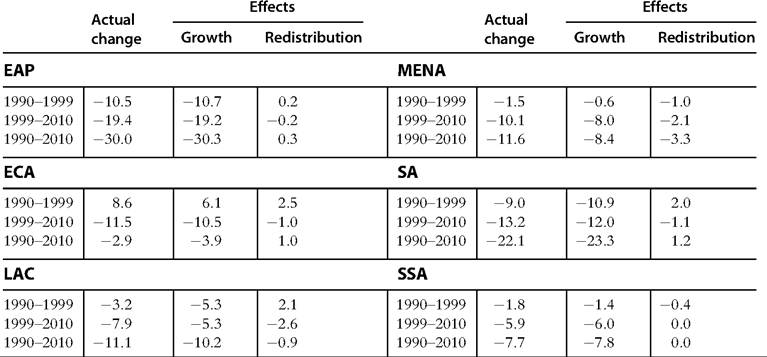
Note: The columns show the unweighted means of the change in the poverty headcount ratio and the growth and redistribution effects from the poverty change decomposition. They are based on a subsample of 76 countries in PovcalNet for which all data needed for the decomposition were available.
Source: Own calculations based on data from PovcalNet.
China’s progress against absolute poverty was a key factor behind this dynamic (Minoiu and Reddy, 2008; Ravallion and Chen, 2007; World Bank, 2009). Rural areas accounted for the bulk of the gains to the poor, although migration to urban areas helped; agriculture played a far more important role than the secondary or tertiary sources of GDP, mainly from the efficiency gains after the decollectivization process. Ravallion and Chen (2007) claim that “the halving of the national poverty rate in the first few years of the 1980s was largely attributable to picking these low-lying fruits of agrarian reform.” Provinces starting with relatively high inequality saw slower progress against poverty, due both to lower growth and a lower growth elasticity of poverty reduction. In 1990 the incidence of poverty in China was roughly 25 points higher than in the rest of the developing world, but by the end of the 2000s, it had fallen more than 10 points below the 112
average.
Between 1990 and 2010 the headcount ratio fell from 60% to 12% in China ($1.25 line), and from 54% to 18% in Indonesia, the two most populated countries in the region.
112 During the early and mid-1990s poverty declined substantially, but then in the late 1990s to the early 2000s the downward trend stalled. Li et al. (2013) argue that further reductions in poverty became more challenging due to several factors, for example, the fact that a high proportion of the remaining poverty was geographically dispersed and transient and also because poverty had become less responsive to macroeconomic growth (World Bank, 2009). Policies adopted after 2002, such as the minimum living guarantee program, the new rural cooperative medical system, and the new rural pension system, have addressed some of these factors.
The rest of the East Asian economies experienced similar patterns. The headcount ratio dropped from 58% to 15% in Cambodia, from 12% to 0.4% in Thailand, and from 73% to 14% in Vietnam. The reductions were less spectacular, but anyway significant in the Pacific countries (Micronesia, Philippines, Papua New Guinea, Timor-Leste). According to the Asian Development Bank (2012a, 2012b), and using the national lines, poverty declined in all EAP economies except Mongolia, Micronesia, Samoa, Timor-Leste, Tonga, and Tuvalu. With respect to the poverty reduction target of the Millennium Development Goals, ofthe 10 economies for which data are available, six have achieved the poverty target, and Cambodia is very close to reaching it by 2015. Lao PDR, Philippines, and Timor-Leste are progressing more slowly toward that goal.
9.6.4.2 Eastern Europe and Central Asia
The evidence clearly suggests that poverty in Eastern Europe and Central Asia increased during the 1990s and decreased during the 2000s. The collapse of output in many of these countries following the dismantling of the Soviet Union, along with hyperinflation that wiped out savings, resulted in a dramatic drop in living standards for the majority of people and the emergence of poverty as a major issue.[559] However, according to Simai (2006), poverty in the region was not a new phenomenon; most of the countries began their transformation with extensive hidden unemployment and at least one-tenth of its population below the subsistence level. The transition also involved setbacks in non-monetary dimensions of well-being. Past achievements in social welfare came under pressure, the most striking being the reduction in life expectancy: In 1995, life expectancy for males in the Russian Federation was just 58 years, 10 years less than that of men in China.
Table 9.17 reminds the reader that poverty rates in these countries have always been much lower than in the other developing regions, irrespective of the line considered and of the weighted or unweighted averages, and despite the fact that low-income CIS (Georgia, Uzbekistan, Moldova, Armenia, Kygryz Republic, Tajikistan) display figures well above the regional mean. When growth resumed after the Russian crisis in 1998, poverty started to fall.[560] It was not until 2004 that the region as a whole returned to the level of GDP recorded in 1990 (World Bank, 2005). Much of the poverty reduction initially occurred in the populous middle-income countries (Kazakhstan, Russian Federation, Ukraine), but eventually it spread almost everywhere. Scholars have identified four main (nonindependent) explanations for the poverty dynamics: (i) the positive growth in output and wages; (ii) the decline in inequality, with incomes of poorer households increasing faster than average in some countries (CIS) but not in others (Poland,
Romania); (iii) the increasing role of public transfers, with benefits improving in coverage and adequacy; and (iv) private remittances, which in many cases far exceeded public funding.
9.6.4.3 Latin America and the Caribbean
Poverty estimates in Latin America, available since the 1970s, were always mostly based on income, not consumption.[561] Despite the fact that statistics were initially weak, there is agreement among researchers that during the 1970s economic growth pushed poverty down in the region (Altimir, 1979, 1996). In contrast, the “lost decade” of the 1980s was characterized by recurrent crises and output stagnation, which brought about a weak social performance. Latin American economic growth resumed in the 1990s, but in the context of growing inequalities, a combination that resulted in a modest decline in poverty (Londofio and Szekely, 2000). The exceptional economic conditions in the 2000s and the consolidation of more ambitious social policies implied a sharp drop in poverty indicators in that decade. Gasparini et al. (2013) estimate that the income poverty headcount ratio ($2.5 line) fell from 36% in the early 1970s to 27.3% in 1980, slowly increased to reach 27.8% in 1992, mildly decreased to 24.9% in 2003, and was reduced dramatically to 16.3% by 2009. [562] The number ofpoor people in the region is estimated to have fallen from 119 million in 1992 to 89 million in 2009 (Gasparini et al., 2013). Other indicators of income poverty and of various types of material deprivation are consistent with these results. Data from SEDLAC confirms that the reduction in poverty continued in the period 2009—2013, despite a deceleration in the GDP growth rates. The improvements in social indicators in the 2000s have been linked to at least two factors: on the one hand, most of the region’s economies experienced robust growth together with upswings in employment and labor income; on the other, all countries boosted social spending and put ambitious social protection systems into place or expanded the scope of their existing systems (Cruces and Gasparini, 2012; Lopez Calva and Lustig, 2010).
The performance in terms of poverty reduction has been heterogeneous across the regions in Latin America. Although Central America experienced a slow decline in income deprivation over the last two decades, in the rest of the regions the rapid poverty fall of the 2000s contrasts with the sluggish or even negative performance of the 1990s.[563] More than half of the population in Latin America lives in Brazil or Mexico. After a decline in the early 1990s, income poverty in Brazil remained stable for about a decade; the poverty rate with the $2.5 line was 27.8% in 1995 and 27.1% in 2003. After that plateau, the country experienced a fast and sustained reduction in income poverty, reaching 13.9% in 2010. The Mexican economy was hit by a serious crisis in the mid-1990s (the so-called Tequila crisis) that raised income poverty from 17.8% in 1992 to 43.4% in 1995 (SEDLAC data, $2.5 line). From that peak, income poverty initiated a consistent decline to reach a value of 12% in 2006, with no gains in the second half of the 2000s.
9.6.4.4 Middle East and North Africa
As discussed in Section 9.4, it is useful to divide the last four decades in MENA into three periods. The first one, spanning until the mid-1980s, was characterized by strong economic growth: the average per capita income growth for the region between 1975 and 1984 was over 4.5%. Adams and Page (2003) argue that given MENA's relatively equal income distribution, this economic growth had a powerful impact on reducing poverty in the region. However, assessing that progress is difficult becaused pre-1985 household surveys are only available for Tunisia and Egypt. Iqbal (2006) reports that in Tunisia poverty fell from 51% in 1965 to 16% in 1985, while Egypt’s achievement was also impressive, with poverty declining from 82% to 53% between 1975 and 1985. Page (2007) estimates a fall in the incidence of poverty ($2 line) in the region from 57% in the late 1970s to 22% in the early 1990s.
The second period, covering the late 1980s and most of the 1990s, was characterized by a sluggish economic performance, in part due to low prices for hydrocarbons, declining remittances and aid flows, as well as a low payoff to the reforms that were implemented. On average for the developing MENA countries, real per capita incomes went up by less than 1.5% per year. The proportion of those living with less than $2 per day stayed roughly unchanged at around 22% for a decade (PovcalNet). Iqbal (2006) reports that “by 2001, approximately 52 million people were poor, an increase in absolute numbers of approximately 11.5 million people, compared with the situation in 1987.” The 1990s were a lost decade for economic growth and poverty reduction in the developing economies of the MENA region (Page, 2007).
The downward pattern in poverty appeared to have resumed in the 2000s. The incidence of poverty ($2 line) fell from 22% in 1999 to 12% in 2010. According to PovcalNet data the number of people living with less than $2 a day increased by 7 million in the 1990s and then was reduced by 20 million in the 2000s (from 60 to 40 million). In the 1990s poverty went down in a third of the MENA countries, but in the 2000s it went down in all economies, with the possible exception of Yemen.
9.6.4.5 South Asia
South Asia achieved impressive economic growth in the past 15 years. Since 1996 until the recent global crisis, GDP growth in the region exceeded 5% per year. As a consequence, poverty rates were considerably reduced. In Bangladesh, India, and Nepal, absolute poverty (headcount ratio, $1.25 line) fell by 18,15, and 43 points, respectively, between 1996 and 2010. In Pakistan, it fell by 22 points between 2002 and 2010. Devarajan and Nabi (2006) optimistically expect the region to have single-digit poverty rates in 2015 if growth rates accelerated to 10% per year. This has indeed happened already in Sri Lanka (where poverty dropped from 17 in 1996 to 4 in 2010) as well as in Maldives (where, according to the 2006 census, about 1 of the population was living on less than $1 a day).
Growth has been instrumental in reducing poverty rates, but as Ghani (2010) points out from a gloomier perspective, poverty rates were not falling fast enough to reduce the total number of poor people. Those living on less than $1.25 a day increased from 549 million in 1981 to 595 million in 2005. In India, where around three-quarters of these poor live, the number increased from 420 million in 1981 to 455 million in 2005 (Ravallion et al., 2009). The situation seems to have slightly improved according to the most recent observations.
9.6.4.6 Sub-Saharan Africa
The economic and social performance of sub-Saharan African countries has been frustrating. Five decades after most nations gained independence, poverty is still at very high levels in SSA, in fact the highest in the world. Fortunately, it seems that finally, after years of impoverished economic performance, the last decade shows some signs of improvement. Based on figures from PovcalNet, the incidence of poverty increased between 1981 and 1999 from 51% to 58% for the $1.25 per day line and from 72% to 77% for the $2 line (the unweighted statistics are not very different).[564] Because of the increase in population the number of people living with less than $1.25 a day almost doubled in sub-Saharan Africa during those years, from 205 million to 377 million. These results are even more disappointing when compared to the rest of the developing world. The share of the world’s poor living in sub-Saharan Africa rose from 11% in 1981 to 22% in 1999. Artadi and Sala-i-Martin (2003) find that the SSA poverty rate was stable in the 1970s, around a value of 49%, and soared in the 1980s and early 1990s, reaching 60% in 1995, following the deterioration of aggregate per capita income in the region. They report a nearly 50% reduction in the worldwide poverty rate between 1980 and 2000, which contrasts with a 27% increase in SSA.
Following the dismal performance of the 1980s and early 1990s, SSA witnessed some economic and social progress. Poverty declined considerably from their heights of the mid-1990s; in fact the reduction in extreme poverty from that date to the late 2000s was similar than in the rest of the developing world, excluding China. Chen and Ravallion (2012) stressed the fact that for the first time since 1981 the share of people in sub-Saharan Africa living below $1.25 a day was less than 50%. Changes in poverty have been closely linked to economic growth. According to Fosu (2010), poverty has declined in SSA by about 0.5 points per year since the mid-1990s, quite comparable with South Asia’s record. Sala-i-Martin and Pinkovskiy (2010) estimate that African poverty has been falling steadily since 1995. According to these authors the African poverty rate in 2006 was 31.8%, 30% lower than in 1995, and 28% lower than in 1990. The decline in poverty in the 2000s was quite extended: As reported earlier, two-thirds of the SSA countries in Pov- calNet experienced reductions larger than 5%. Sala-i-Martin and Pinkovskiy (2010) find that “poverty fell for both landlocked as well as coastal countries; for mineral-rich as well as mineral-poor countries; for countries with favorable or with unfavorable agriculture; for countries regardless of colonial origin; and for countries with below or above median slave exports per capita during the African slave trade. Hence, the substantial decline in poverty is not driven by any particular country or set of countries.” However, Fosu (2009) highlights the considerable heterogeneity across country experiences. For example, although high economic growth in Botswana has been transformed to only a minimal decline in poverty, Ghana has succeeded in translating its relatively modest growth to considerable poverty reduction. Fosu (2009) attributes this contrast to the difference in the levels of income inequality between the two countries.
Despite the encouraging signs of progress in the fight against poverty in sub-Saharan Africa, Chen and Ravallion (2012) alert that the lags in survey data availability and problems of comparability and coverage raise concerns about how robust this positive trend will prove to be.
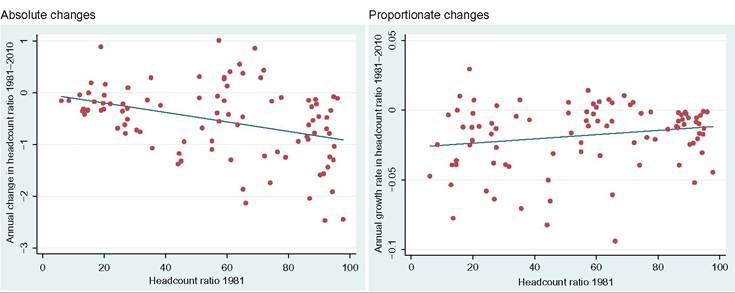
9.6.3 Poverty Convergence
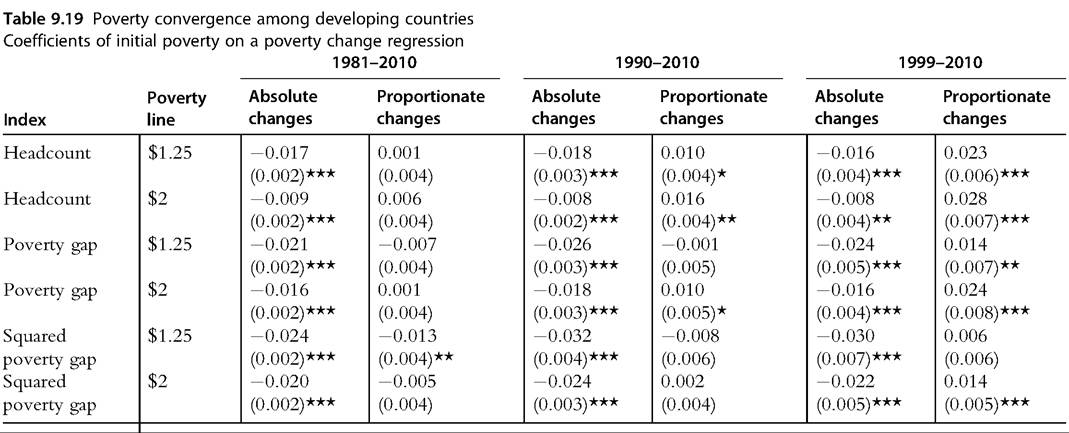
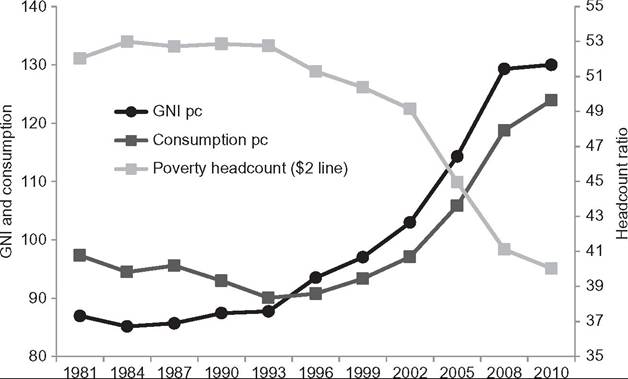
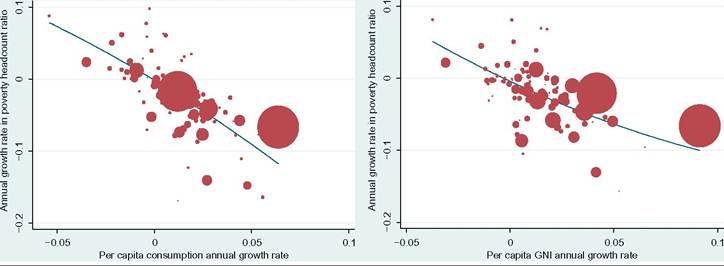
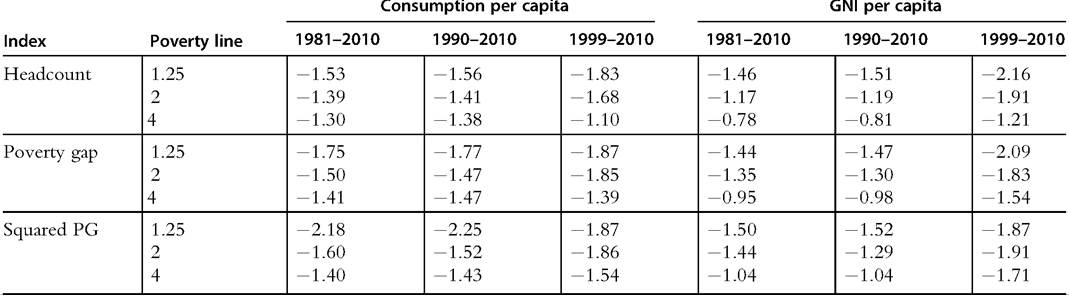
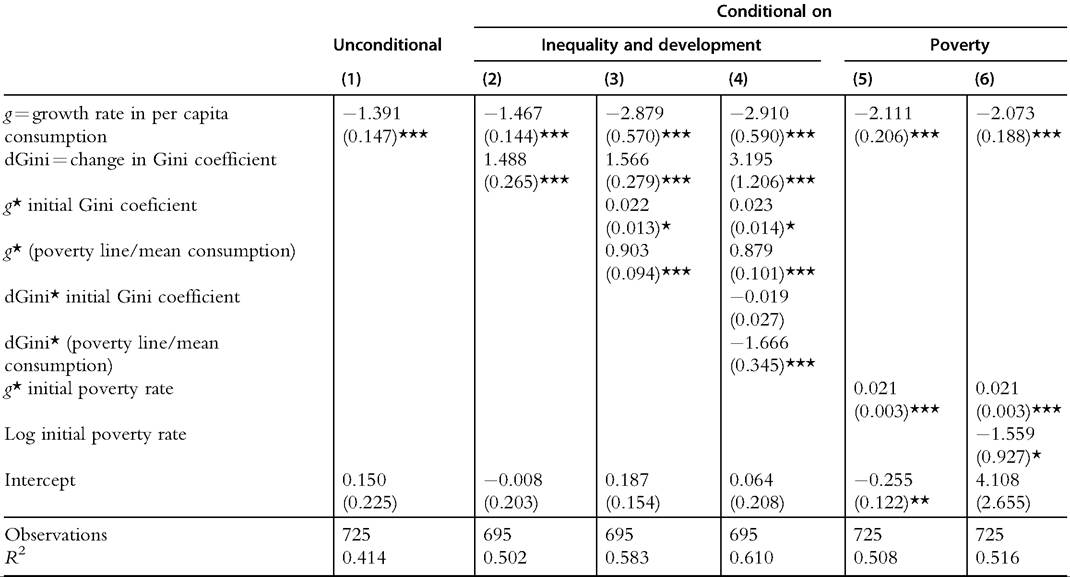
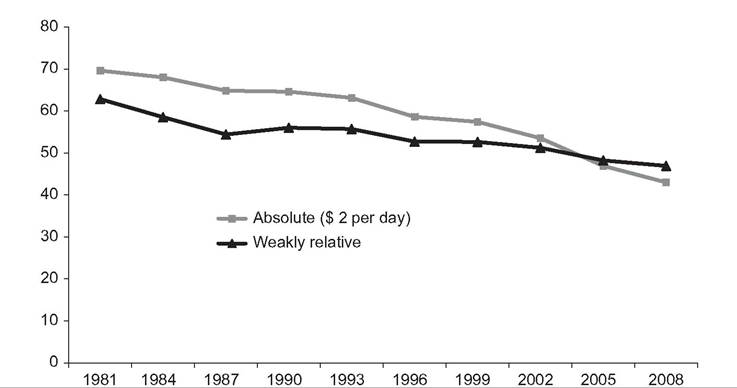
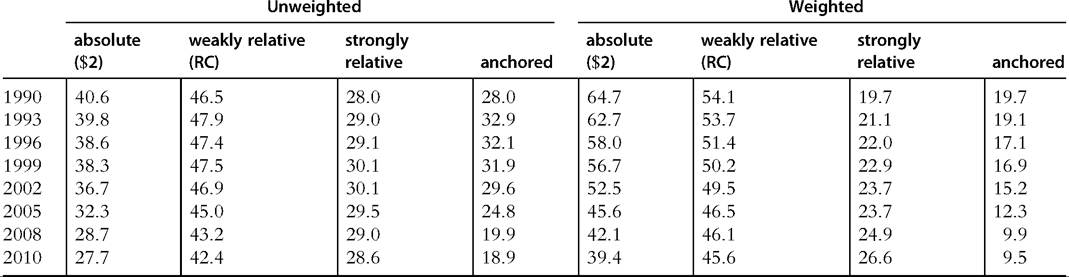
Given the heterogeneity among economies in terms of social improvement, a natural question is whether countries starting out with a high incidence of material deprivation tend to be the ones with higher rates of poverty reduction; i.e., whether there is poverty convergence (Ravallion, 2012).[565] [566] Figure 9.23 suggests some signs of poverty convergence in absolute terms but not in proportionate terms.1 0 The 1981 poverty level ($2 line) is negatively correlated with the annualized change over the period 1981-2010, but not with the proportionate change (annualized log difference). In the first panel the regression line has a slope of—0.009 with a t-ratio of—4.51, based on a robust (White) standard Figure 9.23 Poverty convergence among developing countries 1981-2010. Note: Poverty computed over the distribution of consumption/income per capita with the PPP-adjusted $2-a-day per person line. Source: Own calculations based on PovcalNet (2013). error. This result means that on average the absolute fall in poverty has been larger in countries with higher poverty incidence, but because the difference across countries is small, there is absence of poverty convergence in proportionate terms. The results for other poverty indices, lines, and time periods are similar (Table 9.19). The coefficients for the absolute change in poverty are negative but small, whereas the coefficients for the proportionate change are in general positive, although in most cases non-significant.[567] Ravallion (2012) argues that the lack of poverty convergence (in proportionate terms), despite evidence for mean convergence and for the poverty-reduction impact of growth, suggests that the dynamic processes for growth and poverty reduction depend directly on the initial level of poverty. He shows evidence on two adverse effects of being a country with high poverty levels: first, these countries tend to grow at a slower pace, controlling for the initial mean, and second, a high poverty rate implies lower “productivity” of economic growth in terms of poverty reduction (lower povertygrowth elasticity). 9.6.6 Poverty and Growth The dynamics of poverty are closely related to income growth. The economic literature has gathered abundant evidence supporting the fact that absolute poverty tends to fall Note: Standard errors in parenthesis. ★Significant at 10%, **significant at 5%, ***significant at 1% Source: Own calculations based on PovcalNet (2013). Figure 9.24 Per capita GNI, per capita consumption, and poverty headcount ratio. Unweighted mean, developing countries, 1981 -2010. Note: Per capita gross national income in constant 2005 PPP dollars, per capita consumption from household surveys in constant 2005 dollars. Unweighted averages across developing countries, series displayed with mean ¼ 100. Headcount poverty ratio $2-a-day line, unweighted averages across developing countries. Source: Own calculations based on PovcalNet (2013). with economic growth.[568] Moreover, the longer the growth spells under consideration, the larger the share of the variance in poverty that is accounted for by the growth component (Ferreira, 2010). Figure 9.24 illustrates this relationship by showing poverty along with two alternatives measures of mean income: per capita gross national income (GNI) constructed from National Accounts, and per capita consumption obtained from household surveys. The figure shows the unweighted mean of these variables among developing countries in the period 1981—2010. On average, the economic performance of the developing countries was weak in the 1980s and early 1990s, hindering the perspectives of poverty reduction. Since the mid-1990s economic growth resumed in most countries in the developing world, a process that accelerated in the 2000s, leading to a sustained decrease in all measures of income poverty. At the end of the decade that pattern was slowed down, but not halted, by the poor economic performance of several developing countries associated to the international crisis. 1. Poverty reduction and growth in per capita consumption 2. Poverty reduction and growth in per capita GNI Figure 9.25 Growth and poverty reduction in the developing countries, 1981-2010. Note: The horizontal axis shows the annual growth rate between 1981 and 2010 in per capita consumption from household surveys in constant 2005 dollars (panel 1) and in per capita gross national income in constant 2005 PPP dollars (panel 2); the vertical axis shows the annual growth change in the poverty headcount ratio ($1.25 line) in the same period. The size of each circle is proportional to the country population in 2010. Source: Own calculations based on PovcalNet (2013). Figure 9.25 is another illustration of the relationship between poverty reduction and economic growth. The figure shows that the change in poverty is closely negatively related to economic growth, either in per capita consumption expenditures drawn from household surveys or in GNI from NAS. Notice that in both panels the fitted line approximately crosses the (0,0) point. Because the positive correlation between poverty reduction and growth is a well- established result, research in this area is mainly focused on estimating the magnitude of the corresponding elasticity, an issue that may have relevant policy implications. “If (the elasticity) is reasonably high, then poverty reduction strategies almost exclusively relying on economic growth are probably justified. Ifit is low, however, ambitious poverty reduction strategies might have to combine both economic growth and some redistribution” (Bourguignon, 2003). The growth elasticity of poverty reduction is typically estimated by regressing the annualized proportional change in a poverty indicator against the annualized growth rate of mean income (per capita income or consumption from surveys, or per capita GDP, GNI, or aggregate private consumption from NAS) in a sample of growth spells. In a regression without controls the resulting coefficient is the total elasticity, as opposed to a partial elasticity that can be obtained by holding inequality and other factors constant. Based on a data set for 67 countries over the period from 1981 to 1994, and using the $1 line, Ravallion and Chen (1997) find a central estimate for the poverty-growth elasticity of —3.1. Values estimated by other authors are somewhat lower (in absolute terms): around —2 in WorldBank (2000), —1.6 in Bourguignon (2003), —2.6 in Adams (2004), and —1.8 in Ferreira and Ravallion (2009). More recently, Ravallion (2012) reports an elasticity of —1.4 for the $ 1.25 line. The elasticity is lower when using the growth rate of consumption per capita from NAS (—0.8), and also lower when using a higher poverty line. The confidence intervals around the regression coefficient are typically wide. Ravallion (2007) reports that the 95% confidence interval implies that for a poverty level of 40%, an annual growth rate of 2% is consistent with poverty reductions ranging from 1% to 7%. Estimates of the total growth elasticity of poverty reduction over the period 1981—2010 obtained with the latest version of PovcalNet data are shown in Table 9.20.[569] All the elasticities are negative and significant at 1%. The growth elasticity of poverty reduction, as measured by the proportion of individuals below $1.25 a day, is around —1.5. The results in Table 9.20 confirm that elasticities are lower in absolute value when considering a higher poverty line. The result of lower elasticities using GNI from National Accounts holds but only until the 2000s, suggesting a change in the relative trends between consumption reported in household surveys and output estimated in NAS. In general, the absolute value of the elasticities estimated with both sources have increased in the 2000s compared to previous decades, suggesting that growth was better translated to the poor in that period of falling inequality. For instance, although the elasticity using the $1.25 line and consumption per capita was —1.53 for the period 1981-2010, it amounted to —1.83 when restricting the analysis to the 2000s. So far, we have reported total elasticities, which can be seen as summary measures of the comovements of poverty and growth. The literature has tried to improve this characterization by adding other variables into the analysis, typically measures of inequality and development. The empirical evidence supports the intuition that higher inequality tends to reduce the absolute value of the elasticity, by shifting the gains from growth away from the poor (Kraay, 2006; Ravallion, 1997, 2001).[570] For example, based on a sample of 65 countries during 1981-2005, and using the $1 poverty line, World Bank (2005) reported that the poverty-growth elasticity is highest among low-inequality countries (with a value of approximately —4.0 for countries with Ginis in the mid-20s) and lowest among high-inequality countries (close to —1.0 for countries with a Gini coefficient around 60). The change in inequality is also found as a significant direct determinant of the elasticity. For instance, Ravallion (2001) finds that the median rate of reduction in the poverty headcount ratio ($ 1 line) among growing economies was 10% per year among countries with falling inequality, and 1% per year for those countries with rising inequality. Table 9.20 Total poverty—growth elasticities Developing countries Note: All elasticities are significant at 1% level. Source: Own calculations based on PovcalNet (2013). Using a sample of 114 growth spells from the mid-1980s to the mid-1990s in 26 developing countries Bourguignon (2003) finds an elasticity of —1.6 in the model without controls and —2 when controlling for the change in the Gini. The latter specification increases the R2 from 0.266 to 0.419, suggesting that the heterogeneity in distributive changes is as much responsible for the variation in poverty changes across growth spells as the heterogeneity in the speed of growth. Bourguignon (2003) also finds positive and significant coefficients for the interaction terms between the growth rate and both (i) the initial level of inequality, and (ii) the level of development (proxied by the poverty line over mean income). He also reported negative coefficients for the interaction terms between the change in the Gini and those two variables. The first four columns in Table 9.21 in general confirm the results in Bourguignon (2003), using a larger data set spanning three decades.[571] The results suggest the possibility of a double dividend from reducing inequality: first, given a growth rate, lower inequality is associated directly with less poverty, and second, less inequality means more poverty reaction to a given growth rate, that is an acceleration of poverty reduction for a given rate of economic growth. Ravallion (2007) illustrated the relevance of lower inequality for the perspectives of poverty reduction assuming a country with a poverty incidence rate of 40% and a growth rate of 2% per year: with an initial Gini coefficient of 30 it would take 11 years to reduce poverty by half, whereas with a Gini of 60 it would take 35 years. A more recent study Ravallion (2012) finds that the (absolute) growth elasticity of poverty reduction tends to be lower in countries with a higher initial poverty rate (see also the two last columns in Table 9.21). Ravallion (2012) finds a large attenuating effect of a higher initial poverty rate on the elasticity: at an initial poverty rate of 10% the elasticity is —2.2, while it falls to —0.5 at a poverty rate of 80%. The results are robust to the inclusion of additional interaction effects with the initial Gini coefficient, the partial elasticity of poverty reduction holding the Lorenz curve constant, the primary school enrollment rate, life expectancy, the price of investment goods, and regional dummies. Unfortunately, although the characterization of the growth elasticity of poverty reduction discussed in this section is useful, the literature is still far from being able to clearly identify the structural factors that are behind the differences in the elasticities, and therefore it is relatively silent about the specific policies that could foster a larger impact of economic growth on poverty. Table 9.21 Regressions for annualized proportional change in the poverty headcount ratio Developing countries, 1981—2010 Note: Sample of 76 countries with information for the period 1981—2010. Poverty indicator = headcount ratio, $2-a-day line. Growth rates computed from per capita consumption in household surveys. ★significant at 10%, **significant at 5%, ***significant at 1%. Source: Own calculations based on PovcalNet (2013). 9.6.7 Relative Poverty So far we have presented evidence on absolute poverty, an option that requires keeping the real value of the poverty line fixed over time. The alternative is relative poverty, where the line is adjusted to reflect changes in a general measure of economic well-being. Although the measurement of relative poverty has not been common in the developing world, sustained economic growth has triggered the update of absolute poverty lines in some countries (e.g., China and India) and foster discussions on relative poverty. The measurement of relative, instead of absolute, poverty can be justified on two grounds (Chen and Ravallion, 2008; Sen, 1983). First, the very concept of poverty may depend on social norms that are likely different across countries and over the development process. Second, even for a fixed norm, an absolute line in the space of welfare may require a relative line in the space of consumption if individual welfare also depends on relative consumption with respect to the rest of the society where the person lives. The typical relative poverty line is set as a constant proportion of the mean of the distribution, implying that poverty does not fall when all incomes grow at the same rate. This result is considered problematic by many authors who prefer weak versions in which the cost of inclusion is not a constant proportion of mean income. For instance, following Atkinson and Bourguignon (2001), Ravallion and Chen (2011) propose a poverty line that is fixed up to a critical value of the mean, where it rises with elasticity less than one. In particular, Ravallion and Chen (2011) set the line for country i at time t as zit = max [$1.25, ($1.25 + Mi∙t)Z2], where Mit is the country and date specific mean. Figure 9.26 reveals an overall trend decline in the incidence of weakly relative poverty in the developing world. The fall has been relatively meager, so that the number of poor by this Figure 9.26 Poverty headcount ratio with absolute and weakly relative poverty lines. Developing countries, 1981-2008. Source: Ravallion and Chen (2011). Table 9.22 Absolute and relative poverty Developing countries, 1990-2010 Note: Weakly relative poverty computed according to Ravallion and Chen (2011). Strongly relative lines set at 50% of mean income. Anchored poverty computed by “anchoring” the relative lines (50% of mean income) to the values in 1990 and updating them only by domestic price changes. Source: Own calculations based on data from PovcalNet (sample of 76 countries). measure actually increased from 2.3 billion in 1981 to 2.7 billion in 2008. Although the coefficient in an OLS regression between the proportionate rate of poverty reduction (annualized differences in the logs) and the rate of growth in the mean is —1.89 (standard error = 0.23) for the absolute measure of poverty, it becomes —0.38 (standard error = 0.08) for the relative measure. Only East Asia has experienced a marked reduction in the incidence of relative poverty: from 81% in 1981 to 42% in 2008. In fact it is the only region in which the poverty count was reduced according to this measure. Weakly relative poverty measures rose or stayed unchanged in most regions in the 1990s and slowly went down in the 2000s. In Table 9.22 we extend the estimates of Ravallion and Chen (2011) to 2010 and add estimates of strongly relative poverty (50% of mean income) and anchored poverty, computed by “anchoring” the relative lines (50% of mean income) to the values in 1990, updating them only by domestic price changes (see Chapter 8 in this volume). Our view of poverty trends widely varies across methodologies: Although the unweighted anchored poverty rate fell 32% between 1990 and 2010, the strongly relative poverty rate went up 2%. The differences are even larger when considering the population-weighted statistics. 9.7.
More on the topic POVERTY: TRENDS:
- LIMITS TO GROWTH
- Evidence of climate change is substantial
- CONCLUSIONS: MAJOR FINDINGS FROM THE LITERATURE SURVEY AND IMPLICATIONS FOR FURTHER RESEARCH
- African-American Churches
- (Re)Births of Peace: Renaissance Revivals of and Departures from Traditions
- Chapter 33 Agricultural Investment Risk Relationship to National Domestic Production
- The Rise of the Individual and Tensions with Institutional Structures
- Changing the Land: Sectarians and Foreign Colonists
- Saying Sorry - States' (Non)Recognition of Violence
- The Troubled Countryside