WEALTH AND GENDER
Wealth inequality is an important dimension of economic inequality and an increasingly important driver of inequality (Piketty, 2013). Yet economic research has seldom considered wealth inequality between men and women, at least until recently[829]—so seldom that, in their review of empirical work on the distribution of wealth up to the late 1990s, Davies and Shorrocks (2000) cited only one study mentioning a gender differential (an analysis of the composition of wealth portfolios by Shorrocks, 1982).
This reflects that research on wealth inequality considers essentially household wealth and hardly ever ownership within households. But does ownership matter within a household? Some assets such as a home or a car are a direct source of utility, whereas others, such as savings invested in interest-bearing assets, are a source of income; all are also a security—selling or drawing on one’s savings helps to cope with variations in income. Then, one might answer that who owns what does not matter much because any member of the household can benefit from the assets held by the others—at least insofar as the household stays together—and the issue of ownership matters less than that of income sharing. But the distribution of assets between spouses may affect their relative power in decision making and the intrahousehold distribution of income, and household disruptions can make who owns what matter a great deal.139
What can be expected about a gender gap in wealth? In the perspective of wealth accumulation,1 0 inequalities can result from inheritance and persistent differences in the levels and combined effects of incomes (which determine the capacity to save), preferences (which affect the savings rate), and investment choices (which determine the returns to savings). Considering the gender gap in earnings, the unequal labor market attachment of men and women, and a possible difference in investment behavior leading women to make less risky investments than men, resulting in lower returns to their financial savings, it is reasonable to expect a gender wealth gap in favor of men on average.
However, because large proportions of men and women live in couples, there is also a “marital” dimension in the process of accumulation that somewhat complicates both the prediction and the assessment of the gender gap in wealth. As for transfers received, while inherited wealth is an important factor of wealth inequality in general, there is nothing in the empirical results examined to suggest a gender differential in the effect of inheritance (including expected inheritance).[830] [831] But this is not the case for other types of transfers related to family disruptions such as divorce and widowhood, the latter “favoring” married women because they tend to outlive their husbands. This illustrates some of the complicated marital dimension of wealth accumulation and gender.[832]This last section examines the main results from empirical work on gender inequality in wealth. Most of this empirical work is hampered by the lack of information about “who owns what” within households—with a few exceptions. As we will see first, data on individual wealth are imperfect and imprecise, a default that seriously limits the ability to assess the gender wealth gap. The section goes on to examine the main results of analyses of wealth inequality between men and women, and the last part reviews a few results on the distribution of wealth within couples.
12.7.1 Who Owns What Within Households?
“Who” owns what within households is rather difficult to identify because, with very few exceptions, surveys collect information on household wealth[833]; surveys typically ask the respondent whether he/she/another member of the household owns such or such an item (and associated debt), then the value of each item if it was sold at the date of interview or elements allowing a value to be imputed.[834] Few surveys provide detailed information about the assets of all household members or whether the assets are owned individually or jointly.
The lack of data on individual wealth is probably one of the most serious limitations to research on wealth inequality between men and women. This is why most ofthe existing empirical work is based on household-level information and either compares men and women in different types of households (distinguishing single households headed by a man or a woman), divides the household wealth between its members, or combines partial information about ownership (when available) and computes a measure of “individualized” wealth. In our review of recent empirical work (1999—2013) addressing the question of the gender wealth gap,[835] we found very few studies able to make relatively precise individual imputations without making the assumption of equal ownership of all the assets.
In addition to surveys, there are other sources of information on wealth, either register data from taxes on wealth (when such taxes exist) or from estate tax records, but they are not really suitable for the analysis of gender inequality for several reasons. First, because of exemption thresholds, they only cover the upper part of the wealth distribution, possibly biasing estimates by gender if men and women are not evenly represented over the distribution (survey data, on the contrary, tend to underrepresent this upper part, but this is generally corrected by oversampling the top of the distribution). In addition, taxes on wealth are levied on fiscal units that are not necessarily individuals. The major drawback of estate tax records, which provide information on individual wealth holdings, is that the information only covers dead people. However, using estimates derived from this information,[836] a small number of studies from the 1970s and early 1980s provide some evidence on the distribution of wealth by gender in the United Kingdom and the United States.[837] They observed that women held less wealth than men but that there was a larger gap at the top of the wealth distribution (Atkinson, 1971; Atkinson and Harrison, 1978; Smith, 1974), a greater concentration of wealth among women than among men (Atkinson and Harrison, 1978), differences in the composition of assets, fewer debts in the richest women’s wealth than in the richest men’s (Smith, 1974), differences in the origin of the assets (Harbury and Hitchens, 1977), and differences in the influence of age and wealth on the composition of men’s and women’s portfolios (Shorrocks, 1982).
However, these results, while they provide valuable indications of differing patterns of wealth accumulation (albeit among a population limited to the wealthiest), describe generations from before “the quiet revolution” (the estimates are derived from estate data in the 1960s and 1970s), when women’s wealth was more likely to depend on their fathers’ or husbands’ wealth than on “self-made” wealth (see Harbury and Hitchens, 1977), fewer women had independent incomes, and marriages were more stable than today. In the case of the United States, a recent estate-based study by Edlund and Kopczuk (2009) shed some doubt about the actual effect of the change in women’s economic status. They showed that the share of women among the very wealthy, after peaking at the end of the 1960s, returned to its prewar level by 2000. Their analysis of this evolution is that the share of women at the top of the wealth distribution reflects the share of inherited wealth in an inverse relation with technological change: the information technology revolution (in which men made new fortunes) coincides with the turning point, in the 1970s, in the share of women among the very wealthy. Among the most wealthy, the trends Edlund and Kopczuk outlined ultimately point out the continuing gender gap in entrepreneurship.12.7.2 Investigating the Gender Gap in Wealth
Facing the unanswered question of “whose asset is it?” in couple households (and multiperson households in general), researchers have adopted strategies that, one way or another, sidestep the issue of the distribution of wealth within the household. We first describe these strategies and their limitations, then the main results.
12.7.2.1 Strategies and Limitations
There are two main ways to avoid the issue of intrahousehold distribution of assets. One (the most frequent) is to compare the net worth of men or women living in couple households and those in “not-couple” households (i.e., households in which the head/reference person has no partner or spouse at the time of survey) and use the gender and other characteristics of the household’s head as explanatory variables of the household’s wealth.
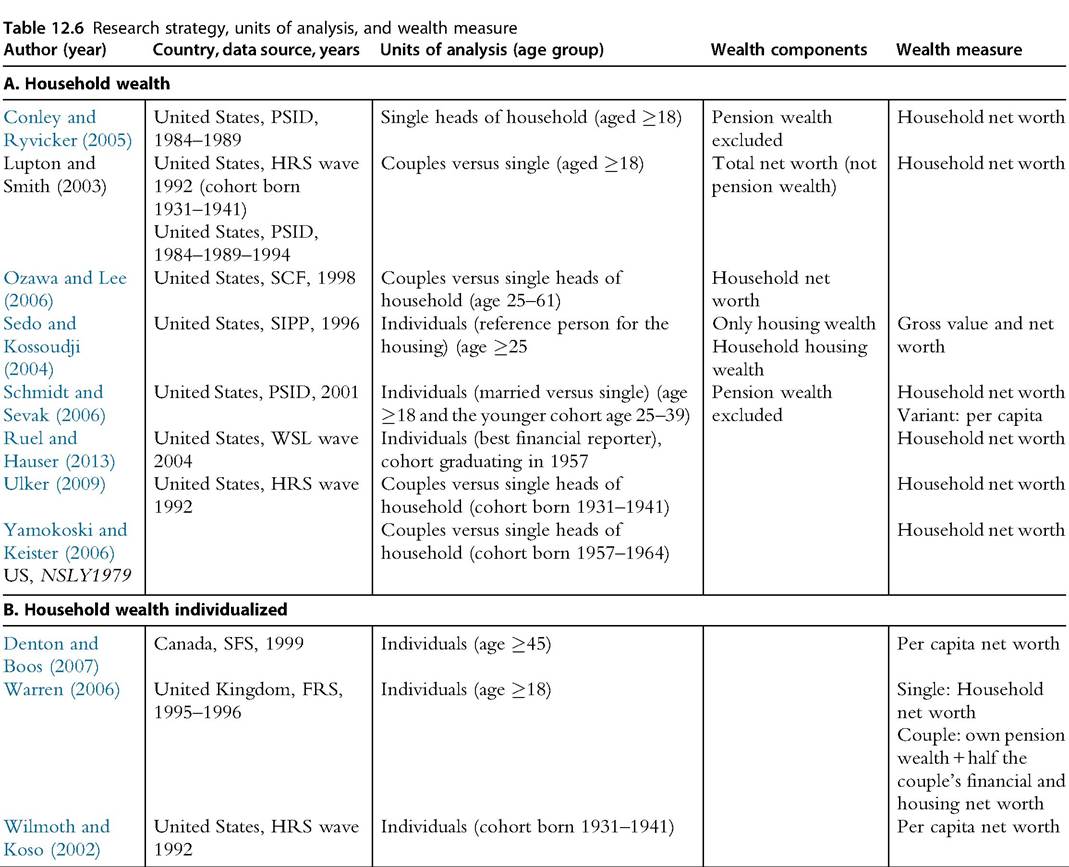
Another strategy consists of imputing “individualized” levels of wealth (either per capita net worth, assigning equal shares to each partner in couple households, or using combined estimates, adding individual assets for which individual-level information exists and equal shares of the other assets14 ). Alternatively, some studies focus on one sole type of asset for which their data provide individual-level information. The selection of studies referred to in the review of results is presented in Table 12.6.While better than nothing, none of these options is satisfying. First, comparing couples and single individuals obviously conflates gender and family/household composition. Most studies focus on the gap between single men and women heading households, but men and women are likely to head different sorts of households[838] [839]— most households headed by women contain no adult man, and single men heading households are more likely to be young and/or childless. Households headed by single women can also be more heterogeneous than those headed by single men, as underlined by Conley and Ryvicker (2005). Single women heading households are more likely to have children or to be older (and widowed), hence conflating not only gender and family composition but also life cycle effects. The “individualization” option is very likely to result in biased estimates of individuals’ wealth holdings.[840] For couple households, FRS, Family Resources Survey; HRS, Health and Retirement Survey; NLSY1979, National Longitudinal Survey of Youth 1979 cohort; PSID, Panel Survey of Income Dynamics; SCF, Survey of Consumer Finances; SFS, Survey of Financial Security; SIPP, Survey of Income and Program Participation; WLS, Wisconsin Longitudinal Survey. dividing the couple’s assets equally entails the assumption that all assets are owned jointly and that each partner holds an equal share. Finally, comparing men’s and women’s wealth over only one type of asset obviously provides a partial measure of the extent of gender wealth inequality. It is an attractive option for analytical purposes (e.g., selection in ownership; cf.Sedo and Kossoudji, 2004), but it does not account for the choice between alternative investments or the influence of total wealth and family composition on the composition of assets. This review of obstacles and limitations may seem somewhat discouraging. However, working within these limits provides some indications of the influence of marital status and history in the process of wealth accumulation between men and women and points to some gender differences in wealth ownership. For simplicity, we talk of “married” men and women for couple households (including cohabiting couples unless results distinguish between marital status) and of “single” men and women for single households. 12.7.2.2 Evidence: Gender and Composition Effects As might be expected, the result regularly obtained is that, once relevant characteristics have been controlled for (the minimum set includes age, education, inheritance, race, a measure of income, and/or current labor market status[841]), married men and women have an advantage in the accumulation of wealth over single men and women, that is, a “marriage effect” (Denton and Boos, 2007; Lupton and Smith, 2003; Ozawa and Lee, 2006; Schmidt and Sevak, 2006; Wilmoth and Koso, 2002; Yamokoski and Keister, 2006). The second general result is that single men have an advantage over single women (Conley and Ryvicker, 2005; Denton and Boos, 2007; Lupton and Smith, 2003; Ozawa and Lee, 2006; Schmidt and Sevak, 2006; Wilmoth and Koso, 2002). Finally, virtually all the results point to single parents (mostly women) as the most disadvantaged group compared with any other combination of gender and household composition. Beyond this general hierarchy related to household composition, there are some discrepancies. One is between wealth levels: the marriage effect is larger in the upper part of the distribution, and the gap between single men and single women disappears at the 75th percentile (Schmidt and Sevak, 2006). Using a measure of savings, Lupton and Smith (2003) found a larger advantage of married couples at higher levels of net worth and discuss a possible impact of sorting into marriage (i.e., “prudent” individuals would be more likely to marry and to stay married or to remarry after a divorce because they also find that divorced and remarried individuals have better outcomes than divorced people). The other discrepancy is between cohorts. When they restrict their sample to a cohort aged between 25 and 39 in the early 2000s, Schmidt and Sevak (2006) no longer obtained statistically different effects of household composition or gender, indicating either a cohort effect or a life cycle effect. In the first case, this could result from the closing of other gender gaps; in the second, it would indicate that, because wealth inequality builds over time, these young households have not yet accumulated enough for a gender and a family differential to appear. These results do not entirely converge with those obtained from another cohort of about the same age at the same period: Yamokoski and Keister (2006) found almost no difference between never-married men and women and no significant difference between divorced women and men with children, but they found a strong marriage effect. There is also a marriage effect among older cohorts, although it is mitigated by marital history. In short, any disruption from continuous marriage has a negative impact on accumulated wealth and any past marital dissolution has a negative impact (Ulker, 2009; Wilmoth and Koso, 2002; both used data on the wealth of a cohort born between 1931 and 1941 and collected in 1992). However, the effects differ for men and women depending on the type of disruption and the current marital status; compared with continuously married men, the effect of having never married, having divorced once or twice, or being separated after a second marriage (the worst case) are significantly larger for women than for men (Wilmoth and Koso, 2002). Ruel and Hauser (2013) studied a cohort of men and women who graduated in 1957 (wealth was measured in 2004). Among those not currently married, they found no real gender effect on the accumulated net worth—the difference between men and women is essentially explained by labor market history, past income (nonasset income), and current earnings (controlling for education, social origin, and inheritances). Nevertheless, divorce has a small negative effect on women’s net worth, but the major factor is the gender earnings gap over the work-life cycle. Among the currently married, and compared with continuously married men, continuously married women have a significant disadvantage, as do divorced men and, even more so, divorced women. But their full model explains a rather small portion of the accumulated wealth, suggesting unobserved heterogeneity (e.g., different preferences in savings and investment). For currently married men and women, they discussed a possible effect of comparing men and women as the “best financial respondent”: if men are more likely to be the couple’s best respondent in wealthy couples and women in less wealthy couples, the gender of the respondent depends on the household’s level of wealth.[842] In addition to the effect of the interaction of gender and household composition, other studies have investigated more specifically the effect of the labor market dimension. Women’s lower earnings affect their capacity to save, and they have less continuous careers. They are therefore likely to accumulate fewer assets than men (Denton and Boos, 2007) and less pension savings (Warren, 2006). Other occupational differences also determine different opportunities to accumulate assets. For example men, who are more often self-employed than women (see Section 12.4), are more likely to hold business assets. In the United States in 1998, households headed by single men owned about three times the net worth owned by those headed by single women (Ozawa and Lee, 2006). In Germany in 2002, the ratio of men’s to women’s business assets (gross value) was about 5.5 (Sierminska et al., 2010). In their full model of married men and women, Ruel and Hauser (2013) obtained large and significant coefficients for self-employed men (among the largest coefficients, together with past incomes). Empirical work based on household-level information on wealth suffers from several limitations but provides two main results: virtually all the results show strong effects of marital status (understood as a type of household/family)—but mitigated effects of marital history—and significant differences related to labor market outcomes, that is, the two essential dimensions of gender economic inequality, but not independent of each other. The main limitation is that the results are unclear about the exact unit analyzed because the dependent variable is a household variable and the independent variables are those of one person in the household.[843] This mixing of gender and marital status/household composition and finally parenthood (a second best justified by the absence of appropriate data) has many limits. 12.7.3 Measuring the Gender Gap in Wealth and Its Components So far, only two studies, those by Sierminska et al. (2010) and Bonnet et al. (2013), have measured and investigated the gender wealth gap using data that allow a gender gap in wealth to be computed, that is, considering men and women in any type of household. While the data they use (the German Socio-Economic Panel 2002 and the French HouseholdWealth Survey “Enquete Patrimoines” 2003-2004, respectively) do notpro- vide directly individual wealth variables, they do provide information allowing individual wealth to be computed (on the basis of questions about the share of common property held by couples’ partners) rather than assuming equal ownership. Both these studies found a substantial gender wealth gap: men’s net worth is higher than women’s by 45% in Germany and by 16% in France. Accounting for at least some of this huge difference between the two countries, Bonnet et al. did not include business assets in their definition of wealth; in Germany, the gender gap in business wealth is the highest of the gaps by component[844] (the men-to-women ratio is 5.5). In particular, the total gender gap is higher in the subsample of married couples than on average in Germany (similar in France), higher in the subsample of cohabitant partners than among the married subsample—suggesting different financial arrangements—and lower than the average in the subsample of singles living alone (and nonexistent in France in 2009-2010). OLS regressions show all the expected associations between wealth, marital status, and labor market characteristics, controlling for education, permanent income, and social origin.[845] The most interesting results are, for both countries, the decomposition of the gender wealth gap, even more so because the two studies use the same methodology (DiNardo et al., 1996), although they are not fully comparable because Sierminska et al. (2010) only analyzed the composition of the gap in their sample restricted to married/ cohabiting men and women, and Bonnet et al. (2013) decomposed the gap of their full sample of men and women. In both countries, the main contributions to the gender wealth gap were income and a set of labor market characteristics, especially at the median and upper deciles ofthe distribution.[846] But the most striking result is the relatively large share of the gender wealth gap that is not explained by the characteristics, especially in the lower part of the distribution (and larger in Germany than in France) and its sign (negative) in both countries.[847] These results suggest that, with given characteristics, women obtain more wealth than men, that is, they get better returns to their characteristics. But men have, on average, “better” characteristics than women and therefore own more wealth. In both papers, the authors speculate about these “better returns” along two main tracks. One is the “marital” track: women benefit from the relatively better characteristics of their partner/husband (and perhaps deceased husband); this line, consistent with the “male breadwinner model,” is especially attractive for Germany (the results are for married men and women); the results for France do not allow anything more than speculation, but it could be less relevant given that one of the major differences between the two countries is the higher degree of gender inequality in terms of labor market characteristics and outcomes in Germany. The other line of inquiry concerns gender differences in “preferences,” involving risk preferences and their effect on savings and investment choices. Risk preference determines the share allocated to risky assets, which are assumed to yield better returns; income depends on the allocation of savings to more or less risky investments and in turn determines the potential for future investment. A gender difference in risk preference could then, in the long run, help to explain a wealth gap between men and women who are otherwise comparable. The question of a gender effect on risk tolerance/aversion has been investigated extensively (see Section 12.3), providing indications that women are more risk averse than men or that men are overconfident (e.g., Barber and Odean, 2001). However, risk preferences might explain very little of the gender gap in wealth. Estimating the choice of risky assets (the share of stocks in older Americans’ individual retirement accounts), Neelakantan (2010) found that the gender differential in risk tolerance accounts for 10% and the gender gap in earnings for 51% of the difference between men’s and women’s accumulated retirement accounts. Barasinska and Schafer (2013) also showed that between men and women with similar risk preferences (measured by the presence of risky assets in their financial portfolio), there is no significant difference in the allocation decision (measured by the share of risky financial investments), except in Italy—a result that they related to a choice of identity in a context of high gender inequality. Other research invokes a possible effect of a differential in financial literacy (e.g., Van Rooij et al., 2011). Dwyeret al. (2002) found that controlling for financial knowledge significantly reduced the impact of gender on investment decisions but that this effect was difficult to assess among representative samples. The effect of gender differences in the choice of investment could be more complicated to assess in the case of men and women living together (a large share of the adult population); savings and investment decisions may result from the interaction of partners’ preferences. Finally, the issue of investment choice raises the issue of wealth inequality and power in decision making within the household. 12.7.4 Wealth and Gender Within the Household Given the lack of information on individual wealth, intrahousehold (intracouple) wealth inequality and the role of partners’ preferences in saving and investing decision making have seldom been analyzed. A first question is that of the pattern of ownership (joint/ separate) and the distribution of wealth between spouses/partners. Grabka et al. (2013), using the German Socio-Economic Panel 2007, found a large within-couple gender wealth gap; on average, women’s assets represent about 37% of the couple’s wealth—a quite different picture from the assumed equality—and the gap tends to increase with the wealth level. Men hold more wealth than women in 52% of couples, women hold more in 29% of couples, and the shares are equal in the remaining 19%. Kan and Laurie (2013), using the British Household Panel Survey (HPS) (which collected data on savings, financial investments, and debts at the individual level in 1995, 2000, and 2005), found that savings are more often jointly held than investments or debts and, controlling for ownership, that the likelihood of joint ownership of the three types of assets is lower among cohabiting couples—a pattern already identified for income pooling (e.g., Vogler et al., 2006; see also Section 12.2).[848] The next issue concerns the relation between gender, preferences, financial decision making, and wealth within couples. The general pattern that emerges from various empirical results is that there is a relation, but it is mediated by the level of income, wealth, and context. In the Netherlands, Barasinska and Schafer (2013) found that in couples who reported that they make financial decisions jointly, gender has no effect on the probability of ownership of risky assets but the differential in risk tolerance between the spouses has an effect: any level of risk tolerance of one spouse has a reduced effect if the other spouse is more risk averse. Such an effect of mitigation is illustrated by Love (2010). Studying allocations after a divorce, he showed that men choose riskier investments than women and that transitions from divorce to marriage have opposite effects. In the United States, Neelakantan et al. (2009) found support for the prediction of the collective model: the household portfolio is determined by the risk preference of the spouse with more bargaining power. This result is somewhat contradicted by Gibson et al. (2006) in Australia; they found that the level of accumulated wealth among preretirement couples is not higher when women have more bargaining power (measured by a power index combining age, education, inherited wealth, and income); the reason is that the public pension system in Australia better replaces preretirement income for women than for men. In Canada, Phipps and Woolley (2008), using various measures of control over money, found that women’s greater control is associated with lower probabilities of contributions to a private savings plan both for men and women. However, women’s control is more frequent at lower-income levels, and savings are primarily associated with income. Finally, in Germany, Grabka et al. (2013) found that the wealth gap tends to be higher in couples where the financial decisions are most often made by the man and that men are more likely to make financial decisions in wealthier couples (a question also addressed by Ruel and Hauser, 2013). All in all, things are rather difficult to disentangle— especially because joint ownership is almost never controlled for, “who makes decisions” is self-reported, and there may be divergence between each spouse’s view of “who decides” (for retired couples in the United States see Elder and Rudolph, 2003) or about the couple’s financial difficulties (see Breunig et al., 2007, with Australian data). Further research taking into account a possible difference between what happens in married and cohabiting couples would also be useful. 158 What conclusions can be drawn from research on the gender wealth gap in the past decade? First, it seems that there really is a gender gap in wealth, but there are far too few empirical studies that can provide an assessment of its full extent. For the time being, one could say that the gender gap in wealth seems easier to explain than to measure. As for the explanations, they converge on a strong effect of gender earnings differentials mitigated by strong effects of marital status and history, complicated by additional effects of cohorts and total wealth. In addition, a large share of the existing empirical work consists of research on the United States, with a particular household structure[849] and based on inappropriate data. It is an understatement to conclude that more research—and comparative work—is needed to allow for common methodologies to build up. Identifying who owns and controls assets within households is a prerequisite to gaining knowledge that has important implications for the analysis of gender inequality, as underlined by Deere and Doss (2006). Gaining knowledge is conditioned by the availability of appropriate data. This is a challenge for statistics, a challenge seldom acknowledged to date, as exemplified by the recent initiative of the European Central Bank aimed at developing harmonized data on wealth. On the model of the Canberra Group, the Central Bank seems to have adopted the standard unitary approach; the questionnaires available online[850] show no intention to collect any details on individuals or ownership status. The Luxembourg Wealth Study,[851] a project aimed at building a data set based on harmonized national data, seems to have missed the issue, too (see Barasinska and Schafer, 2013, who mention that individual information is lost through data standardization [p. 8]). As mentioned in Section 12.2 in our discussion ofincome statistics, the increased financial independence of women and changing patterns of families and households provide good reasons to argue that statistics must change as well. 12.8.
More on the topic WEALTH AND GENDER:
- Contents
- Chinese Religions on Gender and Identity
- El Salvador
- Pluralistic elements of a new family law
- Gender in Islamic legal tradition
- The Zoroastrian Community: Social and Ethical Responsibilities
- Bibliographic Essay
- Musawah: scholarship and activism
- Data for Multidimensional Poverty Measurement
- Bibliographic Essay