CARROLL DIAGRAMS FOR 4 OR 5 CATEGORIES
Traditionally, arguments were treated by the theory of the syllogism. This involved putting each constituent statement into standard form, i.e., finding the equivalent A-, E-, I-, or Î-statement, and then breaking the argument down into a series of syllogisms, each one with two premises and a conclusion involving each of three predicate terms twice.
These syllogistic inferences were then compared with known valid forms, and there were a series of rules involving “mood” and “figure” for conversion into such forms. If an inference was not convertible by these rules into a valid form, then it was invalid.The algebraic class logic invented in the nineteenth century by Boole, Venn, Carroll, and others was already considerably more general than this, as well as much easier to use. For example, as we have already seen, it could deal as well with those individuals not falling under a category as those that did. Consider, for instance, the following example of Carroll’s:
No country that has been EXPLORED is infested with DRAGONS.
Unexplored countries are FASCINATING.
Therefore any country infested with dragons is fascinating. (UD: countries)
The first premise is an E-statement, No E’s are D’s. But what of the second? This is All non-E’s are F. But that is not equivalent to any A-, E-, I-, or Î-statement. The Carroll diagram, nevertheless, is straightforward:
D
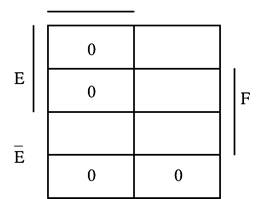
There are no countries in the E,F overlap, so we insert 0’s there; and the conclusion follows: any country which is D must also be F.
Another advantage of Venn’s and Carroll’s approach is that it can be extended to arguments containing more than three predicates.[70] Our diagram for a 4-predicate argument is a very simple extension of the diagrams we have used for 2 and 3 predicates.
The fourth category is put in the middle at the bottom, dividing the original square into 16 cells. Let’s illustrate it with one of Carroll’s whimsical examples: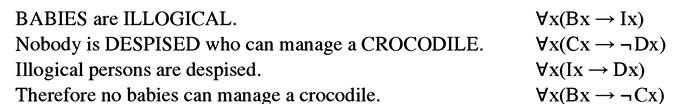
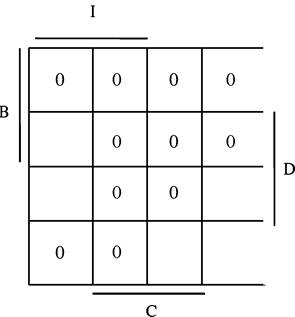
We make the top 2 rows all B’s, the 2 columns on the left all I’s, the 2 rows in the middle all D’s, and the 2 columns in the middle all C’s, like this:
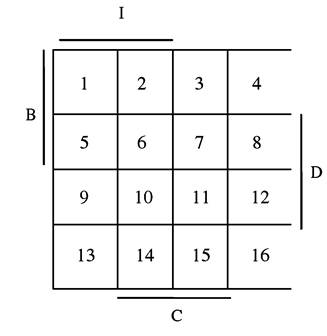
The three premises require O’s in, respectively, the BI region (in squares 3, 4, 7, and 8), the DC region (6, 7, 10, 11), and the IDregion (1, 2, 13, 14). In marking them in we see that the BC region (2, 3, 6, 7) has already been filled with O’s, so the denial of the conclusion is incompatible with the acceptance of the premises. The argument is valid.
As a second example, we can look at the argument from the last chapter concerning the pilot of the Egyptian fighter plane:
The downed pilot who flew the Egyptian FIGHTER had BLOND hair. EGYPTIAN pilots don’t have blond hair. Any non-Egyptian pilot would have to be a RUSSIAN. Hence there are Russians flying Egyptian fighters. [UD: pilots]
In such a case we must do any universal statements first, putting O’s the areas in which there are no individuals, and then entering any particular or singular statements. This gives us O’s in the four cells of the EB region, and also in the four comer cells representing E R. It only remains to put in the first premise, that d has to be both F and B, so we put a d in the only non-empty square in the FB quadrant:
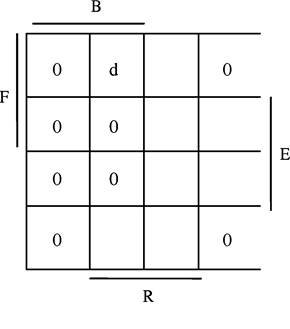
We see that the conclusion, that some R are F, is represented on the diagram as required. Alternatively put, the denial of the conclusion—which would be the assertion that there are no Russians flying Egyptian fighters—is incompatible with the premises.
So the argument is VALro by our definition of validity.Venn’s diagrams are hard to extend to 5-predicate arguments, and here Carroll saw a decisive advantage of his methods. His technique for such arguments was to take the Carroll diagram for a 4-predicate argument and divide each square by a diagonal slash. But we can improve on this in a more natural way by dividing each square horizontally into two. This is a natural generalization of the diagrams we have been using, and it has the added advantage that it generalizes upwards for any number of predicates. Let’s illustrate it using another of Carroll’s examples. The problem here is to determine the conclusion assuming every name or predicate appears exactly twice:
All writers who UNDERSTAND human nature are CLEVER. No one who cannot STIR people’s hearts is a TRUE poet. Shakespeare wrote HAMLET. No writer who does not understand human nature can stir people’s hearts. Only a true poet could have written Hamlet.
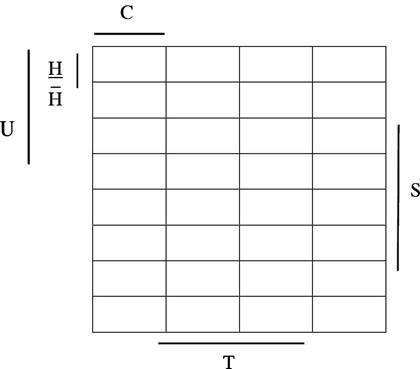
In this diagram the top half of each cell represents those who wrote Hamlet, the bottom half those who did not write it. Filling in the premises, we should leave ones involving a proper name (Shakespeare) till last. Also, it is easier to deal with the ones explicitly involving H after all the others. Doing this, we get 0’s in the UCregion, in TS, in SU, and then in each of the upper half-squares HT, and finally an s in the only H half-square left, giving:
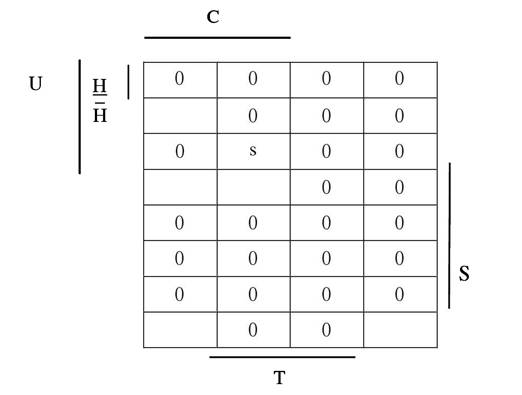
The only predicates and names to appear only once so far are Shakespeare (s) and “is clever” (C), so (assuming every name or predicate appears exactly twice) we see that the desired conclusion is “Shakespeare is clever.”
We can generalize this method of diagrams further. A sixth predicate, such as E, “is English,” could split each of the cells vertically, EIE producing 64 cells:
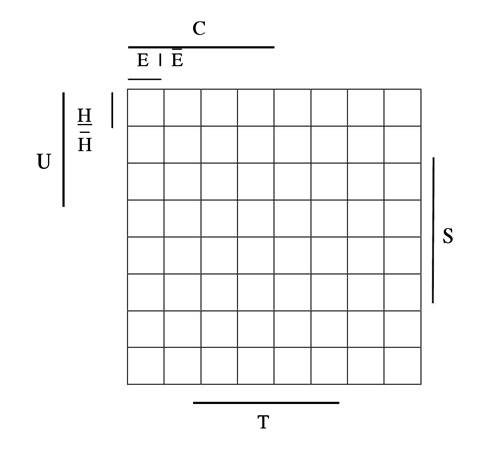
In fact, this method may be generalized to accommodate further predicates as desired, doubling the number of cells for each new predicate.[71]
18.1.2
More on the topic CARROLL DIAGRAMS FOR 4 OR 5 CATEGORIES:
- Appendix Three Logic Diagrams
- Index
- CONVERSION
- Contents
- SORITES
- SINGULAR STATEMENTS AND INDIVIDUAL NAMES
- EVALUATING VALIDITY OF SYLLOGISMS