Appendix Three Logic Diagrams
VENN DIAGRAMS
In the text we have used a version of Logic Diagrams pioneered by Lewis Carroll (i.e., Charles Dodgson), in preference to the usual Venn diagrams employed not only in many logic textbooks, but in many other fields besides.
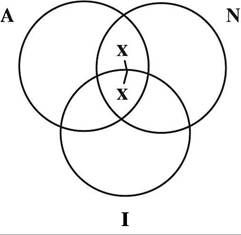
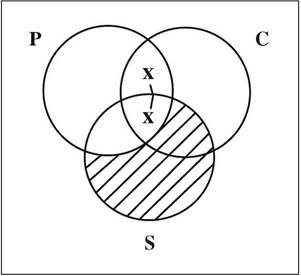
In this appendix I am going to discuss the relative merits of the two approaches.A Venn diagram for an argument involving 3 predicates is drawn with three overlapping circles. It was Venn’s invention to put an ix, in a region we know to be occupied, so that the following diagram would represent “Some A are N”:
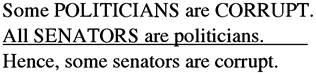
In Venn’s method, any region we can see to be empty is shaded. Thus to diagram “All senators are politicians” we must shade the area representing senators who are not politicians. This is done in the figure below testing the validity of the following argument:
Carroll himself was not shy in boasting the advantages of his diagrams over Venn’s:
My Method of Diagrams resembles Mr. Venn’s, in having separate compartments assigned to the various Classes, and in marking these Compartments as occupied or as empty, but it differs from his Method, in assigning a closed area to the Universe of Discourse, so that the Class which, under Mr. Venn’s liberal sway, has been ranging at will through infinite space, is suddenly dismayed to find itself “cabin’d, cribb’d, confined,” in a limited Cell like any other Class!
Also, Carroll continues, “I use rectilinear, instead of curvilinear, Figures; and I mark an occupied Cell with I (meaning that there is at least one Thing in it,) and an empty Cell with an O (meaning that there is no Thing in it).” It must be admitted, I think, that Carroll’s figures have a more aesthetically pleasing appearance than Venn’s.
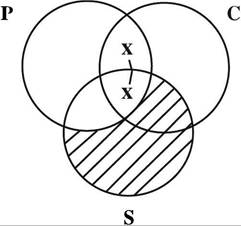
Ignoring for now the fact that Carroll symbolizes Ŕ-statements with existential import, the resulting figure for the above argument would be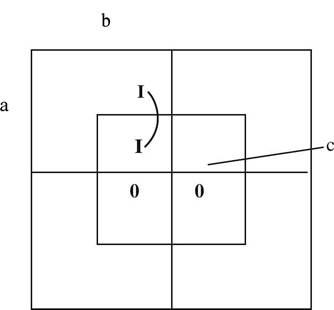
As can readily be seen, both methods give the same result: the argument is invalid. We do not know from the given premises whether the corrupt politicians are senators or not, so the negation of the conclusion, “No senators are corrupt,” is consistent with the premises’ being true.
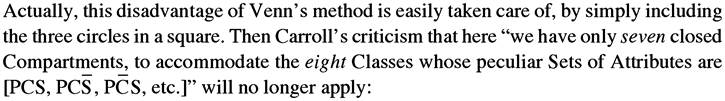
Where Carroll’s diagrams really seem to have the advantage over Venn’s, however, is in arguments involving 4 or more predicates or classes. Carroll quotes Venn: “With four terms in request, the most simple and symmetrical diagram seems to me that produced by making four ellipses intersect one another in the desired manner,” commenting that “this, however, provides only fifteen closed compartments.”
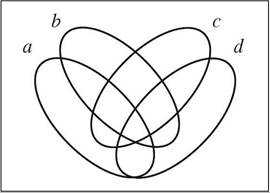
Again, a box around the whole figure will give a sixteenth compartment for individuals not in classes a, b, c, or d. But if it is difficult to draw the four ellipses with the required overlap, it is even more difficult to fill this diagram in without making mistakes.
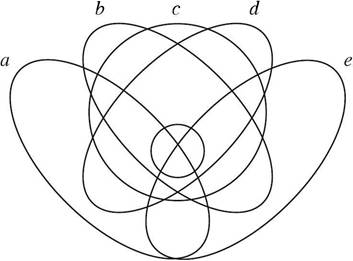
All of this is even more the case with Venn’s diagram for an argument involving 5 predicates of classes:
For five letters, “The simplest diagram I can suggest,” Mr. Venn says, “is one like this (the small ellipse in the centre is to be regarded as a portion of the outside of c∖ i.e., its four component portions are inside b and d but are no part of c). It must be admitted that such a diagram is not quite so simple to draw as one might wish it to be; but then consider what the alternative is if one undertakes to deal with five terms and all their combinations—nothing short of the disagreeable task of writing out, or in some way putting before us, all the 32 combinations involved.”
Carroll’s diagram for 4 classes, on the other hand, is simplicity itself.
Let me now turn to a comparison of his diagrams and my modifications of them.CARROLL DIAGRAMS
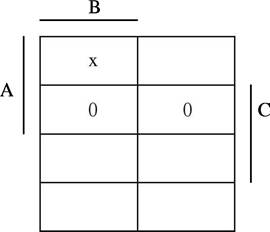
The three main changes I have made to Carroll’s diagrams are (i) to simplify the grids to make them easier to use, (ii) to adjust them to the modem convention on existential import, and (iii) to adjust them to the modem convention concerning individual names, which Carroll counted as singleton classes. Other minor changes involve replacing Carroll’s T by Venn’s ix, for an arbitrary individual, and using capitals for predicates instead of Carroll’s lower case letters. The first change loses some of the aesthetic appeal of Carroll’s diagrams, but it makes them easier to use. This can be seen most easily in the case of the diagrams for 3 classes, where Carroll’s demand for bilateral symmetry, while pleasing to the eye, leaves awkward L-shaped comer regions which interfere with ease of use (this criticism can only really be appreciated if you try both methods for a while).
For example, the two statements “Some AFRICANS are BANTUS” and “No CHEROKEES are AFRICANS” would be represented on Carroll’s own diagrams as follows:
From this it is possible to read off the conclusion, that “Some Bantus are not Cherokees,” but I believe this is easier to see on my modified versions of his diagrams:
We can illustrate Carroll’s diagram for 4 classes by reference to one of his own arguments:
No TERRIERS wander among the signs of the ZODIAC. Nothing that does not wander among the signs of the zodiac is a COMET. Only terriers have cURLY tails. [U := has a curly tail]
Carroll himself uses lower case letters as variables: a := is a terrier, b := wanders among the signs of the zodiac, c := is a comet, d := has a curly tail. His basic grid for 4 letters is as follows:
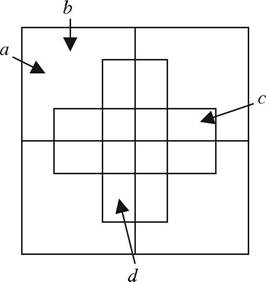
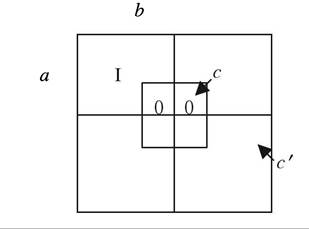
The areas for a are in the top half of the figure, for b in the left half, for c in horizontal rectangle, for d in the vertical rectangle.
The information from the premises is: No a are b; no non-/? are c∖ only a are d. Adding it gives
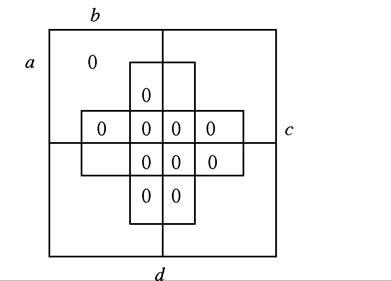
From this we can deduce that “no c are d” “No comets have curly tails”—a delightfully perverse conclusion, given the facts! Compare with the diagram for chapter 18, exercise 9 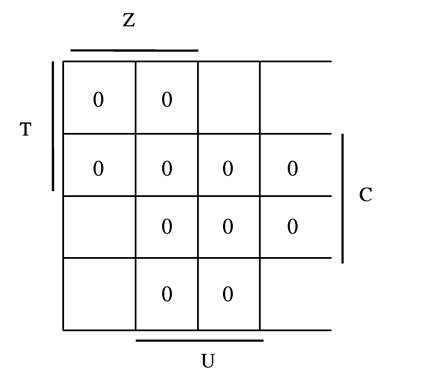
For arguments involving 5 categories, Carroll divides each region of the 4-category diagram into two with a diagonal slash from bottom left to top right, “assigning all the upper portions to e, and all the lower portions to e'” (Symbolic Logic, 244), giving
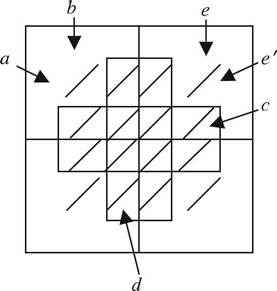
Carroll’s generalization to 6 categories is by means of a diagonal slash dividing each region from top left to bottom right. I think it can be appreciated that these diagrams are not all that easy to use, and I hope my diagrams for 5-and 6-category diagrams are a little easier (see chapter 18).
More on the topic Appendix Three Logic Diagrams:
- Appendix Three Logic Diagrams
- Arthur R.T.W.. An Introduction to Logic: Using Natural Deduction, Real Arguments, a Little History, and Some Humour. Broadview Press,2016. — 456 p., 2016
- CARROLL DIAGRAMS FOR 4 OR 5 CATEGORIES
- Contents
- Preface for Instructors
- REVIEW OF FORENSIC ASSESSMENT INSTRUMENTS
- Consumer Theory
- The Theory of Income Determination
- Economic Analysis