The American Business Cycle: The Historical Record
Summarize the history of the American business cycle.
An overview of American business cycle history is provided by the NBER's monthly business cycle chronology,3 as summarized in Table 8.1.
It gives the dates of the troughs and peaks of the 33 complete business cycles that the U.S. economy has experienced since 1854. Also shown is the number of months that each contraction and expansion lasted.The Pre-World War I Period
The period between the Civil War (1861-1865) and World War I (1917-1918) was one of rapid economic growth in the United States. Nevertheless, as Table 8.1 shows, recessions were a serious problem during that time. Indeed, the longest contraction on record is the 65-month-long decline between October 1873 and March 1879, a contraction that was worldwide in scope and is referred to by economic historians as the Depression of the 1870s. Overall, during the 1854-1914 period the economy suffered 338 months of contraction, or nearly as many as the 382 months of expansion. In contrast, from the end of World War II in 1945 through June 2018, the number of months of expansion (750) outnumbered months of contraction (122) by more than six to one.
The Great Depression and World War II
The worst economic contraction in the history of the United States was the Great Depression of the 1930s. After a prosperous decade in the 1920s, aggregate economic activity reached a peak in August 1929, two months before the stock market crash in October 1929. Between the 1929 peak and the 1933 trough, real GDP fell by nearly 30%. During the same period the unemployment rate rose from about 3% to nearly 25%, with many of those lucky enough to have jobs only able to work part-time. To appreciate how severe the Great Depression was, compare it with the
3For a detailed discussion of the NBER chronologies, see Geoffrey H.
Moore and Victor Zarnowitz, “The NBER's Business Cycle Chronologies," in Robert J. Gordon, ed., The American Business Cycle: Continuity and Change, Chicago: University of Chicago Press, 1986. The NBER chronology is available at the NBER's website, www.nber.org.TABLE 8.1
NBER Business Cycle Turning Points and Durations of Post-1854 Business Cycles
| Trough | Expansion (months from trough to peak) | Peak | Contraction (months from peak to next trough) |
| December 1854 (IV) | 30 | June 1857(II) | 18 |
| December 1858 (IV) | 22 | October 1860(III) | 8 |
| June 1861 (III) | 46 (Civil War) | April 1865(I) | 32 |
| December 1867 (I) | 18 | June 1869(II) | 18 |
| December 1870 (IV) | 34 | October 1873(III) | 65 |
| March 1879 (I) | 36 | March 1882(I) | 38 |
| May 1885 (II) | 22 | March 1887(II) | 13 |
| April 1888 (I) | 27 | July 1890(III) | 10 |
| May 1891 (II) | 20 | January 1893(I) | 17 |
| June 1894 (II) | 18 | December 1895(IV) | 18 |
| June 1897 (II) | 24 | June 1899(III) | 18 |
| December 1900 (IV) | 21 | September 1902(IV) | 23 |
| August 1904 (III) | 33 | May 1907(II) | 13 |
| June 1908 (II) | 19 | January 1910(I) | 24 |
| January 1912 (IV) | 12 | January 1913(I) | 23 |
| December 1914 (IV) | 44 (WWI) | August 1918(III) | 7 |
| March 1919 (I) | 10 | January 1920(I) | 18 |
| July 1921 (III) | 22 | May 1923(II) | 14 |
| July 1924 (III) | 27 | October 1926(III) | 13 |
| November 1927 (IV) | 21 | August 1929(III) | 43 (Depression) |
| March 1933 (I) | 50 | May 1937(II) | 13 (Depression) |
| June 1938 (II) | 80 (WWII) | February 1945(I) | 8 |
| October 1945 (IV) | 37 | November 1948(IV) | 11 |
| October 1949 (IV) | 45 (Korean War) | July 1953(II) | 10 |
| May 1954 (II) | 39 | August 1957(III) | 8 |
| April 1958 (II) | bgcolor=white>24April 1960(II) | 10 | |
| February 1961 (I) | 106 (Vietnam War) | December 1969(IV) | 11 |
| November 1970 (IV) | 36 | November 1973(IV) | 16 |
| March 1975 (I) | 58 | January 1980(I) | 6 |
| July 1980 (III) | 12 | July 1981(III) | 16 |
| November 1982 (IV) | 92 | July 1990(III) | 8 |
| March 1991(I) | 120 | March 2001(I) | 8 |
| November 2001 (IV) | 73 | December 2007 (IV) | 18 |
| June 2009 (II) | 128 | February 2020 (IV) | 2 (Pandemic) |
| April 2020 (II) | 24* |
Source: Data from U.S.
Business Cycle Expansions and Contractions. National Bureau of Economic Research,Inc., www.nber.org/research/data/us-business-cycle-expansions-and-contractions.
*As of April 2022, this expansion was 24 months old.
recession of 2007-2009, which was the longest recession and the recession with the largest drop in real GDP in the period since World War II. The 30% decline in real GDP from peak to trough during the Great Depression was far more severe than the 4.2% peak-to-trough decline in real GDP during the 2007-2009 recession. In addition, the 25% unemployment rate during the Great Depression was more than double the unemployment rate of 10% reached during the 2007-2009 recession.
Although no sector escaped the Great Depression, some were particularly hard hit. In the financial sector, stock prices continued to collapse after the crash. Depositors withdrew their money from banks, and borrowers, unable to repay their bank loans, were forced to default; as a result, thousands of banks were forced
to go out of business or merge with other banks. In agriculture, farmers were bankrupted by low crop prices, and a prolonged drought in the Midwest turned thousands of farm families into homeless migrants. Investment, both business and residential, fell to extremely low levels, and a "trade war"—in which countries competed in erecting barriers to imports—virtually halted international trade.
Although most people think of the Great Depression as a single episode, technically it consisted of two business cycles, as Table 8.1 shows. The contraction phase of the first cycle lasted forty-three months, from August 1929 until March 1933, and was the most precipitous economic decline in U.S. history. After Franklin Roosevelt took office as President in March 1933 and instituted a set of policies known collectively as the New Deal, a strong expansion began and continued for 50 months, from March 1933 to May 1937. By 1937 real GDP was almost back to its 1929 level, although at 14% the unemployment rate remained high.
Unemployment remained high in 1937 despite the recovery of real GDP because the number of people of working age had grown since 1929 and because increases in productivity allowed employment to grow more slowly than output.The second cycle of the Great Depression began in May 1937 with a contraction phase that lasted more than a year. Despite a new recovery that began in June 1938, the unemployment rate was still more than 17% in 1939.
The Great Depression ended dramatically with the onset of World War II. Even before the Japanese attack on Pearl Harbor brought the United States into the war in December 1941, the economy was gearing up for increased armaments production. After the shock of Pearl Harbor, the United States prepared for total war. With production supervised by government boards and driven by the insatiable demands of the military for more guns, planes, and ships, real GDP almost doubled between 1939 and 1944. Unemployment dropped sharply, averaging less than 2% of the labor force in 1943-1945 and bottoming out at 1.2% in 1944.
Post-World War II U.S. Business Cycles
As World War II was ending in 1945, economists and policymakers were concerned that the economy would relapse into depression. As an expression of this concern, Congress passed the Employment Act of 1946, which required the government to fight recessions and depressions with any measures at its disposal. But instead of falling into a new depression as feared, the U.S. economy began to grow strongly.
Only a few relatively brief and mild recessions interrupted the economic expansion of the early postwar period. None of the five contractions that occurred between 1945 and 1970 lasted more than a year, whereas 18 of the 22 previous cyclical contractions in the NBER's monthly chronology had lasted a year or more. The largest drop in real GDP between 1945 and 1970 was 3.6% during the 1957-1958 recession, and throughout this period unemployment never exceeded 8.1% of the work force.
Again, there was a correlation between economic expansion and war: The 1949-1953 expansion corresponded closely to the Korean War, and the latter part of the strong 1961-1969 expansion occurred during the military buildup to fight the Vietnam War.Because no serious recession occurred between 1945 and 1970, some economists suggested that the business cycle had been "tamed," or even that it was "dead." This view was especially popular during the 106-month expansion of 1961-1969, which was widely attributed not only to high rates of military spending during the Vietnam War but also to the macroeconomic policies of Presidents John F. Kennedy and Lyndon B. Johnson. Some argued that policymakers should stop worrying about recessions and focus their attention on inflation, which had been gradually increasing over the 1960s.
Unfortunately, reports of the business cycle's death proved premature. Shortly after the Organization of Petroleum Exporting Countries (OPEC) succeeded in quadrupling oil prices in the fall of 1973, the U.S. economy and the economies of many other nations fell into a severe recession. In the 1973-1975 recession U.S. real GDP fell by 3.1% and the unemployment rate reached 9%—not a depression but a serious downturn nonetheless. Also disturbing was the fact that inflation, which had fallen during most previous recessions, shot up to unprecedented doubledigit levels. Inflation continued to be a problem for the rest of the 1970s, even as the economy recovered from the 1973-1975 recession.
More evidence that the business cycle wasn't dead came with the sharp 1981-1982 recession. This contraction lasted sixteen months, the same length as the 1973-1975 decline, and the unemployment rate reached 11%, a postwar high. Many economists claim that the Fed knowingly created this recession to reduce inflation. Inflation did drop dramatically, from about 11% to less than 4% per year. The recovery from this recession was strong, however.
The “Long Boom”
After the severe 1981-1982 recession the U.S. economy began an extended period of economic growth and reduced volatility of major macroeconomic variables. The extended period of economic growth is often called the "long boom," which began in 1982 and ended with the recession of 2001. During this period of time there was only one recession, which began in July 1990 and ended in March 1991, eight months after the peak. Not only was the 1990-1991 recession short-lived, it was not severe (the unemployment rate peaked in mid 1992 at 7.7%—not particularly high for a recession). In the mid-1980s, during the early part of the Long Boom, the volatility of many major macroeconomic variables declined sharply. This period of reduced volatility, known as the Great Moderation, coincided with the remainder of the Long Boom and even beyond. (See the discussion of the Great Moderation in the section, "Have American Business Cycles Become Less Severe?")
The Great Recession
The long boom was ended by the 2001 recession, which was followed by six years of modest economic growth. Then in December 2007, the economy entered the longest and deepest recession to hit the United States since the Great Depression, a recession that has come to be known as the Great Recession. The Great Recession began with a housing crisis (see "In Touch with Data and Research: The Housing Crisis of 2007 to 2011," in Chapter 7), which was followed by a financial crisis that rivaled that of the Great Depression (see the Application "The Financial Crisis of 2008" in Chapter 14), as numerous financial institutions failed or required government assistance to save them. The unemployment rate rose above 10% for the first time since 1982, and the Federal Reserve reduced interest rates to near zero. The recession ended in June 2009, but in the years following, economic growth was fairly sluggish and the unemployment rate declined at a very slow pace despite the use of expansionary fiscal and monetary policies.
Have American Business Cycles Become Less Severe?
Macroeconomists believed that, over the long sweep of history, business cycles generally have become less severe. Obviously, no recession in the United States since World War II can begin to rival the severity of the Great Depression. Even putting aside the Great Depression, economists generally believed that business downturns before 1929 were longer and deeper than those since 1945. According to the NBER business cycle chronology (Table 8.1), for example, the average contraction before 1929 lasted nearly 21 months and the average expansion lasted slightly more than 25 months. Since 1945, contractions have shortened to an average of 11 months, and expansions have lengthened to an average of more than 50 months, even excluding the lengthy expansion of the 1990s. Standard measures of economic fluctuations, such as real GDP growth and the unemployment rate, also show considerably less volatility since 1945, relative to data available for the pre-1929 era.
Since World War II a major goal of economic policy has been to reduce the size and frequency of recessions. If researchers found—contrary to the generally accepted view—that business cycles had not moderated in the postwar period, serious doubt would be cast on the ability of economic policymakers to achieve this goal. For this reason, although the question of whether the business cycle has moderated over time may seem to be a matter of interest only to economic historians, this issue is of great practical importance.
Thus Christina Romer, who later served as Chair of the Council of Economic Advisers under President Obama, sparked a heated controversy by writing a series of articles in the 1980s denying the claim that the business cycle has moderated over time.[130] Romer's main point concerned the dubious quality of the pre-1929 data. Unlike today, in earlier periods the government didn't collect comprehensive data on economic variables such as GDP. Instead, economic historians, using whatever fragmentary information they could find, have had to estimate historical measures of these variables.
Romer argued that methods used for estimating historical data typically overstated the size of earlier cyclical fluctuations. For example, widely accepted estimates of pre-1929 GNP[131] were based on estimates of just the goods-producing sectors of the economy, which are volatile, while ignoring less-volatile sectors such as wholesale and retail distribution, transportation, and services. As a result, the volatility of GNP was overstated. Measured properly, GNP varied substantially less over time than the widely accepted statistics showed. Romer 's arguments sparked additional research, though none proved decisively whether volatility truly declined after 1929. Nonetheless, the debate served the useful purpose of forcing a careful reexamination of the historical data.
Follow-on research showed that economic volatility declined in the mid 1980s and remained low until the financial crisis of 2008. Because the quality of the data is not an issue for the period following World War II, the decline in volatility in the mid 1980s, relative to the preceding forty years, probably reflects a genuine change in economic volatility rather than a change in how economic data are produced.
Other economic variables, including inflation, residential investment, output of durable goods, and output of structures, also appear to fluctuate less in the past 30 years than they did in the preceding 40 years. Research by James Stock of Harvard University and Mark Watson of Princeton University6 shows that the volatility, as measured by the standard deviation of a variable, declined by 20% to 40% for many of the 21 variables they examine, including a decline of 33% for real GDP, 27% for employment, and 50% for inflation. Because the decline in volatility of macroeconomic variables has been so widespread, economists have dubbed this episode "the Great Moderation."7
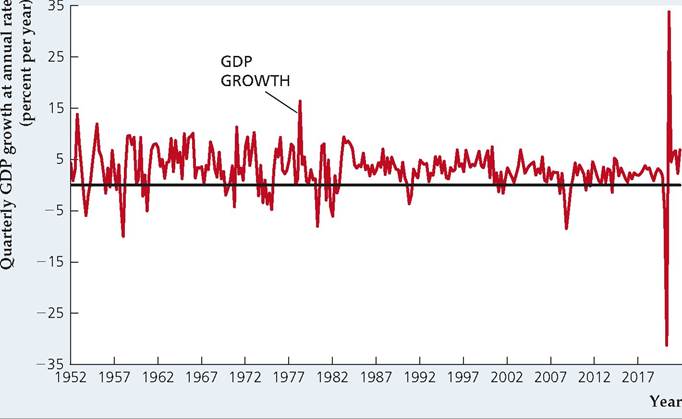
To see what we mean by the Great Moderation, let's begin by looking at real GDP growth since 1952. In Figure 8.2, we have plotted the quarterly growth rate of real GDP (seasonally adjusted at an annual rate). You can see that from 1952 until about 1984, the growth rate changes significantly from quarter to quarter, but after 1984 it seems considerably more stable. In the Great Recession (2007-2009), the growth rate became more volatile but subsequently became very stable until the COVID recession of 2020.
Another graphical device that will help us to see the Great Moderation is a plot of the standard deviation of quarterly growth. The standard deviation of a variable is a measure of its volatility. Because we think the volatility has changed over time, we are going to calculate the standard deviation over five-year periods. The result is shown in Figure 8.3, where we plot the five-year standard deviations
FIGURE 8.2
GDP growth, 1952Q1-2021Q4
The chart shows the annualized quarterly growth rate of seasonally adjusted real GDP since the first quarter of 1952. The growth rate is more volatile before 1984 than after 1984.
Source: Authors' calculations from data on real GDP from Bureau of Economic Analysis, downloaded from the Federal Reserve Bank of St. Louis FRED database, fred.stlouisfed.org/series/GDPCl.
[1]"Has the Business Cycle Changed and Why?" NBER Macroeconomics Annual 2002 (Cambridge, MA: MIT Press, 2002), pp. 159-218.
[1]See Ben S. Bernanke, "The Great Moderation." Speech at the Eastern Economic Association meetings, February 20, 2004, available at www.federalreserve.gov/boarddocs/speeches/2004/20040220/default.htm.
FIGURE 8.3
Volatility of GDP, consumption, and investment, 1952Q1-2021Q4
The chart shows the standard deviation of the quarterly growth rate of GDP, consumption, and investment, over five-year periods, from the first quarter of 1952 to the fourth quarter of 2021. The five-year standard deviation fell sharply in about 1984, but rose during the recession that began in 2007 and increased dramatically in the COVID recession in 2020.
Source: Authors' calculations from data on real GDP from Bureau of Economic Analysis, downloaded from the Federal Reserve Bank of St. Louis FRED database, fred.stlouisfed.org/ series GDPC1, PCECC96, and GPDIC1. The shaded vertical bars indicate times of recessions.
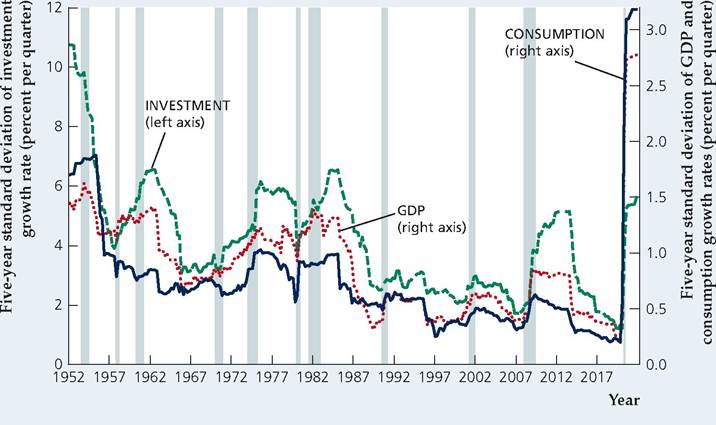
of GDP, consumption, and investment. Note that each point shown on the graph represents the standard deviation of growth of that variable for the preceding five years. The graph shows a sharp decline in about 1984 in the five-year standard deviations of all three variables.
Somewhat surprisingly, the reduction in volatility seemed to come from a sudden, one-time drop rather than a gradual decline. The break seems to have come around 1984 for many economic variables, though for some variables the break occurred much later.
What accounts for this reduction in the volatility of the economy? Stock and Watson found that better monetary policy is responsible for about 20% to 30% of the reduction in output volatility, with reduced shocks to the economy's productivity accounting for about 15% and reduced shocks to food and commodity prices accounting for another 15%. The remainder is attributable to some unknown form of good luck in terms of smaller shocks to the economy.[132]
Of course, economic volatility returned with a vengeance during the Great Recession of 2007-2009, as output and employment plunged. Indeed, some blamed the Great Recession in part on the preceding Great Moderation, which may have made investors overly confident and thus inclined to take excessive risks. It appears that the financial crisis and recession represented just a temporary interruption in the Great Moderation. As Fig. 8.3 shows, in 2014 the standard deviations of GDP, consumption, and investment all dropped substantially, and they continued to decline until the COVID recession of 2020.
Application
Do Economic Expansions Die of Old Age?
Do economic expansions "run out of steam” or "die of old age”? That is, does the probability that an expansion will come to an end rise appreciably as an expansion ages, just as people are more likely to die as they reach old age?
Using a technique known as survival analysis, Glenn Rudebusch of the Federal Reserve Bank of San Francisco investigates the probability that an expansion of a given age will end in the next month and relates this probability to the age of the expansion.[133] He examines business cycles before World War II separately from business cycles after World War II. As shown in Figure 8.4, the postwar behavior of this probability differs from its prewar behavior in two important ways. First, an expansion of any given age was more likely to end within a month in the prewar period than in the postwar period; that is, the probabilities shown in Fig. 8.4 are higher in the prewar period than in the postwar period. Second, unlike the prewar expansions, for which the probability of ending within a month increases substantially with age, the postwar expansions show only a slight tendency for older expansions to be more likely than young expansions to end within a month. A prewar economic expansion is like a person: Over a given period of time, the older a person is, the more likely it is that he or she will die. However, postwar expansions look different: Older expansions are no more likely to die over a given period than younger expansions. As Rudebusch notes, "Accordingly, based only on age, an 80-month-old expansion has effectively the same chance of ending as a 40-month-old expansion.”
In conclusion, it appears that the length of an economic expansion is not an indicator that the expansion is nearing its end.
FIGURE 8.4
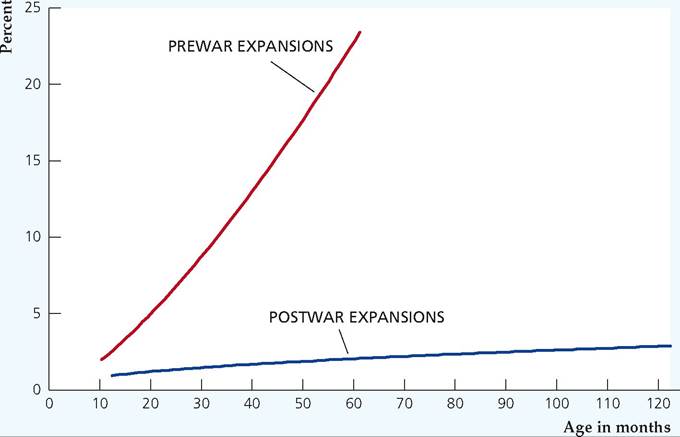
9See Glenn Rudebusch, “Will the Economic Recovery Die of Old Age?” Federal Reserve Bank of San Francisco Economic Letter 2016-03, February 8, 2016.
8.3
More on the topic The American Business Cycle: The Historical Record:
- The American Business Cycle: The Historical Record
- Detailed Contents
- Abel A.B., Bernanke B., Croushore D.. Macroeconomics. 10th Edition, Global Edition. — Pearson,2021. — 690 pp., 2021
- The Conversion Myth
- Pump Priming
- Business Cycle Facts
- The Theory of Income Determination
- Business Cycle Analysis: A Preview
- Hansen’s New World
- The Real Business Cycle Theory