Nerve Conduction Studies
In general, normal standard adult values for conduction velocities are reached by age 3 to 5. In infancy, upper and lower extremity conduction velocities are similar under age 1.
Subsequently, faster conductions are maintained in the upper extremities and comparatively slower conductions in the lower extremities, as with adults. Unique values for expected conduction velocities are observed for specific peripheral nerves.Motor Nerve Conduction
Motor conduction velocities in infants are found to be one-half of adult values. In infants, conduction studies should be at least greater than 20 m/s. At birth, motor conduction velocity (MCVs) for the median, ulnar, and peroneal nerves are 27 m/s. The median nerve may lag in maturation of conduction velocity (CV) relative to the ulnar and peroneal nerves. Ulnar MCV values reach the lower adult range by age 3 (14). The slight difference between ulnar and median MCV values present in the first 3 years of life disappears in children by 4-5 years of age. Careful and consistent measurements are necessary to achieve reliable and valid data. Normative values or selected motor nerve conduction velocities are shown in Table 7.1.
Distal Motor Latency
Distal motor latencies (DMLs) show maturational changes between infancy and 3-5 years of age, similar to motor conduction velocities. Normative data for distal latencies have generally been more incomplete,
7.1
Normal Motor Conduction Velocities (m/sec)
| MEDIAN (REF.) | ULNAR (REF.) | PERONEAL (REF.) | TIBIAL (REF.) | |
| 24-72 hours | 25.8 ± 3.40 (9) | 28.0 ± 3.38 (9) | 26.4 ± 3.58 (9) | 23.9 ± 2.73 (9) |
| 7 days-1 month | 25.43 ± 3.84 (6) | 25.03 ± 2.7 (10) | 22.43 ± 1.22 (6) | 25.30 ± 1.96 (1) |
| 26.17 ± 2.16 (10) | 25.60 ± 3.68 (10) | 23.21 ± 2.79 (10) | ||
| 0-3 months | 32.3 ± 3.56 (9) | 35.1 ± 3.40 (9) | 30.8 ± 2.91 (9) | 27.8 ± 3.89 (2)* 27.9 ± 2.27 (9) |
| 4-6 months | 37.0 ± 4.38 (9) | 40.5 ± 4.24 (9) | 36.1 ± 4.67 (9) | 36.3 ± 4.98 (2)** 34.7 ± 2.92 (9) |
| 1-6 months | 34.35 ± 6.61 (6) | 36.33 ± 3.72 (10) | 35.18 ± 3.96 (6) | 32.55 ± 4.05 (10) |
| 36.35 ± 3.66 (10) | 36.69 ± 4.06 (10) | |||
| 6-12 months | 42.3 ± 6.43 (9) | 47.2 ± 6.33 (9) | 40.8 ± 6.16 (9) | 38.5 ± 5.50 (9) |
| 43.91 ± 3.44 (10) | 45.02 ± 2.93 (10) | 43.11 ± 4.13 (10) | bgcolor=white>39.45 ± 4.29 (10)||
| 1-2 years | 48.23 ± 4.58 (6) | 48.95 ± 2.46 (10) | 51.42 ± 3.02 (6) | 42.6 ± 3.80 (2) |
| 47.81 ± 2.33 (10) | 47.43 ± 2.5 (10) | 42.42 ± 2.23 (10) | ||
| 1-3 years | 52.7 ± 4.70 (9) | 53.8 ± 4.83 (9) | 48.7 ± 4.86 (9) | 44.9 ± 4.44 (9) |
| 2-4 years | 53.59 ± 5.29 (6) | 54.19 ± 3.49 (10) | 55.73 ± 4.45 (6) | 49.8 ± 5.78 (2) |
| 52.71 ± 3.71 (10) | 51.21 ± 3.95 (10) | 44.81 ± 1.91 (10) | ||
| 4-6 years | 56.26 ± 4.61 (6) | 56.9 ± 4.34 (9) | 56.14 ± 4.96 (6) | 50.0 ± 4.26 (2) |
| 55.0 ± 5.20 (9) | 56.51 ± 3.19 (10) | 49.6 ± 4.98 (9) | 48.6 ± 4.25 (9) | |
| 56.48 ± 2.36 (10) | 53.99 ± 3.74 (10) | 48.43 ± 2.53 (10) | ||
| 6-14 years | 57.2 ± 3.71 (9)*** | 58.3 ± 5.76 (9)*** | 49.6 ± 3.40 (9)*** | 48.2 ± 2.76 (9)*** |
| 57.32 ± 3.35 (6) | 57.05 ± 4.54 (6) | 52.4 ± 4.19 (2) ± |
Source: Data are presented as means ± standard deviation.
*1-3 months; **3-6 months; ***7-14 years; ± 6-11 yearswith ranges of distances provided (from stimulation to active electrode). While the stimulation distance should always be recorded in the electrodiagnostic report, the specific distal latency is rarely of critical importance in determining a diagnosis in pediatric electrodiagnosis, as distal peripheral entrapments are relatively uncommon. Rather, reported distal latencies that are either unusually fast or unusually slow in the setting of otherwise normal motor conduction velocities should raise a suspicion regarding technical problems and identification of appropriate wave forms.
The corrected DML may be used as an alternative in young children using the formula of Slomic and colleagues found in Wagner and Buchthal (16):

Where L = actual distance between stimulating cathode to the active recording electrode, and X = standard distance (4 cm for nerves of upper limbs and 5 cm for nerves of the lower limbs. Garcia and colleagues (10) have reported the most complete data to date on corrected DML in children—see Table 7.2). Corrected DML in the neonatal group is increased relative to other age groups, decreases over the first 12 months of life, remains unchanged between 12 months and 24 months, and slightly increases later. As most clinicians reading reports are not familiar with corrected DML, an explanation of the calculation and normative
7.2
Corrected Distal Motor Latency (msec)
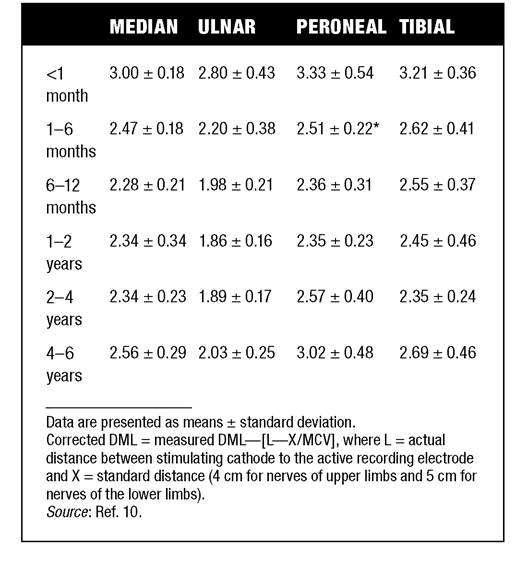
interpretation should be included in the report if this data is reported along with the actual DML and distance used.
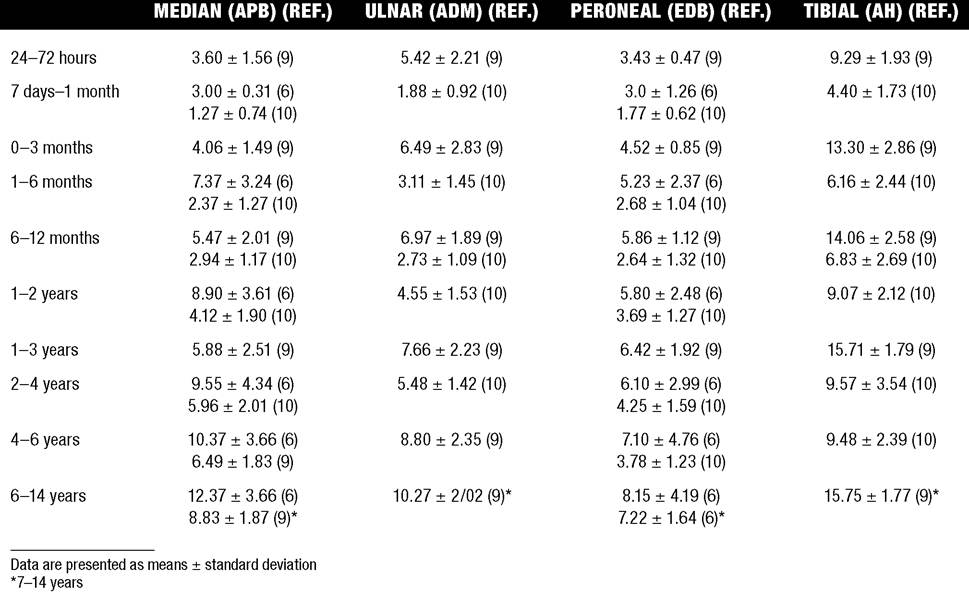
Compound Muscle Action Potential
Compound muscle action potential (CMAP) amplitudes are important to consider in the evaluation of axonal loss, conduction block, and muscle fiber atrophy. CMAP amplitudes of lower extremity nerves are one-half to one-third adult values in infants, and upper extremity CMAPs may be one-third to one-fourth adult values during infancy.
As with motor conduction velocities, CMAP amplitudes increase in size with age, but adult values are generally not reached until the end of the first decade. Normal values for CMAP amplitudes are shown in Table 7.3.Sensory Nerve Conduction
Modern EMG equipment, which includes amplifiers and signal averaging capability, allows sensory nerve action potentials to be routinely recorded in the absence of peripheral nerve pathology. Maturational changes for orthodromic and antidromic sensory conduction are similar to that for motor fibers (6,17,18). In infants and young children, two distinct peaks are often observed in the sensory nerve action potential (SNAP) with proximal stimulation. This two-peak potential has been attributed to differences in maturation between two groups of sensory fibers (16) and often persists until 4-6 years of age. Sensory nerve conduction velocities may be calculated from single distal antidromic or orthodromic stimulations by measuring the distance from stimulation point to active electrode and the distal latency. Normative values for sensory nerve conduction velocities in selected nerves using orthodromic stimulation and proximal recording are shown in Table 7.4. Normal values for orthodromic and antidromic SNAP amplitudes are shown in Table 7.5.
F-waves
The F-wave is a late response that appears as a super- maximal motor nerve stimulation and arises from the discharge of a small number of motor neurons in response to antidromic stimulation of the motor axon. The F-wave latency is measured from hand and foot intrinsic muscles, and is useful for evaluating the motor nerve conduction velocity and proximal nerve segments. In the F-wave, the speed of motor nerve conduction is measured over a long distance, enhances less subject to errors inherent in the calculation of motor conduction velocities over short distances (10 cm or less). F-waves can be recorded from
most limb nerves in newborns and young infants.
The minimum F-latency in normal children recorded from hand muscles, with median or ulnar nerve stimulation at the wrist, is generally less than 20 milliseconds in children younger than 6 years of age (6,7,19). In the lower extremities, the F-wave latency recorded from intrinsic foot muscles, with peroneal or posterior tibial nerve stimulation at the ankle, is generally less than 30 milliseconds (4,6). Normal values for F-wave latencies for children are shown in Table 7.6.H reflex
The H reflex is present in both the upper extremities (median and ulnar) and lower extremities (with posterior tibial stimulation) in infancy. While the tibial H reflex persists into adulthood, the upper extremity H-reflex responses are present in virtually all infants at birth and become suppressed in most children over the course of the first year. Normal values for H-reflex latencies in children are shown in Table 7.7.
Neuromuscular Transmission
The neuromuscular junction shows less stability and reserve in normal newborns. At low rates of stimulation (1-2 Hz), no significant incremental or decremental changes in CMAP amplitude is observed (20). At higher rates of stimulation (5-10 Hz), normal infants may show slight facilitation. Decremental responses averaging 24% have been reported at high rates of stimulation (20 Hz) in normal newborn infants. At 50-Hz stimulation, normal newborns may show decrements on the order of 50% (17). In general, decremental changes of greater than 10% at low rates of stimulation (2-5 Hz) and facilitatory changes of greater than 23% at high rates of stimulation (20-50 Hz) are felt to be significant in the post-term infant (21). Some authors have utilized high rates of stimulation on the order of 50 Hz for ten seconds to document facilitation of greater than 20% to 23% (at times over 100% increments are observed) in infantile botulism (21,22,23).
More on the topic Nerve Conduction Studies:
- Nerve Conduction Studies
- Repetitive Nerve Stimulation Studies
- Volume Conduction
- Recording Electrodes
- TECHNICAL FACTORS OF NEEDLE ELECTROMYOGRAPHY
- Brachial Plexus and Cervical Nerve Root Lesions
- Conduction System Involvement
- Stimulating Electrodes
- Acute Onset Infantile Hypotonia
- Facial Paralysis in the Neonate