Methodology
As discussed above (Sect. 6.2.4), the methodology for this study began with identifying nodes between which we know movement took place. The computer applications described below (Sects.
6.3.1 and 6.3.2) were then used to respectfully calculate and grow potential routeways between these nodes. The proposed routes were then walked and compared against the archaeological and documentary evidence, as well as the existing road network (Sect. 6.3.3). The study therefore combines a range of conventional fieldwork and desk-based research with the possibilities of computer modelling.6.3.1 Least Cost Paths
The natural features which create potential routeways or obstacles in this landscape are characterised by subsoil type more so than slope, so soil was weighted at 75 % and slope was allocated 25 % to produce a Cost Surface. A scale value of one to ten was applied to each soil type, ten being the most difficult to traverse and one the easiest. These values were admittedly subjective, and were arrived at through fieldwork and personal experience (Table 6.1).
Wetland areas are difficult to traverse and were therefore assigned high values, while the glacial sediments represented by eskers, sands and gravels, and till are suitably drained to facilitate ease of movement, and were therefore assigned low values.
ArcGIS Least Cost Paths are anisotropic, or direction dependent. As such, each segment was run in both directions in order to determine the extent of differences associated with direction. It is not unusual to take a different path, depending on direction of travel, as one would attempt to avoid steep slopes, or to maintain a straight course for as long as possible before changing direction. Even in the case of established roads and paths, for instance, where an agent's decisions are based on a limited number of potential paths, it is common for pedestrians to return via a different path from the initial journey.
Table 6.1 Weight applied to subsoils
| Cutover peat—10 | Fen peat—10 |
| Water—10 | Lake sediment—10 |
| Alluvium—8 | Rock—6 |
| Marl—6 | Karstified limestone—6 |
| Made ground—4 | Limestone till—2 |
| Limestone sands and gravels—2 | Sandstone till— 2 |
Basic esker—1
6.3.2 Agent-Based Modelling
The NetLogo world was constructed using the NetLogo GIS extension to import the relevant shapefiles to the model, including soil types and elevation data (Fig. 6.3). This model was similarly run in both directions in order to consider the effect of direction on the evolution of a routeway. The variables explored included the number of agents, or turtles in NetLogo terminology, as well as their release interval and the dimensions of the cones of vision. The turtles are created at one settlement and include a single leader breed while the rest are followers. They leave the settlement at the rate of release controlled by the slider and their task is to reach the target at the opposite settlement. The distance and angle of the cones of vision are controlled by an in-cone reporter, and this limits access to landscape information until they are within visual range of the turtles.
The leader turns its heading to the target and proceeds to navigate through the landscape. Anthropological studies have shown cognitive mapping to be powerful enough to allow for dead reckoning, particularly when there are highly visual landscape features to act as landmarks (Golledge 2003). In the case of the examples in this paper, the targets are next to obvious landmarks in the form of hills and eskers, which act as visual cues to pilot by in the real landscape.
The aim of navigating to a known settlement presupposes a minimum pre-existing cognitive map, which may be constructed from personal experience, third-party knowledge and topographical gossip (Widlock 1997) so it was deemed sufficiently realistic to set the heading from the beginning of the journey in this way. The leader is then instructed to negotiate the landscape using a series of simple commands.Rather than assigning values as is performed in Least Cost Path models, Booleans were used to differentiate between obstacle and not obstacle, with bogs acting
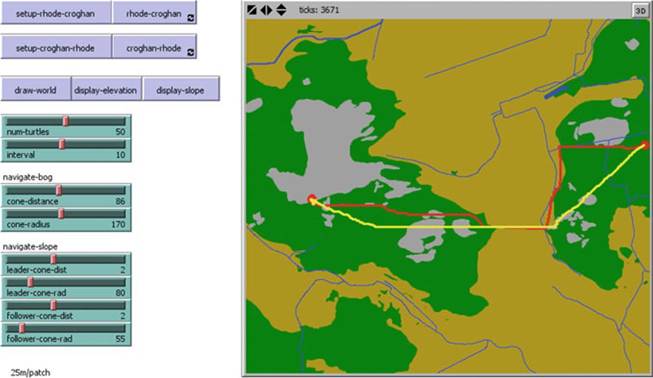
Fig. 6.3 Paths created by NetLogo model of Rhode to Croghan
as obstacles. When a bog is encountered, the turtle is obliged to find a suitable crossing point within the user-defined cone of vision to find dry land within a set distance and radius. A range of variables were tested for each of the parameters. It is possible to see c. 4.8 km over land if unobstructed, but this would be substantially less in a landscape with vegetation, uneven contours etc. It is also an unrealistically long crossing for bogs of the dimensions found in landscape. Within the overall study area, the longest bog crossing suggested by surviving trackways is c. 2.15 km, so an approximation of this distance was used, as it represents the upper limits of an ideal bog crossing and falls well within the potential distance of human vision. The angle of vision has been set at 170°. Values below this were not effective in finding the narrowest point in the bog, while higher values cause the turtles to move in circular motions. With this code and these values, the leading turtle can find the most efficient crossing point within a reasonable distance without having to circle the entire bog.
The leader turtle was also instructed to favour the least slope values within a distance and radius defined by sliders. It was found that the most effective values were to aim for the patch of least slope within two patches (c.
50 m) and 80°. While the process of crossing bogs requires a deviation of path, it is preferable to maintain a straighter course on dry land, calling for a narrower cone of vision. Each time step, or tick, calls the turtle to return their heading to the target before managing slope. This minimises the deviation when making corrections for slope, while representing the attention which a traveler would pay to a landmark while piloting a landscape.All subsequent turtles, known by the follower breed, are released at regular intervals. Iterations with short intervals of release required a higher number of turtles to reach the most efficient solution, while longer release times necessitated less turtles. This is not reflective of reality, but a product of the follow procedure outlined below. Followers have the same capabilities as the leader to solve any obstacles encountered. They have the advantage, however, of having already had the problem solved by the leader, albeit in an inefficient way. Using the same method as the Ant Lines model (Wilensky 1997), each follower turns its heading to its immediate predecessor. The followers retain the ability to manage obstacles on their own and to factor slope into the path selection. This has the effect of smoothing the path over time. Rather than moving directly towards the target and negotiating an obstacle only when it presents itself, turtles later in the sequence aim straight towards the first solution to an obstacle, because they are defining their orientation based on their predecessors’ movements. This cumulative process approaches an efficient path, with the path of the final turtle producing a path which is very similar to the path produced with Least Cost Path analysis.
As is usual with Agent-Based Modelling, different iterations of the model may produce slightly different results when using the same parameters. In order to compare the model to the Least Cost Path results, the path from a single, but representative, iteration each was used per segment and direction. The crucial points for problem solving are the bog crossings, which are always performed almost identically, while variations in other parts of the landscape are minor.
6.3.3 Evaluating the Models
These methods were applied to two segments described in O' Lochlainn’s (1940) itinerary of the Slighe Mor. Potential paths are suggested in both directions from Rhode to Croghan (Figs. 6.3 and 6.4), and Croghan to Kiltober (Figs. 6.6 and 6.7). The paths are then assessed against the archaeological and documentary evidence. Where the digital models correlate with the record, it is good evidence for the existence of a routeway in this location. It also supports the values and parameters which have been used in the Least Cost Paths and Agent-Based Modelling, which demonstrates that the factors considered are important in the decision-making process of individuals negotiating the landscape.
6.4
More on the topic Methodology:
- Methodology
- Methodology
- Weber’s Methodology: Understanding and Ideal Types
- Methodology
- Methodology
- Methodology
- METHODOLOGY
- Methodology
- Epidemiologic Problem Oriented Approach (EPOA) Methodology
- RESEARCH METHODOLOGY
- DATA AND METHODOLOGY