Territory
Spatial size is a basic metric of the scale of empire formation. Attempts to measure the amount of land claimed by imperial powers have a long pedigree: the most comprehensive set of estimates, produced by Rein Taagepera from the 1970s to the 1990s, forms the basis for this section.
With some modifications drawn from more recent scholarship, Table 2.1 summarizes his findings concerning all known empires that are thought to have covered at least one million square kilometers of land.11 Taagepera 1978a, 1978b, 1979, 1997. Table 2.1 is based mostly on Taagepera 1979, 121-122, 125-126, 128-129, 132-133; and 1997, 492-502, with corrections from Cioffi-Revilla, Rogers, Wilcox and Alterman 2011, 103, table 1, for several Inner Asian empires, and from Etemad 2007, 134-187, for modern colonial empires. This list may not be complete (for instance, the Western Zhou Empire in China is another candidate), and some entries with putative areas of 1 million km2 are doubtful borderline cases.
Walter Scheidel, The Scale of Empire In: The Oxford World History of Empire. Edited by: Peter Fibiger Bang, C.A. Bayly,
Walter Scheidel, Oxford University Press (2021). © Oxford University Press. DOI: 10.1093/oso/9780199772360.003.0002.
Table 2.1 Empires That Covered at Least One Million Square Kilometers
Empire World Region Date Area (in million km2)
(1) Traditional empires
| Egypt | Africa | -1300 | 1 |
| Axum | Africa | 350 | 1.25 |
| Fatimid | Africa | 969 | 4.1 |
| Almoravid | Africa | 1120 | 1 |
| Almohad | Africa | 1200 | 2 |
| Mali | Africa | 1380 | 1.1 |
| Mamluk | Africa | 1400 | 2.1 |
| Inca | America | 1527 | 2 |
| Xiongnu | Central Asia | -176 | 4 |
| Xianbei | Central Asia | 200 | 4.5 |
| Rouran | Central Asia | 405 | 4 |
| Goktürk | Central Asia | 557 | 6 |
| Uigur | Central Asia | 800 | 1.5 |
| Tufan (Tibet) | Central Asia | 800 | 4.6 |
| Khazar | Central Asia | 850 | 3 |
| Khorezm | Central Asia | 1210 | 4 |
| Qara Qitai | Central Asia | 1210 | 2.5 |
| Mongol | Central Asia | 1270 | 24 |
| Golden Horde | Central Asia | 1310 | 6 |
| Chagatai | Central Asia | 1350 | 3.5 |
| Timurid | Central Asia | 1405 | 4.4 |
| Zhungar | Central Asia | 1650 | 3.6 |
| East Asia | -1122 | 1.25 | |
| Qin | East Asia | -220 | 2.3 |
| Western Han | East Asia | -50 | 6 |
| Jin | East Asia | 280 | 3.1 |
| Former Qin | East Asia | 376 | |
| Northern Zhou | East Asia | 577 | 1.5 |
| Liang | East Asia | 579 | 1.3 |
| Sui | East Asia | 589 | 3 |
| Tang | East Asia | 715 | 5.4 |
| Liao | East Asia | 947 | 2.6 |
| Northern Song | East Asia | 1000 | 3.1 |
| Jurchen | East Asia | 1126 | 2.3 |
| Ming | East Asia | 1400 | 3.1 |
| Qing | East Asia | 1790 | 14.7 |
| Rome | Europe | 117 | 5 |
| Huns | Europe | 441 | 4 |
| East Roman | Europe | 555 | 2.7 |
| Frankish | Europe | 814 | 1.2 |
| Kiev | Europe | 1000 | 2.1 |
Table 2.1 Continued
| Empire | World Region | Date | Area (in million km2) |
| Byzantine | Europe | 1025 | 1.35 |
| Holy Roman Empire | Europe | 1050 | 1 |
| Lithuania- Poland | Europe | 1480 | 1.1 |
| Ottoman | Europe | 1683 | 5.2 |
| Russia | Europe | 1800 | 15.5 |
| 1895 | 22.8 | ||
| Khmer | SE Asia | 1290 | 1 |
| Maurya | S Asia | -260 | 3.4 |
| Saka | S Asia | 20 | 2.6 |
| Kushan | S Asia | 200 | 2 |
| Gupta | S Asia | 400 | 3.5 |
| Hephthalite | S Asia | 470 | 4 |
| Harsha | S Asia | 648 | 1 |
| Pratihara | S Asia | 860 | 1 |
| Ghurid | S Asia | 1200 | 2 |
| Delhi | S Asia | 1312 | 3.2 |
| Mughal | S Asia | 1690 | 4 |
| Maratha | S Asia | 1760 | 2.5 |
| Assyria | SW Asia | -670 | 1.4 |
| Media | SW Asia | -585 | 2.8 |
| Achaemenid | SW Asia | -500 | 5.5 |
| Macedonian | SW Asia | 323 | 5.2 |
| Seleucid | SW Asia | -301 | 3.9 |
| Bactria | SW Asia | -184 | 2.5 |
| Parthia | SW Asia | 1 | 2.8 |
| Sasanian | SW Asia | 550 | 3.5 |
| Umayyad | SW Asia | 750 | 11.1 |
| Abbasid | SW Asia | 800 | 8.3 |
| Samanid | SW Asia | 928 | 2.85 |
| Buyid | SW Asia | 980 | 1.6 (segmented) |
| Ghaznavid | SW Asia | 1029 | 3.4 |
| Seljuk | SW Asia | 1080 | 3.9 |
| Ayyubid | SW Asia | 1190 | 2 |
| Ilkhanate | SW Asia | 1310 | 3.75 |
| Safavid | SW Asia | 1630 | 2.9 |
| (2) European colonial empires Portugal | Europe | 1760 | 8.5 |
| 1938 | 2.1 | ||
| Spain | Europe | 1640 | 7.1 |
| 1760 | 12.3 |
Continued
Table 2.1 Continued
| Empire | World Region | Date | Area (in million km[232]) |
| Netherlands | Europe | 1938 | 2.1 |
| France | Europe | 1880 | 0.7 |
| 1938 | bgcolor=white>12.1|||
| 1960 | 3.1 | ||
| Britain | Europe | 1760 | 3.5 |
| 1938 | 33.6 | ||
| 1950 | 9.5 | ||
| 1960 | 5 | ||
| (3) Other | |||
| United States (incl. annexed | America | 1900 | 9.67 |
| territories) | 1945 | 9.37 | |
| Soviet Union | Europe | 1950 | 22.3 |
Note: Negative dates are bce.
It goes without saying that the maps from which these totals are derived can be deceptive. They represent empires at a particular point in time, mostly at their maximum spatial reach, whereas the size of their territorial holdings could vary considerably over time (see Figure 2.3 later in this chapter). More importantly, the boundaries of empire are notoriously hard to define (see Chapter 1). Imperial rule was sometimes highly indirect in nature, relying on vassal regimes to manage subordinate populations. On occasion, imperial centers might lose effective control over areas that nominally remained under their authority to local elites or warlords: our tabulation is predicated on the simplifying assumption of formal unity for as long as no overtly independent polities had emerged in the territory of a given empire. Moreover, some of these empires included large stretches of steppe or even desert that were not in any meaningful sense ruled by them. Egypt is a classic example, with a cultivable area of some 20,000 square kilometers in antiquity but often conventionally equated with its modern territory of one million square kilometers, 96 percent of which remain sparsely inhabited or empty even today. The Mongol Empire, spanning as it did the full width of the Eurasian steppe and endowed with supremely ill-defined northern boundaries, is another.2 The figures in Table 2.1 try to take account of a state's capacity to project power over terrain that lacked state-level competitors, even if that terrain could not be steadily controlled. In general, our totals therefore tend to be generous rather than conservative, albeit in a fairly consistent manner.
Overall, anything resembling precision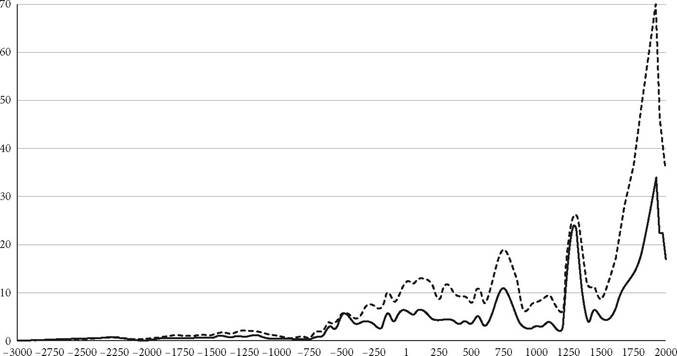
| Largest -----Three largest |
Figure 2.1. The size of the single largest empire and the three largest empires in the world, 3000 bce to 2000 ce (in million km2).
Source: Taagepera 1976a, 116-117, table 2.
often remains beyond our reach. These tallies are simply meant to convey a sense of orders of magnitude.
Their main purpose is to help us understand how the spatial reach of empires changed over time as the largest of them kept growing in size (Figures 2.1 and 2.2). The logarithmic distribution in Figure 2.2 adds much-needed resolution that allows us to distinguish between different phases of imperial growth. Figure 2.1 is nevertheless instructive in documenting just how long it took for more ambitious scaling- up to occur after states had first appeared in the historical record. For about half of the five millennia under review, imperial formations (whether we count them from Old Kingdom Egypt or more conservatively from Sargon's Akkadian Empire) did not expand beyond a few hundred thousand square kilometers, much of which were often not even permanently settled.
A major step-up occurred in the sixth century bce: for the first time, the formation and rapid expansion of an Iran-centered empire established by the Medians and especially the Persian Achaemenid dynasty united previously politically distinct regions such as Mesopotamia, Egypt, Asia Minor, Iran, and the Indus Valley. This process created a fairly durable empire that was almost an order of magnitude larger than anything that had existed before.[233] Just as the Middle East had been the first part of the world to support imperial formations covering hundreds of
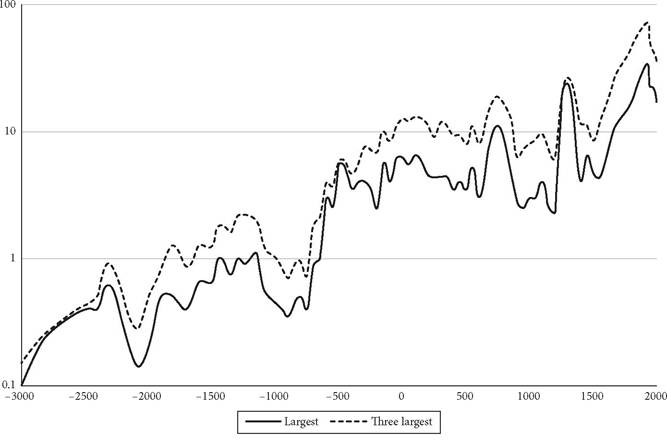
Figure 2.2. The size of the single largest empire and the three largest empires in the world, 3000 bce to 2000 ce (in million km2, logarithmic scale).
Source: Based on the largest empires listed in Table 2.1.
thousands of square kilometers, it also inaugurated the era of empires of several million square kilometers. It may be tempting to explain this leadership role as an outgrowth of advantageous ecological conditions that had long provided a powerful impetus for sedentary agriculture and growing social complexity.[234] Yet macrosocial evolution swiftly converged across much of the temperate core zone of the Old World. Similarly sized empires—Maurya and Qin—appeared in the late fourth and the third centuries bce in South and East Asia. Within a few centuries, the territorial heft of the Achaemenid Empire was matched by that of the Han and Roman empires at opposite ends of the Eurasian land mass. Both of them covered around five or six million square kilometers, or closer to four million if marginal arid lands are excluded. At the height of their power, the Achaemenid as well as the Roman empires spanned four modern time zones.[235]
Figures 2.1 and 2.2 might make it seem as though the Umayyad Caliphate brought another significant step-up, doubling maximum territorial size to about 11 million square kilometers and extending over six time zones instead of four. However, it was the predominantly arid expanses of the Arabian Peninsula that contributed much of these gains. In terms of control over cultivable land, the Caliphate was thus only moderately larger than the Achaemenid Empire had been 1,200 years earlier, adding the Maghreb and the Iberian Peninsula—both of them soon to be lost—but excluding Asia Minor. The accompanying increase in east-west extension likewise proved unsustainable. From this perspective, we may conclude that an effective ceiling in the mid-single-digit million square kilometers remained in place until the Mongol expansion set new standards. At its peak in the late thirteenth century, Kublai Khan's realm nominally covered (at least) 24 million square kilometers and traversed nine modern time zones.
Similar in surface area to Russia before World War I and second only to the mature British Empire, it remains the largest Afroeurasian Empire in history. Once again, sparsely inhabited steppe areas accounted for much of this step-up, and growing segmentation even before the death of Kublai Khan in 1294 quickly eroded territorial integrity.Some of these unprecedented successes were later replicated by the Manchu, who came to control what had been the eastern reaches of the Mongol domain, a territory perhaps approaching 15 million square kilometers around 1800 if peripheral stretches of steppe and taiga are included. By then Russia had attained a similar size, thanks mainly to expansion across Siberia. From the sixteenth century onward, the Spanish overseas empire had been the largest of the European colonial empires: in 1800, its territorial spread was comparable to that of Qing China and Russia. By the early twentieth century, the British Empire finally surpassed all of them, eventually covering some 35 million square kilometers. The French colonial possessions by contrast never amounted to more than a third of the British possessions, much of them African desert.
Globally, imperial territorial concentration peaked prior to World War II when the five largest powers (the British Empire, the Soviet Union, the French Empire, the United States, and Nationalist China) claimed 88 million square kilometers, fully two-thirds of the earth's land mass excluding Antarctica. Since then, the maximum size of empire has steadily dropped, from 35 million square kilometers for the prewar British Empire to 22 million for the postwar Soviet Union and currently 17 million for the Russian Federation (inasmuch as the latter even belongs in this category).
Territorial growth of the largest empire in the world was generally accompanied by corresponding growth among the runners-up. Although the formation of the Achaemenid Empire temporarily created a monopolistic super-state that was vastly larger than any competitors, other parts of the Old World followed suit within a few centuries: as Figure 2.1 shows, from the last few centuries of the first millennium âńĺ onward the combined size of the second and third largest empires matched or exceeded that of the top-ranked one, a pattern that was only very briefly interrupted by the nominally united Mongol Empire of the late thirteenth century which crowded out serious competitors. This parallel development subsequently continued into the twentieth century, as the explosive geographical growth of the British Empire was matched by that of Russia and the French colonies.
As already noted, the secular expansion of empire was not a linear process. Figure 2.1 highlights sharp discontinuities with respect to both “floors” and “ceilings” (that is, the lower and upper limits of the size of the largest empires). Major step-ups took place in the sixth century bce and (after an abortive Mongol spurt in the thirteenth century) again in the seventeenth century. This was true for the single largest as well as for the three largest empires in the world at any given time. In addition to raising territorial reach to new heights, the first of these shifts also established a new “floor”: from that point onward, the largest empire in the world would never again claim fewer than 2.5 million square kilometers, well in excess of the “ceiling” for the largest empires prior to the sixth century bce.[236]
The organizational and technological changes behind this fundamental shift still await systematic analysis. This period witnessed a concatenation of developments, including enhanced military capacity of steppe populations and more generally the growing importance of cavalry, rising urbanization levels, and the emergence of major “Axial Age” religions, all of which arguably interacted in promoting macro-social scaling-up.[237] Even though several of the leading empires of the time did not critically rely on “horse power” (while war chariots and elephants played a major role in Mauryan expansion, Qin and Rome primarily relied on mass mobilization of heavy infantry), it was crucial in creating steppe empires in the multimillion square kilometer range.[238]
Around the world, substantial expansion beyond the “ceiling” of five to six million square kilometers that had already been reached 2,500 years ago was made possible only by the incorporation of ecologically marginal zones. Pioneered by the Umayyads and the Mongols, this strategy did not become sustainable in the long term until the seventeenth century, when it was successfully employed by the Manchu Qing and especially by Russia. The step-up that can be observed in that century was in large measure a function of technological progress (in weapons technology and logistics) and correspondingly widening disparities between conquerors and the inhabitants of sparsely settled arid or forested areas. Much the same was true of the European colonial empires, first of Spain (albeit to a comparatively modest extent, in the North American Southwest and in the southern cone of South America) and then much more massively of the British Empire (in Canada, Australia, and Africa) and the French colonies (in Africa). Later still, the Soviet Union was built in the first instance around a developed core of not more
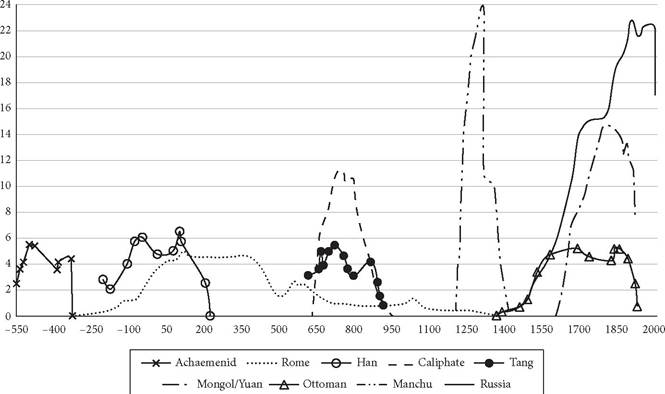
Figure 2.3. Largest empires of the Old World, 550 bce to 2000 ce (in million km2). Source: Taagepera 1978a, 1978b, 1979, 1997.
than six million square kilometers in Europe and east of the Urals, broadly similar in size to the more densely populated parts of the United States and China. Cores of this size were not substantially different from the settled areas of close to four million square kilometers in the ancient Roman and Han empires 2,000 years ago. This continuity points to the presence of a long-term constraint on effective empire growth that could only be overcome by massively expanding into marginal and peripheral regions.
Figure 2.3 tracks the evolution of the largest traditional empires over time.[239] The principal Old World empires were capable of surviving at or near peak size for extended periods of time: for about four centuries in the case of the Han, Roman, and Ottoman empires, and for about three centuries in the case of the Tang and Qing empires and most recently Russia. By contrast, the Umayyad Caliphate and especially the Mongol empires proved to be more fragile formations that were prone to fission. This was generally true of steppe-based empires.[240]
It was only fairly recently, in the modern era, that global colonial empires set up by European powers in a centrifugal process of expansion away from their shared European core came to match or surpass the ceilings established by contiguous Old World empires (Figures 2.4-2.5).
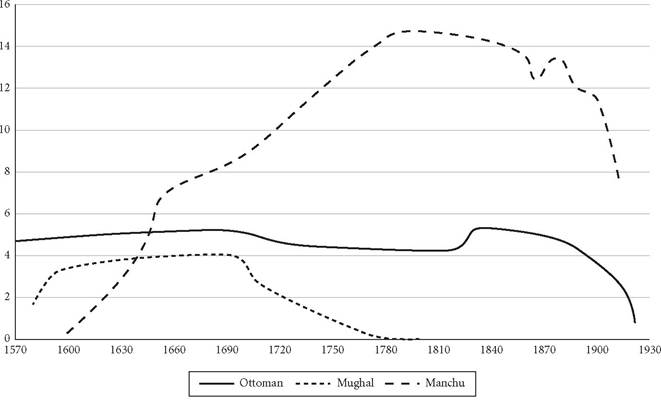
Figure 2.4. Largest Asian empires, 1570-1930 (in million km2).
Source: Taagepera 1997:498-500.
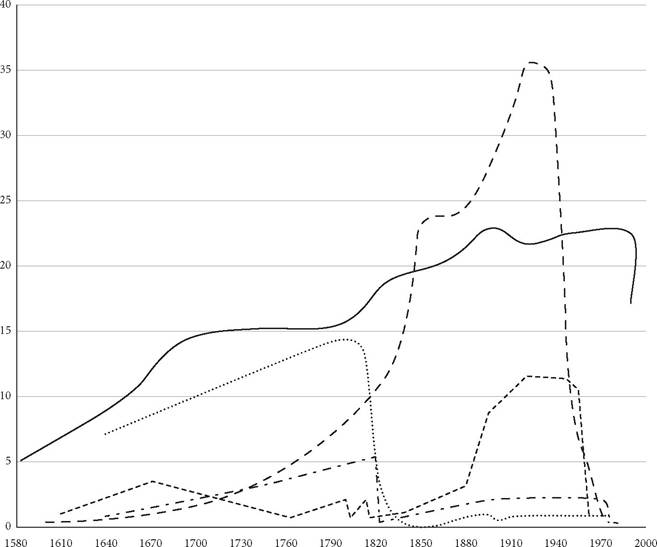
| Russia Spain — — - Britain France — - — Portugal
Figure 2.5. Largest Eurocentric empires, 1580-2000 (in million km2). Source: Taagepera 1997:498-502.
Population
Territory is not the only key measure of imperial scale. In fact, the growing importance of marginal land in boosting the spatial size of more recent historical empires suggests that surface area per se may not be the most meaningful indicator of imperial expansion. Population size is the main alternative (Figure 2.6).[241]
Even allowing for considerable margins of error, we observe a secular increase from empires of just a few million subjects, such as the Neo-Assyrian Empire of the seventh century bce, to empires in excess of 10 million, beginning with the Achaemenid and Maurya formations. In the following centuries, the Roman, Han, and Tang empires laid claim to populations in the mid-tens of millions. The spatially more extensive Umayyad Caliphate, by contrast, lagged behind these early behemoths. The 100-million barrier was first breached by the Northern Song in eleventh-century ce China. Empire on this scale remained the preserve of East Asia (including the Mongol domain at its peak) until the Mughals passed this threshold in the seventeenth century, followed by the British and Russian empires in the nineteenth centuries and the French colonial empire in the early twentieth century. In the second quarter of the twentieth century, the British Empire temporarily rivaled
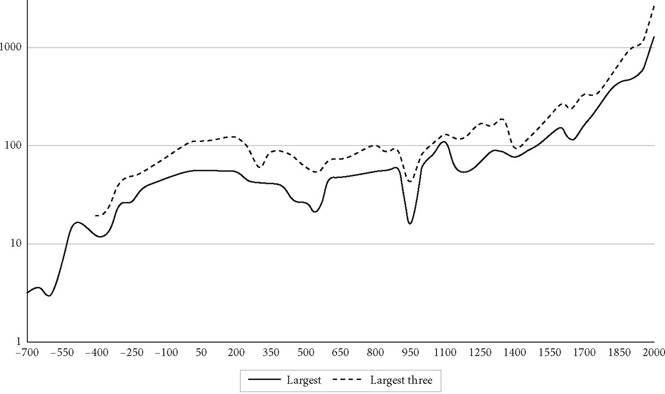
Figure 2.6. The population of the single largest empire and the three largest empires in the world, 700 bce to 2000 ce (in millions; logarithmic scale).
Source: Based on Table 2.1, McEvedy and Jones 1978 and standard historical mapping resources.
id="Picutre 17" class="lazyload" data-src="/files/uch_group78/uch_pgroup313/uch_uch7322/image/image017.jpg">
Figure 2.7. The population of the single largest empire and three largest empires in the world as a proportion of world population, 700 bce to 2000 ce (in percent).
Source: Based on Table 2.1, McEvedy and Jones 1978 and standard historical mapping resources.
China's demographic weight. World War II very briefly pushed the population under Japanese control to a level similar to that of the British Empire, of roughly half a billion each, while China's standing declined due to partial foreign occupation, slipping below that of Nazi Germany at its equally short-lived peak in the early 1940s.
However, considering the enormous growth of the overall world population, from perhaps 200 to 300 million at the beginning of the Common Era to two and a half billion at the time of World War II, change in absolute population number is only part of the story.[242] In order to control for ongoing global demographic expansion, we need to consider instead the share of the world population that was claimed by the largest empires at a given point in time (Figure 2.7).
Figure 2.7 reveals a striking profile. The relative demographic size of the three largest empires in the world was never again as massive as it was in the later stages of antiquity when the Roman, Kushan, and Han empires exercised some measure of control over as many as two-thirds of all people on earth. This extreme degree of imperial consolidation was facilitated by the concentration of much of our species in the temperate core zone of Afroeurasia that sustained large-scale state formation and lent disproportionate demographic weight to the resultant imperial structures. In this respect, the world population has not been similarly politically concentrated ever since. In 1900, China, the British Empire, and Russia accounted for perhaps 60 percent of the global population, and the three demographically largest powers of World War II around 1942—Britain, Japan, and Germany—for somewhat less than that.
Geographical and temporal differences in demographic scale become clearer when we rank the most populous empires in history relative to world population (Table 2.2).13
Table 2.2 Empires That Claimed at Least 8 Percent of the World Population (in Percent)
| Empire | World Region | Date | Share |
| Qing | East Asia | 1800 | 37 |
| Northern Song | East Asia | 1100 | 33 |
| Western Han | East Asia | 1 | 32 |
| Mongol | Central Asia | 1290 | 31 |
| Roman | Europe | 150 | 30 |
| Jin | East Asia | 280 | 28 |
| Ming | East Asia | 1600 | 28 |
| Qin | East Asia | -220 | 24 |
| Mughal | South Asia | 1700 | 24 |
| Tang | East Asia | 900 | 23 |
| Delhi | South Asia | 1350 | 23 |
| British | Europe | 1938 | 23 |
| Japan | East Asia | 1943 | 20 |
| Maurya | South Asia | -250 | 19 |
| Former Qin | East Asia | 376 | 19 |
| Northern Zhou | East Asia | 580 | 16 |
| Macedonian | Southwest Asia | -323 | 15 |
| Harsha | South Asia | 647 | 15 |
| Gupta | South Asia | 450 | 13 |
| Northern Wei | East Asia | 500 | 13 |
| Umayyad | Southwest Asia | 750 | 13 |
| Achaemenid | Southwest Asia | -450 | 12 |
| Former Yan | East Asia | 366 | 12 |
| Jurchen | East Asia | 1200 | 12 |
| Germany | Europe | 1943 | 12 |
| Kushan | South Asia | 200 | 11 |
| Pala | South Asia | 800 | 11 |
| Later Zhao | East Asia | 330 | 10 |
| Hepththalite | South Asia | 500 | 9 |
| Sasanian | Southwest Asia | 626 | 9 |
| Maratha | South Asia | 1750 | 9 |
| USSR | Europe | 1940 | 9 |
| Nanda | South Asia | -325 | 8 |
| Seleucid | Southwest Asia | -280 | 8 |
| Pratihara | South Asia | 900 | 8 |
| Ghurid | South Asia | 1200 | 8 |
| France | Europe | 1812 | 8 |
13 As Figure 2.6, with conservative corrections for the persistent underestimating of ancient population number (from 200 bce to 600 ce) in McEvedy and Jones 1978.
I chose a cutoff point of 8 percent in order to arrive at a sample of roughly similar size to that for territory in Table 2.1, and also because the underlying estimates inspire greater confidence than those for smaller entities, as regionally specific uncertainties tend to cancel each other out. Even so, it must be stressed that most of the numbers are merely rough approximations, best interpreted as the center values of wider ranges (of, say, plus or minus one or two percentage points), especially for the more distant past. At the same time, they are unlikely to be consistently wide of the mark and therefore offer at least a sense of relative magnitude and broad patterns.
Whatever the quality of the data, the demographic preeminence of East Asia cannot be in doubt. Seven of the eight largest empires were based in China, including (demographically speaking) the Mongol Empire. The next-largest imperial polities were created in South Asia during the period of Islamic conquests. More recently, the British and the (extremely short-lived) Japanese colonial empires likewise relied on South Asia and East Asia, respectively, in order to attain high scores in this survey. In this context, the Roman Empire, the highest-ranked European empire by a wide margin, represents a genuine outlier.
Consideration of the demographic evolution of empire in different parts of the Old World throws this particular anomaly and more general systematic intracontinental differences into sharp relief (Figures 2.8-2.11).[243]
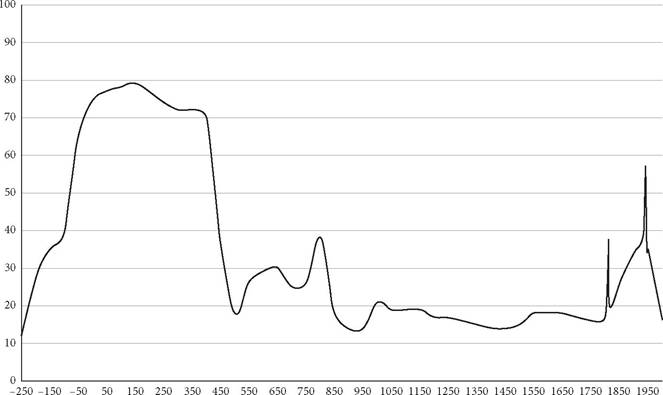
Figure 2.8. The proportion of the population of Europe claimed by the largest polity in that area, 250 bce to 2000 ce (in percent).
Source: Scheidel 2019, 37.
Key: Roman Empire: 250, 200, 150, 100, 50 BCE, 1, 50, 100, 150, 200, 250, 300, 350, 400 CE; Western Roman Empire: 450; Ostrogothic kingdom/Visigothic kingdom: 500; Byzantine Empire (Frankish Empire): 550; Frankish Empire: 600, 650, 700, 750, 800, 850; Frankish Empire: 900, 950; Holy Roman Empire: 1000, 1050, 1100, 1150, 1200, 1250; France: 1300, 1350, 1400, 1450, 1500; Spanish Habsburg Empire: 1550, 1600; France: 1650, 1700, 1750, 1800, 1812; Russia: 1815, 1850, 1900, 1933; Germany: 1943; Russia: 1945, 1950, 2000. In 1933, 1945, 1950: Russia = USSR.
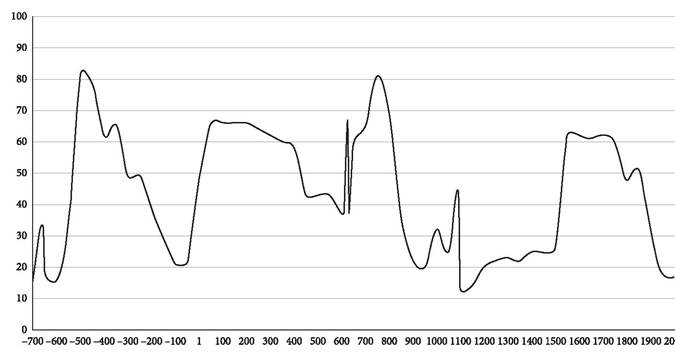
Figure 2.9. The proportion of the population of the Middle East and North Africa claimed by the largest polity in that area, 700 bce to 2000 ce (in percent).
Source: Scheidel 2019, 39.
Key: Assyrian Empire: 700, 665, 650 BCE; Egypt: 600 BCE; Median Empire: 550 BCE; Achaemenid
Empire: 500, 450, 400, 350 BCE; Seleucid Empire: 300, 250, 200, 150 BCE; Parthian Empire: 100 BCE; Roman Empire: 50 BCE, 1, 50, 100, 150, 200, 250, 300, 350, 400, 450, 500, 550, 600, 610 CE; Sasanian Empire: 626; Roman Empire: 630; Umayyad Empire: 650, 700, 750, 800, 850; Tulunid Empire: 900; Roman Empire: 950;
Fatimid Empire: 1000, 1050; Seljuk Empire: 1092; Fatimid Empire: 1100; Fatimid Empire (Rum Seljuk Empire): 1150; Ayyubid Empire: 1200; Mamluk Empire (Mongol Empire): 1250; Mamluk Empire (Ilkhanid Empire): 1300; Mamluk Empire: 1350; Mamluk Empire (Timurid Empire): 1400; Mamluk Empire: 1450, 1500; Ottoman Empire: 1550, 1600, 1650, 1700, 1750, 1800, 1850, 1900; Egypt: 1950, 2000.
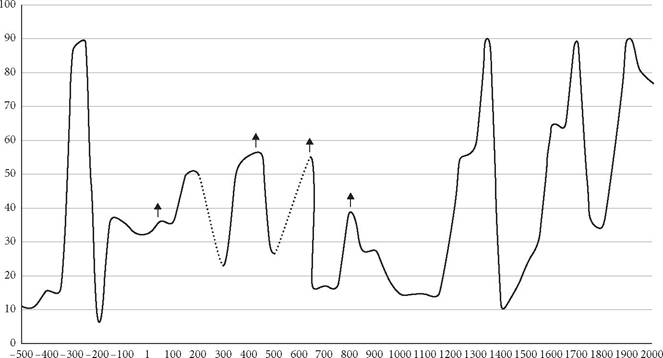
Figure 2.10. The proportion of the population of South Asia claimed by the largest polity in that area, 500 bce to 2000 ce (in percent).
Source: Scheidel 2019, 40.
Key: Maghada: 500, 450, 400, 350 BCE; Nanda Empire: 325 BCE; Maurya Empire: 300, 250 BCE; Satavahara: 200 BCE; Shunga Empire: 150, 100 BCE; Saka Empire: 50 BCE, 1 CE; Kushan Empire: 50, 100, 150, 200; Gupta Empire: 300, 350, 400, 450; Gupta Empire/Hephthalites 500; Harsha Empire: 647; Chalukya of Badami Empire: 650, 700, 750; Pala Empire: 800; Pratihara Empire: 850, 900; Rashtrakuta Empire: 950; Chola Empire: 1000, 1050; Chola Empire (Western Chalukya Empire): 1100; Chola Empire: 1150; Ghurid Sultanate: 1200; Sultanate of Delhi: 1236, 1250, 1300, 1350; Vijayanagara Empire (Bahmani Sultanate): 1400; Vijayanagara: 1450; Sultanate of Delhi: 1500; Mughal Empire: 1550, 1600, 1650, 1700; Maratha Empire: 1750; British Empire: 1800, 1850, 1900; India: 1950, 2000. Dashed line: no entries for 250, 550, 600. The upward arrows indicate probable undercount due to the need to disaggregate historical population numbers within India based on more recent census data: see Scheidel 2019, 534-535.
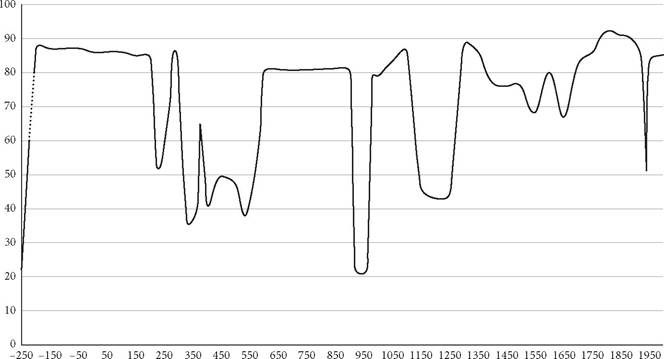
Figure 2.11. The proportion of the population of East Asia claimed by the largest polity in that area, 250 bce to 2000 ce.
Source: Scheidel 2019, 41.
Key: Qin: 250 BCE; Western Han: 200, 150, 100, 50 BCE, 1 CE; Eastern Han: 50, 100, 150, 200; Northern Wei: 225; Jin: 265, 280, 290; Liu Han: 330; Former Yan: 366; Former Qin: 376; Eastern Jin: 400; Liu Song: 440; Northern Wei: 500; Liang: 535; Northern Zhou: 580; Sui: 590, 600; Tang: 650, 700, 750, 800, 850, 900; Later Liang: 920; Northern Song: 960, 980, 1000, 1050, 1100; Southern Song: 1150, 1200, 1250; Yuan: 1300, 1350; Ming: 1400, 1450, 1500, 1550, 1600; Qing: 1650, 1700, 1750, 1800, 1850, 1900; China: 1933; Japan: 1943; China: 1950, 2000.
The default pattern is one of monopolistic or near-monopolistic empire alternating with interstitial periods characterized by greater political polycentrism. Thanks to the resilience of universal empire in China, East Asia experienced evershrinking intervals between very large formations and an exceptional degree of imperial dominance, especially from the sixth century ce onward. The Middle East and North Africa produced a more balanced sequence of fairly dominant empires interspersed with considerable fragmentation. Much the same applies to South Asia, whose largest empires often proved comparatively fragile. Smaller regions such as Southeast Asia, Mexico, and the Andes, not shown here, likewise tend to conform to variants of this oscillation pattern, albeit on a shorter overall time scale. The same is true of Africa's Sahel-Sudan belt.
European state formation famously constitutes an outlier: one-off quasi- monopolistic empire under Rome gave way to an entire millennium between Charlemagne and Napoleon when no single power ever managed to control more than one-fifth of the continent's population. While the rise of Russia gradually raised this ceiling, more aggressive attempts at empire-building under Napoleon and Hitler remained short-lived. The proximate and ultimate causes of European exceptionalism continue to be debated.[244]
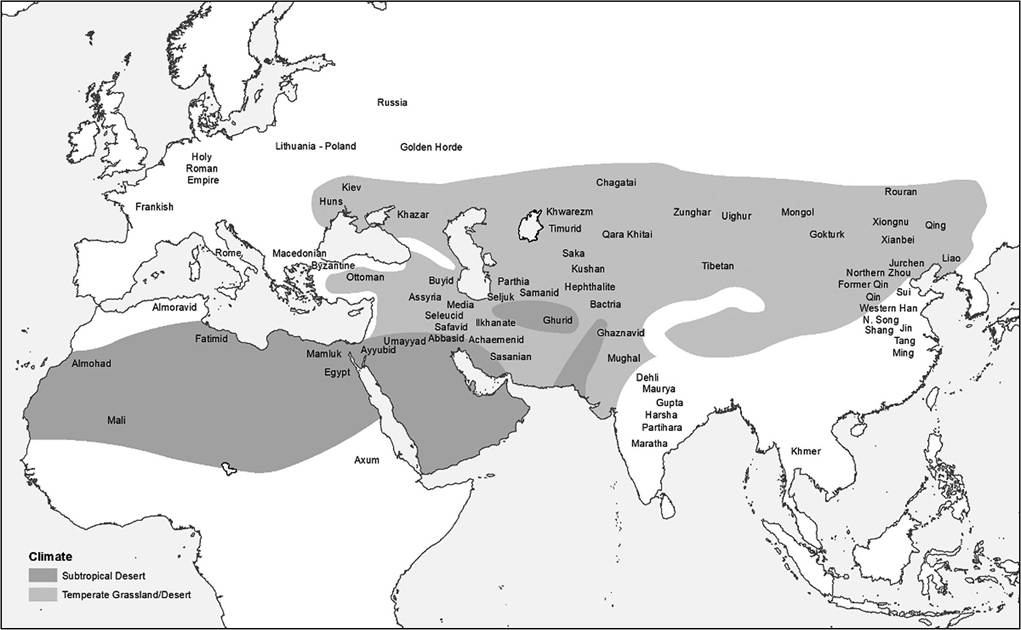
Figure 2.12. Spatial distribution of the core areas of empires of at least 1 million km2 in Afroeurasia. Source: Scheidel 2019, 273 (adapted from Turchin 2009, 204 fig.1)
THE SCALE OF EMPIRE 107
More on the topic Territory:
- Territory and geography
- CHAPTER 5 TERRITORY OF HETMAN UKRAINE
- History and Territory
- The Territory of Ukraine and Its History
- The Territory Resists the Map
- Governmentality in Indian Territory
- Writing History: People or Territory?
- 2 The Scale of Empire Territory, Population, Distribution
- Lordship, Community, and Territory, and the Making of the Delhi Sultanate
- Sentencing Statistics, Sentencing Councils and the Quest for Data in the Australian Capital Territory
- The history of Ukraine as a territory, not unlike that of many other places, countries, and peoples, has its origins in the kind of historical writing that would probably be characterized today as global or transnational history.
- 1 Ukraine’s Geographic and Elhnolinguislic Setting
- Sovereignty and jurisdiction
- Conclusion