Vehicular Pollution in Delhi
The transportation demand in all urban areas continues to rise because of growth in population as well as the changes in the travel patterns.
There is an increasing trend towards ownership and utilization of private and personal motor vehicles for commuting in many cities including Delhi, the reason being the lack of an efficient and convenient public transport system.
The more the number of vehicles on the roads, the more would be the congestion and the more would be the air pollution. The increase in number of vehicles results in the consumption of more fuel and is not economic also. The congestion on roads is further increased by a variety of vehicles plying on the roads. These include from bullock carts to cycle rickshaws to cars and buses as well as commercial goods vehicles.In Delhi, the pollution had increased to an alarming level in the last decade because of the expanding population and increased economic activities. There are many industrial units in and around the city. In addition, there are many office complexes, educational institutes, private companies, busy markets and shopping complexes. Many people land in Delhi in search of better educational, vocational and health facilities and never go back to their home towns.
This trend is visible in population statistics of the city. In 1991, the population ofDelhi was 91.21 lakhs which increased to about 132 lakhs in the year 2001. In 1951, the number of industrial units was just about 8,000 which increased to more than 1,25,000 in 1991. Similar growth was registered in the number of vehicles also. In 1975, Delhi and Mumbai had almost equal number of vehicles. But presently, the number of vehicles plying in Delhi is three times more than those in Mumbai. The actual number of vehicles being 2.35 lakhs in 1975 and 26.29 lakhs in 1996. This number is expected to reach 60 lakhs in 2011.
As far as the pollution scenario is concerned, 67% of the total air pollution is due to vehicles and it amounts to roughly 3000 MT per day. The industries and coal based thermal power plants contribute about 25% to the air pollution. The fly ash generated by the three power plants is 6000 MT per day. The industries generate an effluent load of 320 mid. The river Yamuna receives about 1900 mid of municipal sewage and waste water through the 16 drains. The municipal solid waste generated in Delhi amounts to 5000 MT per day.
Table 15.2 shows the contribution of various sources of pollution to the ambient air quality.
Table 15.2 Contribution of various sources of pollution
| Source | 1970-71 | 1980-81 | 1990-91 | 2000-01 |
| Industrial | 56% | 40% | 29% | 20% |
| Vehicular | 23% | 42% | 64% | 72% |
| Domestic | 21% | 18% | 7% | 8% |
The above table shows that the contribution of vehicular pollution is major source of air pollution. Table 15.3 shows the vehicular emission load for various pollutants for the last decade.
Table 15.3 Vehicular emission load of different pollutants
| Pollutant | Pollution Load (in thousand tonnes) | Percentage | ||
| 1990-91 | 1995-96 | 1998-99 | (%) reduction as compared to 1995-96 | |
| Sulphur dioxide | 10 | 15 | 11 | 27 |
| Nitrogen dioxide | 139 | 207 | 182 | 12 |
| Particulate Matter | 19 | 28 | 21 | 25 |
| Lead | 0.190 | 0.362 | 0.007 | 97 |
| Carbon Monoxide | 243 | 351 | 337 | 4 |
| Hydrocarbons | 0.83 | 113 | 115 | 2 |
| Total Pollution Load | 493 | 714 | 666 | - |
| Emission Load in Tonnes/day | 1351 | 1947 | 1825 | 11 |
The vehicular pollutants have harmful effctts on the human health and the environment.
They directly affect the respiratory and cardiovascular systems especially high levels of sulphur dioxide and suspended particulate matter lead to increased mortality, morbidity and impaired pulmonary function. The specific effects associated with these pollutants are as follows:(1) Sulphur dioxide adversely affects the functioning of lungs,
(2) Nitrogen oxides increase the susceptibility to infections, pulmonary diseases and cause impairment of lung function and eyes. They also lead to irritation in nose and throat.
(3) The particulate matter may be toxic itself or can carry toxic substances. They can alter the immune system. The fine particulate matter penetrates deep into the respiratory system and cause irritation of lung tissues which lead to long term disorders.
(4) Lead causes impairment of kidney and liver. In children, it may cause damage of brain which may result in lower IQ, reduced ability for concentrating or hyperactivity.
(5) Benzene is a well-known carcinogen. Its exposure leads to leukemia.
(6) Carbon monoxide affects the cardiovascular system and the nervous system. When the nervous system doesn’t work properly, it results in impairment of physical coordination, vision and judgment. Carbon monoxide can also cause nausea and headaches, reduce productivity and increase discomfort.
The type of vehicles plying on Delhi roads is given in Table 15.4.
Table 15.4 Number (in lakhs) and types of vehicles in Delhi
| S.No. | Category | 31.03.85 | 31.03.90 | 31.03.95 | 31.03.96 |
| 1. | Car/ Jeep/ Station wagon (Petrol-driven) | 1.57 | 3.45 | 5.75 | 6 |
| 2. | Scooter / Motorcycle (Petrol-driven) | 5.79 | 11.13 | 16.17 | 17 |
| 3. | 3-Wheeler (Petrol-driven) | 0.30 | 0.59 | 0.75 | 0 |
| 4. | Taxi (Mostly Diesel) | 0.08 | 0.09 | 0.12 | 0 |
| 5. | Buses (Diesel-driven) | 0.14 | 0.18 | 0.26 | 0 |
| 6. | Goods Vehicles (Diesel-driven) | 0.52 | 0.92 | 1.20 | 1 |
| Total | 8.40 | 16.36 | 24.25 | 26 |
The number of two wheelers is about two-thirds of the total number of vehicles.
They emit 20-40% unbumt or partially burnt fuel because of drawbacks in the design of their two-stroke engine. The two wheelers are responsible for more than 70% of hydrocarbons and about 50% of carbon monoxide in Delhi.There are about 80,000 three wheelers. These are also powered by two- stroke engines. They also emit large amounts of carbon monoxide and hydrocarbons, some times beyond the measuring capacity of the instrument. Sometimes back before the option of CNG was available for these vehicles, they used to emit thick black smoke due to adulteration of kerosene in the petrol.
The public transport system in Delhi comprises about 3500 privately operated blue line buses and about the same number of buses under Delhi Transport Corporation. The buses, which are beyond the recommended period of 4-5 years, are being slowly phased out because they emit large amount of smoke and particulate matter. The number of buses definitely needs to be increased keeping in view the increasing population. The overloading of buses, especially in peak hours also leads to higher smoke emissions. There is a need of introducing high capacity buses so that more passengers are carried without causing a burden on the pollution load.
The diesel trucks also emit high levels of smoke and particulate matter. Their permits should be renewed only after satisfactory inspection regarding the maintenance measures for pollution control.
Various norms have been specified and gross emission standards for vehicles have been prescribed from time to time. The Ministry of Road Transport and Highways has notified emission norm vide GSR ΠI (E), under the Central Motor Vehicles Rules (CMVR), 1989, amending Rule 115 of CMVR. In this amendment, the emission norms for carbon monoxide and hydrocarbons for new generation vehicles have been proposed which would come into force from 1 October 2004. The mass emission standards for CNG/ converted diesel vehicles have also been notified.
Vehicular Emission Norms
In addition to Delhi, 10 other mega-cities namely Mumbai, Kolkata, Chennai, Bangalore, Hyderabad, Ahmedabad, Pune, Surat, Kanpur and Agra, have already introduced Bharat Stage-II norms which are equivalent to Euro-II norms during April 2000 to 2003.
These cities would introduce Euro HI and Euro ΓV equivalent norms by 1st April 2005 and Ist April 2010, respectively. These schedules of implementation would be reviewed in 2006.For new two and three wheelers, Bharat Stage II and Euro IΠ equivalent norms would be introduced in entire India by April 2008/2010, (Annual Report, MoEF, 2003-2004).
The Supreme Court of India has issued several directions for pollution control in Delhi in the Writ Petition (Civil) No. 13029/1985 in the matter of M.C. Mehta vs. Union of India. These are listed below in Table 15.5.
Table 15.5 Various Directions of the Supreme Court of India and their respective Time frames
| S.No. | bgcolor=white>DirectionTimeframe | |
| 1. | Strict enforcement of restriction on plying of goods vehicles during the day time | 15.08.1998 |
| 2. | Elimination of leaded petrol from Delhi | 01.09.1998 |
| 3. | Phasing out/ ban on plying of old commercial/ transport vehicles | |
| (i) Vehicles more man 20 yrs old | 02.10.1998 | |
| (ii) Vehicles more than 17 yrs old | 15.11.1998 | |
| (iii) Vehicles more than 15 year old | 31.12.1998 | |
| 4. | Ban on supply of loose 2T oils | 31.12.1998 |
| 5. | Supply of only pre-mix petrol to two-stroke engine vehicles | 31.12.1998 |
| 6. | Establishment of two independent fuel testing labs | 01.06.1998 |
| 7. | Only non-commercial vehicles complying with Euro I norms to be registered in NCR | 01.06.1999 |
| 8. | Only non-commercial vehicles complying with Euro ∏ norms to be registered in NCR | 01.04.2000 |
| 9. | New ISBT to be built at Delhi’s North and South-west borders (to avoid pollution due to entry of inter-state buses) | 31.03.2000 |
| 10. | Replacement of all pre-1990 autos and taxis with new vehicles using clean fuel | 31.03.2000 |
| 11. | Expansion of CNG supply outlets from 9 to 80 | 31.03.2000 |
| 12. | Ban on plying of buses more than 8 years old except on clean fuels | 01.04.2000 |
| 13. | Strengthening of existing air quality monitoring stations and setting up of new stations of critical pollutants | 01.04.2000 |
| 14. | Replacement (with financial incentives) of post 1990 autos and taxis with new vehicles on clean fuel | 31.03.2001 |
| 15. | Entire fleet of DTC and private buses to be converted to single fuel mode on CNG | 31.03.2001 |
| 16. | Augmentation of public transport from existing 6,600 to 10,000 buses | 01.04.2001 |
| 17∙ | Permission to ply less than 8 years old autos, taxis and buses on conventional fuels till 30.09.2001 on special permits provided they have placed firm orders for new CNG vehicles or conversion of existing vehicle to CNG mode by 31.03.2001 | 31.09.2001 |
Measures taken for the control of vehicular pollution
(1) Improvement of fuel quality: The quality of fuel has significantly improved because of the following measures:
(a) Leaded petrol has been completely phased out.
(b) Introduction of low sulphur diesel with effect from August 1997 reducing sulphur content from 0.8% gm/L to 0.25% gm∕L.
The sulphur content of diesel has been further reduced to 0.05% with effect from March 2001. The quality of petrol has been improved by reduction of sulphur content to 0.05% and benzene content to 1%.(2) The pollution standards prescribed under rule 115 (2) of Central Motor Vehicle Rules, 1989 are as follows:
(a) For petrol / CNG / LPG Vehicles
(i) Idling carbon monoxide emission limit for all two and three wheelers should not exceed 4.5%.
(ii) Idling carbon monoxide emission limits for all vehicles other than two and three wheelers should not exceed 3%.
(b) For DieseI Vehicles: Smoke density for all diesel vehicles should not exceed 65 hartridge smoke units.
(3) Use of clean fuels such as CNG: CNG is emerging as an attractive fuel because of its clean burning characteristics and very low amount of exhaust pollution. It mainly consists of methane (80-90%) which is compressed to a pressure of 200-250 kg cm-2.
The properties of CNG, unleaded gasoline and diesel are given below in Table 15.6.
Table 15.6 Properties of some fuels
| Property | Units | Gasoline | Diesel | CNG |
| Auto ignition temperature | Degree C | 320 | 225 | 540 |
| Flammability limit | % | 1.4-7.6 | 0.6-5.5 | 5-15 |
| Flame temperature | Degree C | 1977 | 2054 | 1970 |
| Octane No. | — | 89 | — | 120 |
| Cetane No.Degree C | — | 10 | 45 | -10 |
In December 1998, Indraprastha Gas Limited (IGL), a joint venture company between Gas Authority of India Limited (GAIL), Bharat Petroleum Corporation Limited (BPCL) and Government of Delhi has been formed. After incorporation of IGL, GAIL has transferred all the activities related to CNG project to IGL for its implementation in Delhi. IGL is implementing the CNG programme as per the directives given by the Hon’ble Court. It is getting all the necessary assistance from the Environment Pollution (Prevention and Control) Authority (EPCA) as EPCA is monitoring the development of the CNG project.
There are 106 CNG filling stations as on March 2003. Ikg of CNG energy is equivalent to 1.39 litres of petrol and 1.18 litres of diesel. The price of CNG is far less than that of petrol which amounts to about 65% of saving on fuel bill.
Table 15.7 gives the emissions of various pollutants from petrol and CNG for different types of pollutants in gram per kilometre of the vehicle run.
Table 15.7 Emission of Various Pollutants
| TypeofVehicle | Pollutant | Petrol | CNG | % Reduction |
| Maruti Omni | CO | 19.79 | 0.55 | 97 |
| HC | 1.14 | 1.02 | 11 | |
| Maruti Gypsy | co | 4.94 | 0.59 | 88 |
| HC | 1.86 | 1.42 | 24 | |
| PremierPadmini | co | 18.38 | 0.94 | 95 |
| HC | 2.83 | 2.03 | 28 | |
| Premier 118 NE | co | 15.60 | 2.04 | bgcolor=white>87|
| HC | 2.57 | 1.92 | 25 | |
| Ambassador | co | 52.16 | 0.78 | 98 |
| HC | 6.37 | 4.33 | 32 | |
| Bajaj | HC | 3.26 | 3.99/1.26 | 63.19 |
| Three Wheeler | co | 5.48 | 1.57 | 71.39 |
| CO2 | 47.44 | 27.60 | 41.82 | |
| NOx | 0.25 | 0.20 | 20.00 |
Source: Paper by N.K. Verma and A.K. De, Indraprastha Gas Limited
The cost of CNG kit and its installation in a car ranges between Rs. 30000 to 35000. In case, a vehicle runs out of CNG, it can be run on petrol.
(4) Traffic Planning and Management: The existing road capacity can be better utilized by relieving the congestion on the roads. Some such initiatives are as follows:
(i) Traffic management of most polluted intersections/ areas
(ii) Use of synchronized signals
(in) Display of halting time at major traffic intersections
(iv) Construction of express ways
(v) Augmentation of Fleet size
The stage carriage fleet has 7000 routes out of which 2700 are operated by DTC. There are 2100 CNG buses and 4200 mini buses.
Seven corridors- five for high capacity bus system and two for electric trolley bus system have been identified. One corridor of the high capacity bus system involves the operation from Dr. Ambedkar Nagar to ISBT via Moolchand. The first phase involves making this corridor of 5.5 km operational.
(vi) Start of Metro Rail under Mass Rapid Transport System TheplanningforMetroRailCFig. 15.3) InDelhistartedin 1950’s and various studies were conducted for the feasibility of mass transit system. The first step for construction was the registration of Delhi Metro Rail Corporation (DMRC) in 1995. However, the actual construction project started on 1st October 1998.
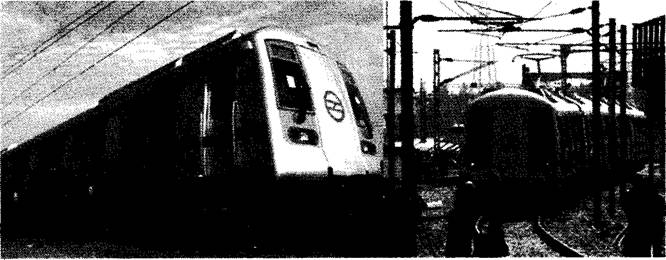
Fig. 15.3: Metro Rail
The work of the project is divided into phases. The present Phase I is
being implemented by the construction of the following three lines:
| Line 1 Shahadra- Trinagar- Barwala | 28 km | 21 stations |
| Line 2 Vishwa Vidyalaya- Central Sectt. | Hkm | 10 stations |
| Line 3 Barakhamba Raod- Connaught Palace-Dwarka | 22.8 kms | 22 stations |
| Total | 61.8 kms | 53 stations |
Line 1 from Shahadra to Tis Hazari has already been commissioned in December 2002. It operates for a distance of 8.5 km and caters to 30,000 passengers per day. A further stretch of 4 km from Tis Hazari to Trinagar was commissioned in October 2003 while the third extension from Trinagar to Rithala covering 9.4 km was commissioned in March 2004. Further from Rithala to Barwala another distance of 6.1 km would be covered under Line 1.
Line 2 (fully underground) -11 kmVishwa Vidhalaya- ISBT (North-South)
- 4.0 km by December 2004
ISBT- Central Secretariat (North-South) - 7.0 km by September 2005
Line 3 (elevated/at grade/underground) - 23.5 km
Barakhamba Road- Kirti Nagar (East-west) - 7.2 km by June 2005 Kirti Nagar- Dwarka (East- West) - 16 km by September 2005
Phase IIis also divided into two lines and is proposed to be completed by the year 2010. The details of the two lines are as follows:
Line 2 : Vishwa Vidyalaya- New Azadpur- SG Transport Nagar (North extension)- 8.6 km
Central Secretariat - AIIMS- Vasant Kunj (Southern extension) - 18.2km
Line 3 : Barakhamba Road- Mayur Vihar- NOIDA (Eastern extension) -15.3 km
The Metro map is shown in Fig. 15.4.
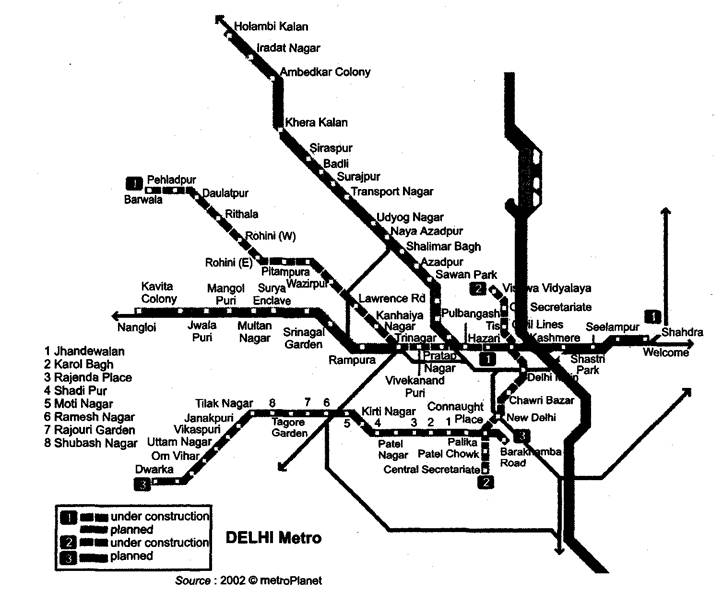
Fig.15.4: Metro Rail Map
The phase I would cover a total of 65.11 km with the estimated cost of Rs. 10,571 crores (Rs 6000 at 1996 price level). However, the cost of the whole project which comprises of 198.5 km was estimated to be Rs. 15,000 crores at 1996 price level. Phase I will have the following benefits:
(1) It will siphon off 21.82 Lakh commuter trips from the road.
(2) The number of buses on roads would decrease by 2,600.
(3) The average speed of buses on roads would increase from 10.5 to 14 km per hour. It will save a fuel cost worth Rs 5 billion per year.
(4) The travel time would be reduced by 50-75%. Thus, there will be a saving of 2 million man-hours per day.
(5) The reduction in atmospheric pollution level would be by 50%.
(6) The net benefit expected for Delhi after phase I would be Rs 437.23 Lakhs per day.
(7) There would be reduction in the number of road accidents. Thus, a safe and more comfortable journey would ensure improved quality of life.
The Delhi Metro Project is an eco-friendly project. It has been awarded OH SAS 18001 (Occupational Health and Safety Assessment Sequence 18001) by Registro Italino Navale India Pvt. Ltd. (RINA), Geneva. It is the only operational metro to receive this certificate in such a short time. It also received ISO 14001 certificate for establishing an environmental management system making it the first metro in the world to receive this certification at the construction stage.
The DMRC Corporate Culture specifies that the construction would not degrade the environment. 30% of the trees in the alignment have been saved and for every free cut during construction, ten trees have been planted in advance as compensatory afforestation.
A detailed Environmental Impact Assessment has been done in 1994 to minimize the negative impacts of the project on the environment. Storm water drains were identified at various sites for drainage of wastewater from construction. Also, locations for temporary and permanent disposal of soil arising out of tunneling and construction works were identified. Efforts were done to keep the noise and air pollution during construction at a minimum. In addition, coordination with other bodies to control traffic, water supplies, electricity and telephone facilities was done to cause minimum inconvenience to the people.
15.4
More on the topic Vehicular Pollution in Delhi:
- Industrial Pollution in Delhi
- The Delhi Sultanate, the Mogul Empire and the Modern States
- 20 The Delhi Sultanate as Empire
- Lordship, Community, and Territory, and the Making of the Delhi Sultanate
- Environmental Pollution
- Control of Noise Pollution
- Control of Air Pollution
- 2 Legislative policies towards agricultural pollution
- Tradeable pollution rights
- Defining pollution
- Sources of Marine Pollution
- Thermal Pollution
- Sources of Air Pollution
- Types of Water Pollution