POVERTY MEASUREMENT AND TRENDS
In this section we examine the complexities of poverty measurement from its origins to current practice. We rely mainly on the LIS and OECD data to examine levels and trends in overall poverty, but we also refer to the literature on child and elder poverty.
In our empirical examinations we look at both rich countries and MICs, comparisons of trends in relative poverty over different time periods, comparisons of relative and anchored poverty across the GR, and finally the correlation between levels of relative poverty and inequality as an introduction to Section 8.4 on overall income inequality.8.3.1 Origins and Development of Poverty Measurement
The fundamental concept of poverty concerns itself with having too few resources or capabilities to participate fully in a society. As Blank (2008) reminds us, “poverty is an inherently vague concept and developing a poverty measure involves a number of relatively arbitrary assumptions.” Ultimately, social scientists first need to establish the breadth and depth of this social phenomenon called “poverty” before they can meaningfully analyze it and explore its ultimate causes and remedies. Thus, we turn to measures and comparisons of poverty used by economists and other social scientists within and across nations.
Our discussion is framed by Figure 8.1, which reviews most of the possibilities of poverty concepts and measures. Here we are mostly interested in the concept of objective poverty measures, according to some standard definitions of means versus resources.[367]
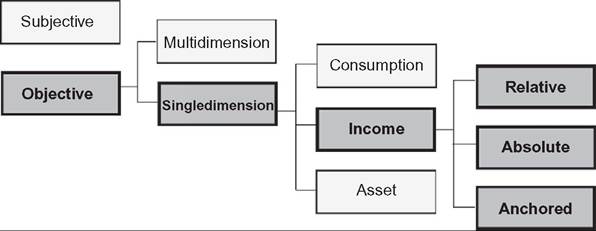
Figure 8.1 Conceptualizing poverty and its measurement. Source: Adapted from Dhongde (2013).
In this chapter we are mostly interested in objective poverty measurement using a single dimension of “resources,” income, and several notions of “needs” standards: those that are relative, absolute, and closely related anchored poverty lines.
We chose income poverty because ofits domination in modern (post-1960s) poverty studies and because of its linkages to the income inequality literature that follows. Other measures and concepts of poverty also are mentioned but not empirically investigated.Income or living standards poverty measurement began in the Anglo-Saxon countries and dates back at least to Rowntree (1901), who was the first to use the concept of a poverty line in his empirical work on York, England. Thanks to his enterprise, and that of Booth (1903), who invented the idea of a poverty line for London, we have a meaningful social indicator of basic needs (see, for instance, Piachaud, 1987; Ravallion, 2014; Ringen, 1985; Townsend, 1979, 1993). We also note that official poverty measurement began as an Anglo-American social indicator. Since then, “official” measures of poverty (or measures of “low income”) now exist in over 100 countries and for Europe as a whole (Eurostat, 2005). The United States (DeNavas-Walt et al., 2012) and the United Kingdom (Department for Work and Pensions, 2012) have long-standing “official” poverty series. Statistics Canada publishes on an irregular basis the number of households with incomes below a “low-income cutoff’, as does the Australian government with those below the “Henderson line.” In Northern Europe and Scandinavia the debate centers instead on the level of income at which minimum benefits for social programs should be set. In other words, their concept of insufficient “low income” is directly fed into programmatic responses to social needs (Bjorklund and Freeman, 1997; Marx and Nelson, 2013; Ravallion, 2014).[368]
While poverty measurement is an exercise that is particularly popular in Englishspeaking countries, most rich nations share the Anglo-Saxon concern over distributional outcomes and the well-being of the low-income population. There is no international consensus on guidelines for measuring poverty, but international bodies such as the United Nations Children’s Fund (UNICEF, 2000), the United Nations Development Programme (UNDP, 1999), the Organization for Economic Cooperation and Development (OECD, 2008, 2013), and the European Statistical Office (Eurostat, 1998, 2005) have published several cross-national studies of the incidence of poverty in rich countries.
The large majority of these studies have been based on the LIS database, which can be accessed at www.lisdatacenter.org. Some examples of these studies include Forster (1993), Jantti and Danziger (2000), Smeeding et al. (2000), Kenworthy (1998), Smeeding et al. (1990), and Smeeding (2006). More recently the European Union and the OECD have regularized measurement of poverty but using different standards and data sources. Today one can find poverty measures in over 100 countries, as well as some harmonized measures from the World Bank that use both secondary (published) data- and microdata-based measures of consumption and income to determine those living below some particular amount of income per person day, from $1.25 to $2.00 (Chen and Ravallion, 2012; Ravallion and Chen, 2011b).8.3.2 Measuring Poverty
Most broadly, the measurement of poverty in rich nations involves the comparison of some index of household well-being with household needs. When command over economic resources falls short of needs, a household (or person or family) is classified as poor. Well-being refers to the material resources available to a household. Among most social scientists, the concern with these resources is generally not with material consumption per se, but rather with the capabilities such resources give to household members so they can participate fully in society (Brandolini and Smeeding, 2009; Sen, 1983, 1992). These capabilities are inputs to social activities, and participation in social activities gives rise to a particular level of well-being (Coleman and Rainwater, 1978; Rainwater, 1990). Methods for measuring a person’s or household’s capabilities differ according to the context in which one assesses them, either over time or across nations or among subpopulations within a nation, for example, rural versus urban China.
All advanced societies are highly stratified; hence, some individuals have more resources than others. The opportunities for social participation are affected by the resources that a household disposes, particularly in nations such as the United States, where there is heavy reliance on the market to provide such essential services as health care, postsecondary education, and child care.
Monetary income is therefore a crucial resource. Of course, there are other important kinds of resources, such as social capital, wealth, noncash benefits, primary education, and access to basic health care, all of which add to human capabilities (Coleman, 1988). These resources may be available more or less equally to all people in some societies, regardless of their monetary incomes. There are many forces in rich societies that reduce well-being by limiting capabilities for full participation in society, including inadequacies in neighborhoods where people live, racial and ethnic discrimination, neighborhood violence, low-quality public schools and other social services, lack of good jobs, and job instability, all of which increase economic insecurity, reduce human capabilities, and increase poverty.Because there is no single commonly accepted way to measure poverty among social scientists, there is a desire to go beyond the popularly used income poverty definition used below. So there exists a wide variety of additional poverty measures that substitute for or complement the preponderance of income-based measures used by quantitative sociologists and economists (see, e.g., Boltvinik, 2000; Haveman, 2009; Ruggles, 1990). In principle, poverty is a multidimensional concept and should reflect several aspects of personal well-being, as shown in Figure 8.1. Forms of deprivation other than economic hardship can certainly be relevant to poverty measurement and to antipoverty policymaking. A number of authors have suggested that separate measures of needs ought to be developed for different goods and services (Aaron, 1985). Housing and health care often are mentioned in this context, although the latter is particularly of interest in medically unequal nations such as the United States, whereas the former is of much greater interest in the United Kingdom (UnitedKingdom Department of Social Security, 1993).
The concept of multidimensional poverty is also flourishing.
Official measures of social exclusion, material deprivation, and material hardship exist mainly in Europe, although they are beyond the empirical bounds of this chapter. Europe adopted the official Laeken set of social indicators in 1995, including the at-risk-of-poverty indicator, with an explicit objective of reducing poverty and social exclusion (Marlier et al., 2007). Indeed, indicators of material deprivation now form part of the Europe 2020 target of poverty reduction (Atkinson and Marlier, 2010, Chapter 6).Both consumption poverty and asset poverty have been proposed as an alternative to income poverty in rich nations (Brandolini et al., 2010; Meyer and Sullivan, 2012a,b). In a few nations, asset and income poverty can be combined into a joint measure (Gornick et al., 2009), as can consumption and income poverty (Meyer and Sullivan, 2012a,b). But consumption and asset poverty measures are not yet ready for widespread use on a crossnational basis, despite their usefulness for some types ofpoverty measurement (e.g., many income-poor elderly consume more than their incomes because of dissaving and spending from assets).
In summary, we are interested primarily in comparative cross-national poverty measured in terms of income, not only because income-based poverty measures are more comparable across nations but also because income-based poverty allows us to connect our empirical work to overall inequality per se in the rich nations and MICs observed in this chapter. As mentioned above, income is generally a better measure of resources than consumption in rich countries. In the rapidly growing MICs, the differences in living standards between rural and urban populations cause the most angst over consumption versus income poverty. The richer the country, however, the more income becomes a better and more comparable measure. At the frontier of such comparisons, work by the LIS on “production for own consumption” and “informal labor” income help ease the comparisons across diverse areas within nations.
8.3.3 Measuring Absolute, Relative, and Anchored Poverty in Rich and Selected MICs
An absolute poverty standard is defined in terms of a level of purchasing power that is sufficient to buy a fixed bundle of basic necessities at a specific point in time. A relative standard, on the other hand, is defined relative to the typical income or consumption level in the wider society. The purchasing power of a relative poverty standard changes over time as society-wide income or consumption levels change, whereas an absolute poverty standard changes only with the prices of commodities it can buy. Most cross-national comparisons use the relative definition of poverty, especially because purchasing power parities to convert any absolute measure to country currency are subject to fluctuation and sometimes severe measurement error (Jantti and Danziger, 2000).
In the broadest sense, all measures of poverty or economic need are relative because context is important to the definition of needs. The World Bank uses poverty measures of $1.25—2 per person per day—or $1095—2190 per year for a family of three—for the developing nations of Africa, Central Asia, or Latin America (Chen and Ravallion, 2012). In contrast, the 2011 United States “absolute” poverty threshold was about $18,000 for a family of three—8—17 times the World Bank’s poverty line; one-half of median income, the preferred relative poverty standard in the United States, is another 25% above this poverty line, or 10—21 times the poverty standard in poor countries. Moreover, as economic inequality has increased in most rich societies over the past 20 years, the study of relative deprivation and poverty has taken on new life (Gornick andjantti, 2013; Gottschalk and Smeeding, 2000; OECD, 2011, 2013).
Cross-national comparisons of poverty in rich countries therefore rely heavily on relative concepts of poverty, which are a reflection of the fact that a poverty standard or a minimum income standard ought to reflect the overall standard of living in society. One early source of this formalization (Abel-Smith and Townsend, 1965) came about in arguing that the officially defined minimum level of income in the United Kingdom, as represented by the National Assistance scale, should increase with the rising standard of living, and not just with consumer prices. It was Townsend’s work in the early 1960s, culminating in his famous 1979 book, that really launched the relative poverty approach on a much wider scale.
As Townsend (1979, p. 31) wrote:
Individuals, families and groups in the population can be said to be in poverty when they lack the resources to obtain the type of diet, participate in the activities and have the living conditions and the amenities which are customary, or at least widely encouraged or approved in the societies to which they belong.
The measurement of relative poverty has more recently been generally operationalized with a definition of the poverty line as a fraction of median income. Cross-national studies typically compare the percentage of people living with income below some fraction of the family-size-adjusted national median income.
Measurement of relative poverty in the United States also began in the 1960s and was pioneered by Fuchs (1967), who followed the thinking of Townsend and Abel-Smith and linked relative and absolute income poverty measurement. When Fuchs began his study, the absolute poverty measure in the United States begun by Lampman (1964) and then Orshansky (1965) was based on a poverty line of about $3000 for four persons. Fuchs pointed out that this was half of the median income at that time and that one could think differently about relative poverty compared with absolute poverty (Gilbert, 2008, p. 136).[369]
A relative poverty measure comparison is also consistent with a well-established theoretical perspective on poverty (Sen, 1983, 1992; Townsend, 1979). However, the fraction of income at which the poverty line ought to be set is open to debate. Most cross-national studies (LIS, OECD) focus on half of the median income, following Fuchs and others. But many feel that a 50% of the median standard is too low. It implies a poverty cutoff well below half the mean in unequal societies,[370] and it also affects the country rankings.[371] The European Statistical Office Working Group on Poverty Measurement has used 60% of the national median income as the common poverty threshold for European Community poverty studies in the new millennium (Eurostat, 2005, 2011).
A fully relative measure of poverty changes in lock step with median income, whereas an absolute measure changes only with prices. The income elasticity of the poverty line is therefore between 0 for the absolute measure and 1 for the fully relative measure. In some countries, such as the United States, the measure of poverty has become “semi-relative” as the poverty line advances only with the living standards of the bottom part of the distribution and not the whole distribution (Short, 2012). Ravallion and Chen (2011a) refer to “weakly relative measures,” which have the feature that the poverty line will not rise proportionately to the median or mean, but will have income elasticity less than unity. These are also-called quasi-relative poverty standards in the new “Supplemental Poverty Measure” for the United States, which varies by considering expenses on basic needs for a low-income family and how they change over time (Short, 2012).
Understanding both absolute and relative poverty measures is worthwhile because they tell different things about living standards as well as deprivation. Increasingly, the idea of “anchored” poverty measures have become important and can be used to indicate both relative (or weakly relative) and absolute poverty trends within a given nation. Anchored poverty measures begin with the same fully or weakly relative measure in 1 year (t) and then compare relative poverty in some future year (say year t +10) with poverty measures against a poverty line that has been changed only for prices between year t and year t + 10. These measures are especially useful in periods of rapid expansion or contraction in an economy, where relative poverty may not change by a lot, but where absolute poverty does change because of economic growth or contraction (see Atkinson et al., 2002; Johnson and Smeeding, 2012; OECD, 2013; Smeeding, 2006). Any absolute poverty line is also, therefore, an anchored poverty line. The difference is that an anchored poverty line can be updated to any period that is relevant to policy, given the analysis. As suggested above, the absolute (or anchored) U.S. Orshansky poverty line for the 1960s was about the same as a fully relative half-median income measure at that time. The United States has anchored its “official” poverty measure at this same point since that date. Now, 60 years later, the U.S. poverty line is only at about 30% of median income, not the 50% it was at its inception. Hence, analysts prefer to anchor their U.S. poverty studies at a semi-relative line (Johnson and Smeeding, 2012).
Here, for simplicity and breadth, we focus exclusively on the “headcount” measure of poverty, the share of people who fall below some definable point that indexes poverty. This approach does not measure the depth of economic need, the poverty gap, or the severity of poverty. People who are poor could become richer or poorer, with no change in a headcount measure of poverty. A pragmatic reason for using the poverty gap is that the headcount may be quite sensitive where there are spikes in the distribution because of the payment of flat-rate social transfers such as minimum social retirement level (or changes to the minimum wage).[372] Others (see especially Foster et al., 1984; Sen, 1976) focus on poverty measures that examine the distribution of poverty among the poor, taking account of both the depth of poverty and its severity. Because headcount measures are more easily understood, compared, and implemented than other more complex measures, we rely on them below.
The data we use are taken from LIS and sometimes OECD and are limited mainly to rich countries and MICs. The OECD includes a large number of rich nations, as well as Chile, Mexico, and Turkey. Both LIS and OECD have been interested in the BRICS countries (Brazil, Russia, India, China, and South Africa). LIS also has expanded to include other Latin American nations and Mexico. To establish trends in income poverty, however, one must have at least a decade or two of data, and here the number of MICs we can examine is severely limited.[373]
8.3.4 Level of and Trends in Poverty
We examine the level of and trends in poverty in a set of graphs and one table, all based on the LIS key figures data set, plus some special tabulations, to determine the level of anchored poverty using both LIS and OECD data. The percentage of people living below the half-median poverty line can now be examined for 38 nations using the LIS data (Figure 8.2). The 28 nations with light gray bars are the richest Anglo-Saxon, EU, and OECD nations; the 10 darker gray bars are for the MICs, including Russia, the BRICS nations, and several South American nations.[374]
If a “less poor” country is one with a single-digit poverty rate (where between 5% and 10% of its population are poor), 17 countries hit that target in the mid- to late 2000s, as
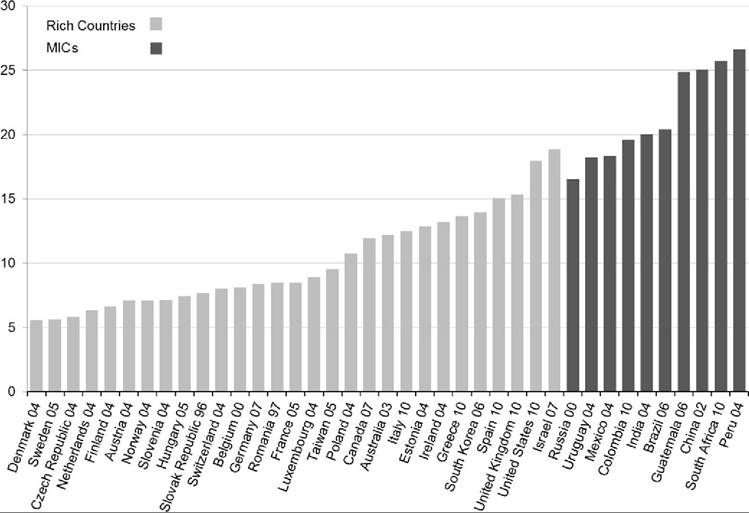
Figure 8.2 Relative poverty rates for total population (mid- to late 2000s) using LIS data. Poverty is measured by the percentage of people living in households with income (adjusted for family size) below half the median national income. Source: Luxembourg Income Study, Key Figures: http://www. lisdatacenter.org/lis-ikf-webapp/app/search-ikf-figures.
shown in Figure 8.2. The Scandinavian and Nordic nations are generally lowest, along with a number of “middle” western, central, and eastern European nations who have joined the 27 in the EU (from Belgium and the Netherlands west to Luxembourg, Germany, France, and Austria, plus Switzerland, the Czech Republic, Slovakia, Hungary, Slovenia, and Romania). This pattern has been more or less the same since the first LIS measures appeared 20-25 years ago (Atkinson et al., 1995; Smeeding et al., 1990), although the number of nations has now expanded considerably. Taiwan weighs in with the 17th lowest poverty rate—about 9.5%. Another nine nations have relative poverty rates from 10% to 15%, including Italy, Spain, Greece, Poland, Estonia, Canada, Australia, Ireland, and South Korea. Three rich nations are between 15% and 19%: the United Kingdom (15%), the United States (18%), and Israel (19%). Moving to the MICs, six countries overlap the three rich nations in the 15-20% range; Russia has a poverty rate below the United States and Israel, and Uruguay and Mexico more or less even with the United States. Finally, Colombia, India, and Brazil were all at 20% poverty. Poverty rates are 25% and above in Guatemala, China, South Africa, and Peru. In short, the range of comparable relative poverty rates from the most comparable source extant varies by a factor of 5.
The OECD data in Figure 8.3 provide essentially the same picture but measuring all nations in 2010 compared with 2002-2010, as shown in Figure 8.2. The OECD data also
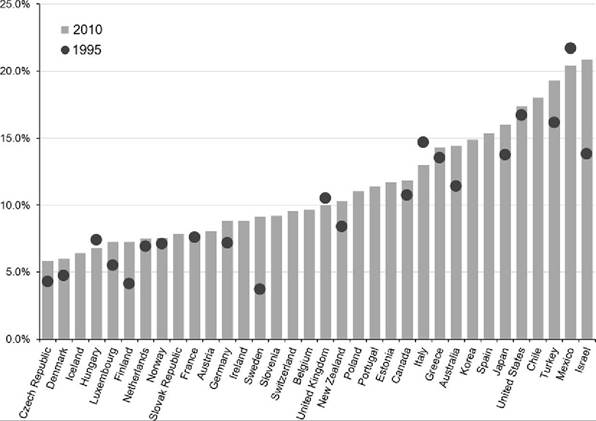
Figure 8.3 Levels and trends in relative poverty in OECD nations: 1995-2010. Poverty is measured by the percentage of people living in households with income (adjusted for family size) below half the median national income. Source: OECD Income Distribution Database (www.oecd.org/social/income- distribution-database.htm).
add a few nations (Iceland, Chile, and Turkey) to those in Figure 8.2 and also presents some data on 15-year trends in poverty, where available. Here, Israel leads the league in the table of poverty, with headcount rates surpassing 20%. The advantage of the OECD data is its rapidity of observation, and with 15-year trends, it is clear that relative poverty rates may change substantially over short periods of time.
Poverty in LIS is typically somewhat higher among children (Figure 8.4). Poverty averaged 13.5% among the countries for the total population but 16.5% for children. The correlation between child poverty and poverty in the total population is, however, quite high at 0.91, as reflected in Figure 8.4. The slope of the regression line in Figure 8.4 is 1.32, suggesting that child poverty rises about one-third faster than does overall poverty in these nations. The same sets of countries that are high, middle, and low poverty countries in Figures 8.2 and 8.3 also fall in the same relative positions for child poverty, but in some nations, such as Uruguay and Brazil, child poverty is disproportionately higher than overall poverty. In South Korea, child poverty is substantially lower than overall
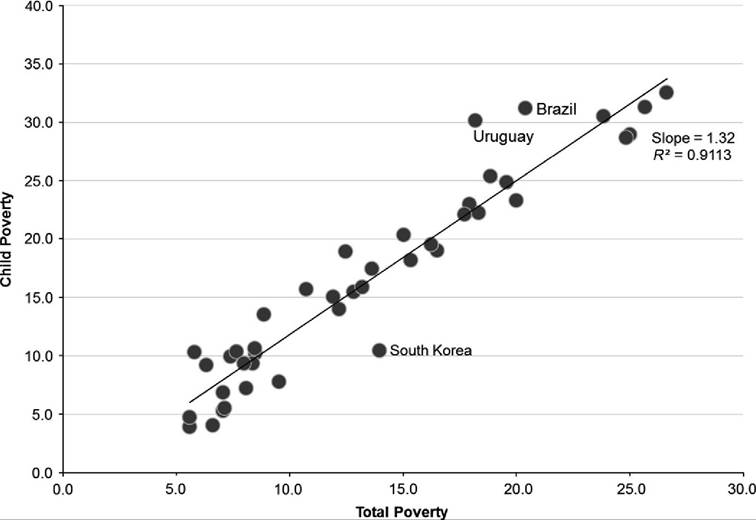
Figure 8.4 Correlation between total population poverty and child poverty in 38 rich and middleincome countries (late 2000s) using LIS data. Poverty is measured by the percentage of people living in households with income (adjusted for family size) below half the median national income. Source: Luxembourg Income Study, Key Figures: http://www.lisdatacenter.org/lis-ikf-webapp/app/ search-ikf-figures.
poverty. In the others, child poverty and overall poverty track each other closely. In general, poverty among the elderly is both lower and falling compared with that among children, which is higher and rising in most nations (LIS key figures, and OECD, 2013, Figure 8).
Trends in poverty can be evaluated using the same data and allow us to break the countries into several different groups based the range of years over which data are available and geographic/institutional comparability. The panels in Figure 8.5 show longer- term (since 1979) trends for the 14 different countries that have been in the LIS data for the longest period. All of these figures include data up through 2010 (or the latest year available). The trends from 1995 to 2010 are best illustrated using the OECD data in Figure 8.3, where we have such data for 21 nations.
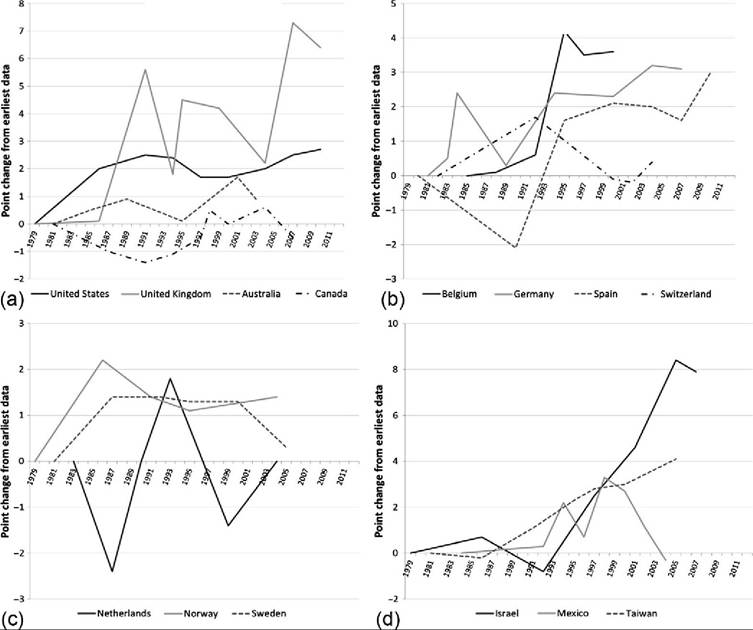
Figure 8.5 Trends in half-median poverty for 14 rich/middle-income nations, 1979-2010: (a) Englishspeaking countries, (b) continental/southern Europe, (c) Nordic countries, and (d) other countries. Poverty is measured by the percentage of people living in households with income (adjusted for family size) below half the median national income.
In analyzing trends in poverty, we are interested in both the direction of change and its magnitude. One finding is that none of the countries in Figure 8.5 (those countries with the longest series of data) have poverty that is appreciably (3 percentage points) lower in the most recent year than in the initial year of data from the late 1970s or early 1980s.[375] Canada (panel a) and Mexico (panel d) do have a bit lower poverty, but the difference for each country is very small (—0.5 and —0.3 points, respectively, with both series extending up through the mid-2000s—2007 and 2004, respectively). The trend data from the OECD (1995-2010 in Figure 8.3) suggest that relative poverty decreased only in Italy and Mexico over that period, although both by less than 3 percentage points.
Each of the other countries with long trends in Figure 8.5 has seen poverty increase or remain flat. Two countries stand out for particularly large increases, including Israel (panel d) and the United Kingdom (panel a), whereas the Nordic countries stand out as a cluster for seeing very little change in poverty (panel c) based on the LIS data. In contrast, the OECD data in Figure 8.3 show a massive increase in Swedish poverty, coming mostly after 2005 (compare with the LIS trend for Sweden in Figure 8.5c) and almost no change from 1995 to 2010 in the United Kingdom.[376] While relative poverty more than doubled in Sweden, appreciable increases can also be found in Australia, Finland, Israel, and Turkey over the 1995-2010 period (Figure 8.3).
Returning to Figure 8.5, in some nations, such as the Netherlands and Spain, poverty fell in the 1980s but returned to former levels (Netherlands) or went on to new heights (Spain) based on the LIS data. Poverty in Mexico rose though 1997, but then plummeted back to near its origin in 2004. Israel and the United Kingdom each had poverty rates more than 6 points above their origins by the late 2000s. Poverty rose steadily in the United States and Germany, increasing by about 3 percentage points in each, and by 4 points in Taiwan and more than 3 points in Belgium, from origin until the late 2000s. The rest generally stayed within ±3 percentage point bands from the origin until the final year.
While lessons about the importance of the start and end dates in term of volatility can be drawn, as well as differences across data sources in Figures 8.3 and 8.4, some other lessons emerge. These trends suggest that progress against relative poverty was uneven
Table 8.1 Trends in relative and anchored poverty
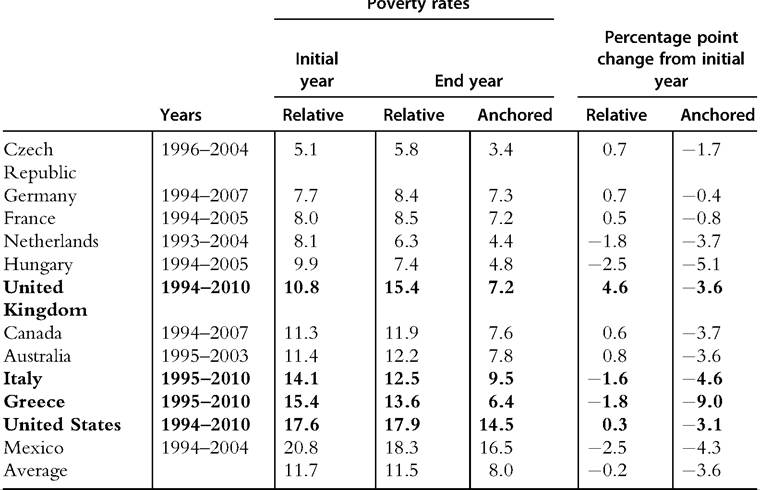
Data are based on the authors' calculations from LIS microdata files, http://www.lisdatacenter.org/.
Note: Poverty is measured by the percentage ofpeople living in households with income (adjusted for family size) below half of the median national income.
and rare in rich nations over the past 20—30 years. Other than Mexico, poverty rates did not consistently decrease over the past 25 years in any of the nations we examine here.[377]
8.3.5 Relative Versus Anchored Poverty and the GR
A different way to examine progress against poverty is to take a set of OECD nations and examine changes in both relative and anchored poverty in 12 nations over an 8—15-year period using LIS (Table 8.1) or across the shorter period of the GR, from 2005 or 2007 to 2010 (Figure 8.6). On average, relative poverty did not change much in the LIS, but anchored poverty fell by about a third from 11.7% to 8.0% between the mid-1990s and the year of the most recent observation (Table 8.1), suggesting rising living standards for people with incomes that would have been considered poor in the initial period. Indeed, anchored poverty decreased in every nation, reflecting rising living standards in Europe and elsewhere in the rich countries and MICs up until the GR. In contrast,
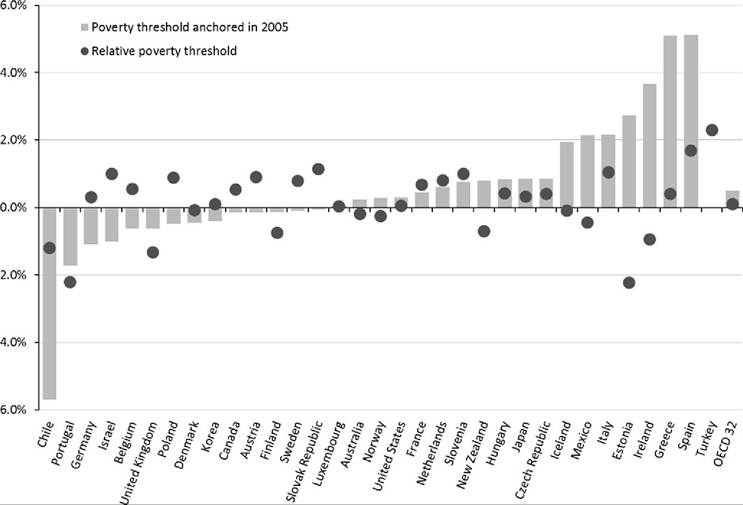
Figure 8.6 Anchored poverty in OECD countries: 2007-2010. Source: OECD Income Distribution Database (www.oecd.org/social/income-distribution-database.htm).
the changes in relative poverty over this same period were small, on average, in the LIS data but ranged from an increase of 4.6 percentage points in the United Kingdom to a decrease of 2.5 percentage points in Hungary and Mexico. All other relative poverty rates changed by less than 2 percentage points over this period.
The effects of the GR are included in the four LIS data sets in bold for the United States, United Kingdom, Italy, and Greece in Table 8.1. In each nation a data point is also available for 2007 (or 2008 for Italy only). In each nation, relative poverty rose by 0.2—2.2 percentage points through 2010, suggesting greater relative income losses for the poor than the rich in each nation during the GR. Despite the overall trends in each nation, anchored poverty increased between 2007/2008 and 2010. It increased by 1.2 points in the United States, 1.9 points in Italy, 2.6 points in Greece, and 3.0 percentage points in the United Kingdom. Hence, in each nation, despite the overall reductions in anchored poverty shown in Table 8.1, the poor lost ground in both relative and real terms over the course of the GR.
The OECD data (Figure 8.6) suggest much the same pattern in these four nations but add many others as well. Iceland, Mexico, Spain, Estonia, and Irelandjoin the list above, where living standards fell during the GR and anchored poverty increased much faster than relative poverty. Indeed, relative poverty did not increase much at all during the GR (and even decreased in Estonia and Ireland). In Poland, Belgium, and Germany, anchored poverty decreased but relative poverty did not change much. In Portugal and Chile, both anchored and relative poverty decreased during the GR. The changes in other nations were smaller.
We conclude that there was little progress in reducing relative poverty in almost all the rich nations examined here over the past two or three decades. Anchored poverty did decline in almost all rich nations from the 1990s up until the GR in 2007. Since the onset of the GR, however, anchored poverty has trended upward, with increases in anchored poverty in a majority of nations reducing some of the progress in real living standards for low-income households over the past 20 years, especially in the nations hardest hit by the GR. Relative poverty rates changed much less during the GR.
Finally, Figure 8.7 shows the correlation between relative poverty and inequality (using the LIS project Gini coefficient for DHI) across 38 nations. The correlation is astoundingly high: over 91%. The slope is 0.63, suggesting that a 10-point difference in the Gini, say from 0.20 to 0.30, is associated with a more than 6 percentage point increase in relative poverty. Still, at inequality levels of about 0.27 and 0.32, poverty rates can vary as much as 4 percentage points across nations with the same level of overall
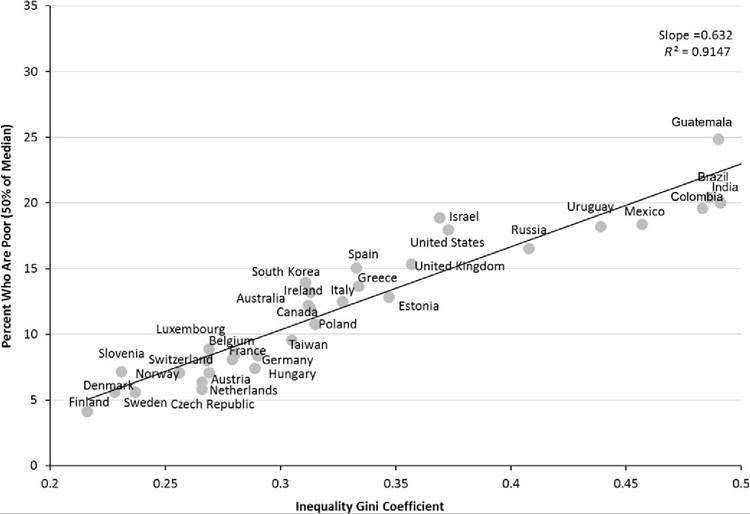
Figure 8.7 Relationship of relative poverty and income inequality in 38 nations (LIS).
Source: Luxembourg Income Study, Key Figures: http://www.lisdatacenter.org/lis-ikf-webapp/app/ search-ikf-figures.
inequality. Four nations stand out as having above-average poverty for their inequality level: Guatemala, Israel, South Korea, and the United States. Relative poverty levels are notably lower than inequality in the Czech Republic, Netherlands, Austria, and Hungary.
8.4.
More on the topic POVERTY MEASUREMENT AND TRENDS:
- WAGE DISPERSION: MEASUREMENT AND STYLIZED FACTS
- CONCLUSIONS: MAJOR FINDINGS FROM THE LITERATURE SURVEY AND IMPLICATIONS FOR FURTHER RESEARCH
- Entrepreneurship and small/medium-sized enterprises (SMEs)
- Annex A: List of UNDP Human Development Reports on Local Development Issues
- Disinfection
- Nutrients cycle at different rates according to element identity and ecosystem type
- Keeping Track of HIV Infection
- Chapter 33 Agricultural Investment Risk Relationship to National Domestic Production
- Wheelchairs and Seating
- Japan's neighbours: South Korea and Taiwan