Assessing the Determinants of the Hong Kong Discount
Our sample comprises thirty Chinese firms, with both “A” share and H- share listings, for which we obtained data from Bloomberg. Our maximum sample period runs from December 1998 through September 2006.
Table 8.4 lists the individual companies along with the relevant period for which the company’s data is included in our sample. We calculate the H- share discount as: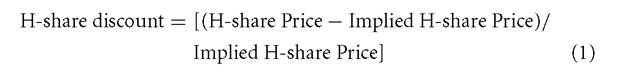
where the Implied H-share Price = [Price in renminbi/(RMB/$HK)] * H-share Conversion ratio.
Table 8.5 presents summary statistics on the H-share discount as well as the additional variables used in the regression model. The expected exchange rate change versus the Hong Kong dollar is derived from the twelve-month renminbi nondeliverable forward contract rate.[144] As shown in Figure 8.5, the implied expected appreciation of the renminbi against the Hong Kong
Table 8.4. Chinese Firms Included in the Empirical Work
| Company Name | H-Share Data Begins | H-Share Data Ends |
| Angang New Steel Co. | Dec. 11, 1998 | Sept. 29, 2006 |
| Anhui Conch Cement Co. Ltd. | Feb. 8, 2002 | Sept. 29, 2006 |
| Anhui Expressway | Jan. 10, 2003 | Sept. 29, 2006 |
| Beiren Printing Machinery | Dec. 11, 1998 | Sept. 29, 2006 |
| China Eastern Airlines Co. | Dec. 11, 1998 | Sept. 29, 2006 |
| China Petroleum & Chemical | Aug. 10, 2001 | Sept. 29, 2006 |
| China Shipping Development | May 24, 2002 | Sept. 29, 2006 |
| China Southern Airlines Co. | July 25, 2003 | Sept. 29, 2006 |
| Dongfang Electrical Machin. | Dec. 11, 1998 | Sept. 29, 2006 |
| Guangdong Kelon Elec. Hld. | July 16, 1999 | Sept. 29, 2006 |
| Guangzhou Pharmaceuticals | Feb. 9, 2001 | Sept. 29, 2006 |
| Guangzhou Shipyard Intl. Co. | Dec. 11, 1998 | Sept. 29, 2006 |
| Huadian Power Intl. Corp. | Feb. 4, 2005 | Sept. 29, 2006 |
| Huaneng Power Intr. | Dec. 7, 2001 | Sept. 29, 2006 |
| Jiangsu Expressway Co. Ltd. | Jan. 19, 2001 | Sept. 29, 2006 |
| Jiangxi Copper Co. Ltd. | Jan. 11,2002 | Sept. 29, 2006 |
| Jiaoda Kunji High-Tech Co. | Dec. 11, 1998 | Sept. 29, 2006 |
| Jilin Chemical Indus. Co. | Dec. 11, 1998 | Sept. 30, 2005 |
| Jingwei Textile Machinery | Dec. 11, 1998 | Sept. 29, 2006 |
| Luoyang Glass Company Ltd. | Dec. 11, 1998 | Sept. 29, 2006 |
| Maanshan Iron & Steel | Dec. 11, 1998 | Sept. 29, 2006 |
| Nanjing Panda Elec. Co. Ltd. | Dec. 11, 1998 | Sept. 29, 2006 |
| Shandong Xinhua Pharm. Co. | bgcolor=white>Dec. 11, 1998Sept. 29, 2006 | |
| Shenzhen Expressway Co. Ltd. | Dec. 28, 2001 | Sept. 29, 2006 |
| Sinopec Shanghai Petrochem | Dec. 11, 1998 | Sept. 29, 2006 |
| Sinopec Yizheng Chemical Fib. | Dec. 11, 1998 | Sept. 29, 2006 |
| Tianjin Capital Environ. | Dec. 11, 1998 | Sept. 29, 2006 |
| Tsingtao Brewery Co. Ltd. | Dec. 11, 1998 | Sept. 29, 2006 |
| Yanzhou Coal Mining Co. | Dec. 11, 1998 | Sept. 29, 2006 |
| ZTE Corp. | Dec. 10, 2004 | Sept. 29, 2006 |
dollar peaks at just over 5% in mid-2005 before falling back after the actual 2.1% appreciation imposed by the Chinese authorities on July 21, 2005 (Chapter 1). Furthermore, the spikes in revaluation pressure in September- December 2003, as well as the later mid-2005 spike, appear to coincide with drawdowns in the H-share discount as shown in Figure 8.4.[145] The
Table 8.5. Summary Statistics for Chinese Firms Traded in Hong Kong (Weekly Values)
| Observations | Mean | Std. Dev. | Minimum | Maximum | |
| Panel A: China-Hong Kong H-Share Sample | |||||
| H-Share Discount | 9,886 | -0.5961 | 0.2823 | -0.9765 | 0.3761 |
| Expected Exchange | |||||
| Rate Change | 408 | 0.0010 | 0.0396 | -0.0512 | 0.1113 |
| Relative Market | |||||
| P/E Ratios | 261 | 3.0034 | 1.4093 | 1.5353 | 6.3344 |
| Relative Company | |||||
| P/E Ratios | 8,734 | 2.0446 | 2.9582 | 0.2067 | 52.845 |
| Market Capitalization (in | |||||
| millions of renminbi) | 6,997 | 25.187 | 63.041 | 0.5977 | 584.95 |
| Panel B: Values at End of Sample on | September 29, 2006 | ||||
| H-Share Discount | 29 | -0.2788 | 0.2706 | -0.7235 | 0.15 |
suggested association between rising exchange rate expectations and a shrinking H-share discount is consistent with increased demand for renminbi-based Chinese stocks at times when investors expect exchange rate gains that would translate these renminbi values into larger Hong Kong dollar amounts.
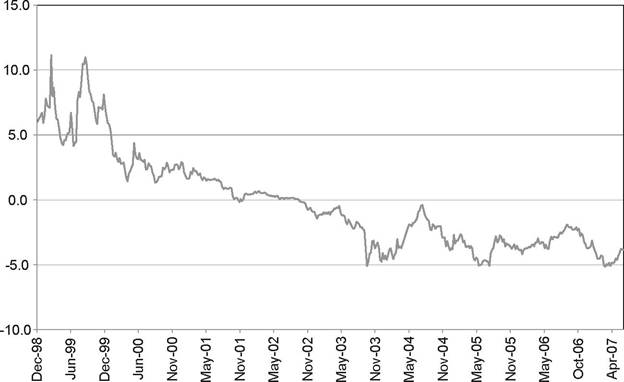
Figure 8.5.
Implied Expected Change in the RMB/$HK Exchange Rate (One-Year Nondeliverable Forward Contract).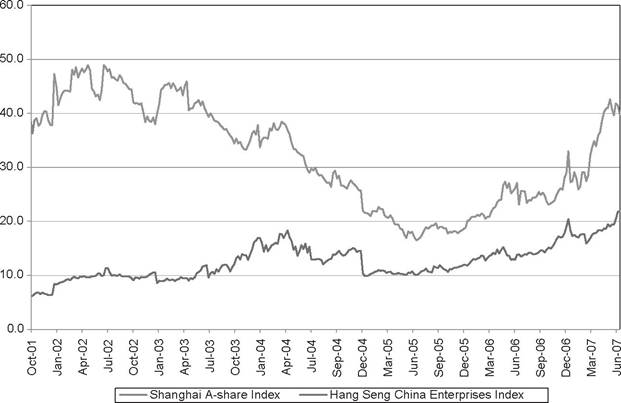
Figure 8.6. Average Price/Earnings Ratios for the Shanghai and Hong Kong Stock Exchanges.
The “relative market P/E ratio” reflects the price earnings ratio of the Shanghai “A” share Total Stock Index divided by the Hang Seng China Enterprises Index, whereas the “relative company P/E ratio” is the company’s price-earnings ratio divided by the price-earnings ratio of the Shanghai “A” share Total Stock Index. Figure 8.6 depicts the relative differences in price-earnings ratios between our Hong Kong and Shanghai market indices over the 2001-2006 period. We use the ratio of the price-earnings ratios as a proxy for differences in investor sentiment across countries. The average price-earning ratio attached to “A” shares steadily declines over 2001-2005, dropping from more than forty to below twenty in 2005 before rising again in 2006-2007. From mid-2005 through the end of our sample, the price-earnings ratios in both Shanghai and Hong Kong trend upward. The price-earnings ratios for the Hong Kong and Shanghai indices converge to a spread of ten points or less during most of 2005-2006. The gap between the respective price-earnings ratios then widens to around twenty points in mid-2007, still below the greater than thirty point gap seen in the past.[146]
In order to pin down the relative importance of exchange rate expectations and sentiment effects on the H-share discount, we estimate the following model:
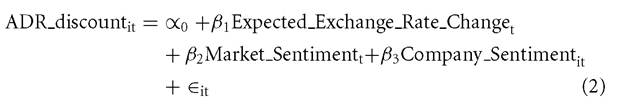
In this equation, the Expected-Exchange-Rate-Change is the predicted change in exchange rates implied by the twelve-month renminbi nondeliverable forward contract rate,[147] our Market_Sentimentmeasure is proxied by the price-earnings ratio on the Shanghai “A” share Total Stock Index divided by the price-earnings ratio on the Hang Seng China Enterprises Index, and the Company_Sentiment variable is measured by the individual company’s price-earnings ratio relative to the overall marketwide priceearnings ratio in Shanghai.[148] If the company’s price-earnings ratio is high relative to the overall Shanghai market, then it may suggest local Chinese sentiment toward this security is high - and, should Hong Kong investors not share such strong sentiment toward the security, the H-share will sell at a steeper discount.[149]
Our estimation results are presented in Table 8.6.
The negative coefficients indicate that the variables have the effect of making the H-share discount bigger, i.e., more negative. Each of the explanatory variables is significant at better than the 99% confidence level.[150] Column (1) indicates that the expected change in the renminbi exchange rate accounts for more than 40% of the total variation in the H-share discount on its own. The impact of expected exchange rate movements remains both statistically and economically significant as we add additional explanatory variables. Column (2) through Column (5) reveal that the market sentiment and company sentiment measures are also significantly related to the H-share discount,Table 8.6. Relationship Among the Hong Kong Discount, Exchange Rates, and Market Sentiment
We estimate the following model:

where the Expected-Exchange-Rate-Change is measured as the predicted change in exchange rates over the next twelve months as measured by the 12-month futures rate. The MarketSentiment measure is the ratio of the Shanghai “A”-Share Index P/E ratio to the Hang Seng P/E ratio at time t. The CompanySentiment measure is the ratio of company is P/E ratio to the Shanghai “A”-Share Index P/E ratio at time t. MarkeCCapitalization is measured in local currency at time t. All models are estimated using weekly data.
Dependent Variable = Hong Kong Discount
| (1) | (2) | (3) | (4) | (5) | |
| Expected Exchange | -5.327* | -2.344* | -5.531* | -1.834* | -1.901* |
| Rate Change | (0.074) | (0.277) | (0.088) | (0.261) | (0.256) |
| Relative Market | -0.108* | -0.110* | -0.109* | ||
| P/E Ratio | (0.003) | (0.003) | (0.003) | ||
| Relative Company | -0.021* | -0.023* | -0.022* | ||
| P/E Ratio | (0.001) | (0.001) | (0.001) | ||
| Market Cap | 0.586* | ||||
| (in billions) | (0.026) | ||||
| Constant | -0.625* | -0.243* | -0.579* | -0.177* | -0.201* |
| (0.002) | (0.016) | (0.003) | (0.015) | (0.015) | |
| Observations | 9,8876 | 7,192 | 8,734 | 7,001 | 6,997 |
| R-squared | 0.402 | 0.432 | 0.434 | 0.491 | 0.511 |
Note: Robust standard errors are in parentheses; * denotes significance at the 99% confidence level or better.
whether included alone or together. On average, the higher the relative market sentiment in Shanghai is, the lower the relative price in Hong Kong is and, hence, the larger the H-share discount. Similarly, when local Chinese investors drive up the market price of an individual company relative to other companies listed in Shanghai, that company's H-share price lags behind. Either way, if the sentiment change is local in origin, the effect evidently does not spill over to Hong Kong holders of the same security. These findings suggest that differences in investor sentiment across the two markets help explain the price differentials across the two markets, consistent with past studies. Our results imply that, should rising local sentiment, or “overexuberance,” make investors in Shanghai willing to pay more for
the same predicted earnings, we should see the H-share discount reaching higher than normal levels.
More on the topic Assessing the Determinants of the Hong Kong Discount:
- Bond equivalent yield (bey) and discount (d) yield compared
- PART ONE CHINA'S EXCHANGE RATE REGIME AND MONETARY POLIC
- Allianz Research. Country Risk Atlas 2024: Assessing non-payment risk in major economies. Allianz,2024. — 179 p., 2024
- Tackling the fallout from COVID-19
- References
- INDEX
- Sovereign bond risk and return
- Evolution of property rights
- Financial institutions and markets
- A guide to sources