Sovereign bond risk and return
Most countries issue government bonds which are similar in format to UK gilts and each country and their bonds are given a credit rating by one of the credit rating agencies. The three biggest and best-known agencies are Moody's, Standard & Poor's and Fitch, but there are others; recently the Chinese agency Dagong has made headlines by downgrading the UK and the US.
The rating they give indicates the relative risk of default - see Figure 3.1 for some of Standard & Poor's credit ratings in June 2014. Only a handful of countries are regarded as very safe, ‘triple A' rated - all of the AAA-rated countries are shown in Figure 3.1, along with countries on a slightly lower rating, AA or A, and those with a greater degree of risk. Triple A ratings allow countries to issue at a low real (after allowing for anticipated inflation) yield. Other countries, such as Greece and Uganda, are regarded as having more risk and so will have to pay a high-risk premium (a higher rate on the coupon) to entice investors to buy their bonds. Credit ratings are discussed further in Chapter 5.As communications have become easy and international flows of investment money commonplace, all bond markets worldwide are interconnected and interest rates have become linked. So, in general, bonds pay similar rates of interest if they carry the same risk (and inflation is anticipated to be the same). Table 3.1 shows the interest rates for a few of the bonds of the leading
The triple As (AAAs)
Australia Canada Denmark Finland
Germany Hong Kong Luxembourg Norway Singapore Sweden Switzerland UK
Some double As (AAs)
Austria Belgium Chile China France Japan Netherlands New Zealand Saudi Arabia
Taiwan USA
Some single As
Ireland
Israel Malaysia Poland Thailand Trinidad and Tobago
Some triple Bs (BBBs)
Brazil
India
Italy
Russia
South Africa
Spain
Turkey
Some rated lower than triple B
Argentina
Greece
Indonesia Kenya Pakistan Uganda Ukraine Vietnam Zambia
Figure 3.1 Credit ratings for some countries
Source: Data from Standard & Poor's website June 2014 www.standardandpoors.com/ratings/sovereigns/ ratings-list/en/us/?sectorName=null&subSectorCode=&start=0&range=50
Table 3.1 Benchmark government bonds on 11 June 2014
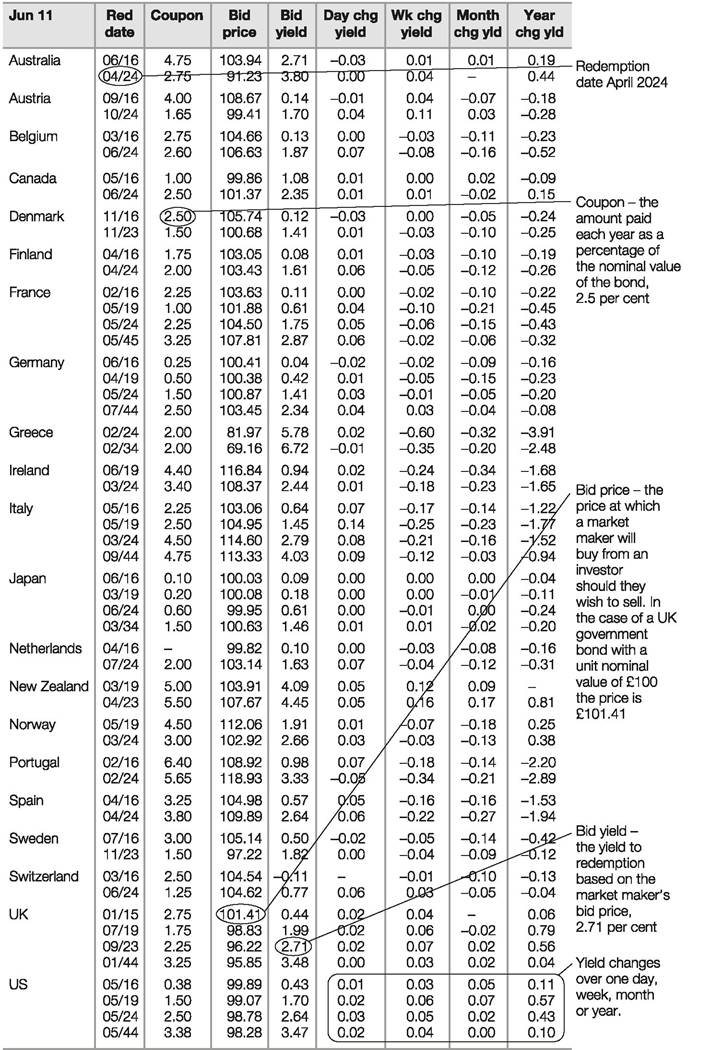
London close.
Yields: Local market standard Annualised yield basis. Yields shown for Italy exclude withholding tax at 12.5 per cent payable by non-residents.
government issuers when issuing in their currency. Benchmark securities are those used as market indicators, the bedrock yields. In the bond market the usual benchmarks are the prices and yields of bonds with 2 years, 5 years, 10 years and 30 years to redemption. These issues tend to be more liquid (traded more) than other bonds.
The Financial Times website also has a table displaying the spreads on ten-year benchmark bonds. That is, the number of percentage points of gross redemption yield above the ten-year German government bond (Bund) and above the ten-year US government bond (Treasury bond or T-bond) offered on a ten-year government bond from another country. Thus, Table 3.2 shows an investor in New Zealand government bonds (denominated in NZ$) will receive 3.06% per year more than an investor in German bonds (in euros) and 1.83% more than an investor in US bonds (in US$). The additional yield may compensate for greater anticipated inflation, greater perceived risk (such as exchange rate change risk) or other factors, e.g. the relative tendency for central banks to push down ten-year bond yields through their quantitative easing programmes (buying bonds, pushing up their prices and lowering their yields - see Chapter 16).
Table 3.2 Government bonds - spreads over ten-year bonds and US Treasuries
| Jun 11 | Bid Yield | Spread vs Bund | Spread vs T-Bonds | Bid Yield | Spread vs Bund | Spread vs T-Bonds | |
| Australia | 3.80 | +2.42 | +1.19 | Netherlands | 1.63 | +0.25 | -0.98 |
| Austria | 1.70 | +0.32 | -0.91 | New Zealand | 4.45 | +3.06 | +1.83 |
| Belgium | 1.87 | +0.47 | -0.76 | Norway | 2.66 | +1.27 | +0.04 |
| Canada | 2.35 | +0.94 | -0.29 | Portugal | 3.33 | +1.95 | +0.72 |
| Denmark | 1.41 | +0.02 | -1.21 | Spain | 2.64 | +1.25 | +0.02 |
| Finland | 1.61 | +0.22 | -1.01 | Sweden | 1.82 | +0.43 | -0.80 |
| France | 1.75 | +0.36 | -0.87 | Switzerland | 0.77 | -0.62 | -1.85 |
| Germany | 1.41 | - | -1.23 | UK | 2.71 | +1.33 | +0.10 |
| Greece | 5.72 | +4.34 | +3.11 | US | 2.64 | +1.23 | - |
| Ireland | 2.44 | +1.05 | -0.18 | ||||
| Italy | 2.79 | +1.40 | +0.17 | Yields: annualised basis | |||
| Japan | 0.61 | -0.78 | -2.01 | ||||
More on the topic Sovereign bond risk and return:
- Issuing gilts
- The Burden of High Government Deficits and Debt
- The Role of Finance and Financial Markets
- Constitutional identity or the return of the German nation
- Growth and Financial Capital Flows
- Money Growth and Inflation
- Ghana
- NOTES
- Comparative Reflections and Tentative Evaluation