The use of earnings and cash flows model in predicting corporate financial distress: Evidence from retail merchandizing enterprises listed in IDX
A. Selowidodo, R. Wikansari, B.P. Sutjiatmo & M.S. Kurniawan
Polytechnic APP Jakarta, Ministry of Industry, Indonesia
A.T. Rachmadi
Hokkaido University, Hokkaido, Japan
ABSTRACT: This research is aimed to examine and analyze the empirical effect of earnings and cash flows in predicting corporate financial distress of the retail merchandizing enterprises.
This study used secondary data obtained from the company’s financial statements in the period from 2014 to 2017 that are listed in IDX. Purposive sampling is used for collecting samples, and hence 15 firms were chosen for data research. The hypothesis testing was conducted using multiple discriminant analysis (MDA). The results of this study show that the earnings model is strong enough to predict corporate financial distress, while the cash flows model cannot be used as a predictive model of corporate financial distress. In other words, it is better to predict corporate financial distress based on earnings model than cash flows model.1 INTRODUCTION
Corporate financial distress is the situation when a company cannot meet or face difficulty to pay off its financial obligation to the creditors. Recently, corporate financial distress has become a famous topic in finance. Thus, firm’s financial health is a crucial indicator for interested users to know more about company’s financial condition. That is why corporate financial distress has a big impact on management, shareholders, employees, creditors, customers, and other stakeholders.
The prediction of corporate financial distress and bankruptcy has been a great interest of research in the late 1960s. In addition, corporate financial distress prediction has become an integral part of corporate governance as it helps all the stakeholders analyze to which direction a company is taking. According to Warner (1977), companies that are in financial distress tend to exhibit decline in market value over time.
Some studies found that earnings may be more useful in predicting corporate financial distress. McCue (1991) investigated the hospitals’ financial health in California. He showed that earnings model is more powerful than cash flows model. Similar research has been conducted by Djongkang & Rita (2014) on whether earnings or cash flows model can be used in predicting corporate financial distress of the company sector of textile mill product and apparel and other textile products listed in IDX. The result shows that earnings model can better predict corporate financial distress. In other words, it is harder to predict corporate financial distress by cash flows model than by earnings model. In contrast, Azis & Lawson (1989) found that cash flows-based model is more effective to predict corporate financial distress. However, according to Sharma (2001), studies using cash flows model for predicting company failure is not conclusive due to the limitations such as improperly measured cash flow operations.
In Indonesia, little empirical research has been done so far to assess the factors that are significant under corporate financial distress. Lack of research on the factors that contribute to corporate financial distress signifies that users do not have proper information about future prospects of a firm. Therefore, it is important to study the factors that are significant to financially distressed companies in Indonesia and thus provide a clearer picture in determining the significance of financial indicator while detecting financially distressed companies.
An interesting discussion issue in predicting corporate financial distress should be focus on both earnings and cash flows. Hence, the objective of this study is to empirically examine and analyze whether earnings model or cash flows model can better to predict corporate financial distress of the retail merchandizing enterprises listed in IDX for the period of 2014-2017.
2 LITERATURE REVIEW AND HYPOTHESIS
In modern concepts, financial distress is defined in many ways.
Lau (1987) defined financial distress as a three-stage process: incubation, deficit funds-flow, and financial distress or recovery. Gilberst et al.(1990) defined distress firms as firms that declared bankruptcy and firms that had negative cumulative earnings over three consecutive years. Ross (1996) stated, “Financial distress is a situation where a firm’s operating cash flows are not sufficient to satisfy current obligations and the firm is forced to take corrective action”. It is difficult to define precisely what distress or bankruptcy is, due to the variety of accounting procedures or rules in different countries or at different time spots as well as various events that put firms into financial distress.
2.1 Earnings-financial distress relationships
Corporate financial distress happens before bankruptcy. According to Wruck (1990), there are several pointers that can be used to detect corporate financial distress such as a reduction in the level of dividends issued out and retrenchment of employees and resignation of top management. In addition, Whitaker (1999) stated that the process of financial distress starts with a company’s inability to pay short-term obligations at the due date. The main reasons behind financial distress can be attributed to inappropriate asset management, corporate governance, or financial structure (Gilberst et al. 1990). Adeyemi (2012) suggested that lack of adequate funds is one of the major factors leading to financial distress as capital has the capability to absorb losses. Nevertheless, most managers focus on and blame external factors when their businesses fail instead of evaluating the internal factors (Scherrer 2003).
There have been many models developed in order to predict corporate financial distress. Many of these models involve the use of ratio analysis to analyze failed companies. Beaver (1966) and Altman’s (1968) studies consider five independent variables, and each of them represents the financial ratios.
In their studies, earnings before taxes (EBT) is considered as a proxy for earnings. According to surveys, EBT-based ratio is by far the most popular type of valuation technique in debt contract. The popularity of EBT is confirmed by Lie & Lie (2002), according to which EBT-based ratio is one of the most of frequently used valuation indicators. Due to its popularity, managers of many companies use EBT as a primary metric to reflect company’s performances (Isidro & Marques 2008). Thus, corporate financial distress is when the company is characterized by declining in financial conditions within a few years, negative net income, amount of cash flows less than long-term debt, and interest coverage ratio less than one. Based on the above arguments, the first hypothesis is proposed:H1: Earnings can predict corporate financial distress.
2.2 Cash flows-financial distress relationships
The information contained on a cash flow statement shows the decrease or increase in cash flow balance over an accounting period. Significance of a cash flow analysis towards a corporate financial distress prediction has been augmented by Ward and Foster in 1997. They compared the trends in three components of a cash flow statement, i.e., operating cash flow, investing cash flow, and financing cash flow (Tam & Kiang 1992).
The observations of Ward and Foster (1997) concluded that healthy companies have a tendency towards comparatively stable association among the three components of cash flow, i.e., operating, investing, and financing activities. In addition, it is noted that unhealthy companies were characterized by decreasing cash flow from operating, investing, and financing cash flow about one or two years before they failed for financial distress. This study is vital as it portrays the significance of assessing cash flow information while examining corporate financial distress. Based on the above arguments, the second hypothesis is developed as follows:
H2: Cash flows can predict corporate financial distress.
3 METHOD
3.1 Populationsandsamples
The populations in this study related to all retail merchandizing enterprises listed in IDX. The samples were classified into two groups, namely analysis samples and holdout samples. The analysis samples were retail merchandizing enterprises listed in IDX for the period of 2014-2016. And the holdout samples were retail merchandizing enterprises listed in IDX for the period of 2017. The samples were selected by using purposive sampling method using the following criteria: (1) retail merchandizing enterprises that are listed in IDX for the period of 2014-2017, (2) having published audited financial statements for the fiscal period of 2014-2017, (3) companies are grouped into two groups for each model. Groups in the earning model are those with positive earnings and negative earnings. Groups in the cash flows model are positive cash flows and negative cash flows; and (4) the analysis samples consist of 45 firm-year from 15 different firms in earnings model and 45 firm-year from 15 different firms in cash flows model. The holdout samples consist of 15 firms.
3.2 Dependent variables
Dependent variables, corporate financial distress based on earnings model and cash flows model, are expressed as dummy variable (1) if the firm has positive earnings, and (0) if the firm has negative earnings; (1) if the firm has positive cash flows, and (0) if the firm has negative cash flows. In this study, EBT is used as a proxy for earnings, where extraordinary items and discontinued operations are not included in order to avoid the effect of different tax tariffs at different periods. In other words, the reason for excluding extraordinary items and discontinued operations is to eliminate elements that may show increased profit growth in one period but will not appear in any other periods. However, the data of cash flows are derived from the cash flow figures presented in the audited financial statements of the company.
3.3 Independent variables
The list for independent variables which may influence financial distress is as follows: Sales, Inventory turnover, Size, Employees, Current ratio, Acid ratio, Days in account receivables, Return on assets, Operating profit margin, Operating expenses, Total assets turnover, Net fixed assets turnover, Net fixed assets, Total debt to total assets, Long-term debt to total assets, and Equity to total assets (Atmini & Wuryana 2005).
The independent variables in this study are the variables used to measure the company’s product market, institutional factors, operations, liquidity, income and expenses, profitability, activity and investment, and coverage (McCue 1991).
The institutional factor variable is the company size data. The operating variable is the number of employees. The liquidity variables are the current ratio, acid ratio, and days in account receivable. The income and expenses variables are sales and operating expenses. The Profitability variables are operating profit margins and return on assets. The activity and investment variables are inventory turnover, total asset turnover, net fixed assets turn over, and net fixed assets. The coverage variables are ratios of total debt to total assets, long-term debt to total assets, and equity to total assets.
3.4 Analysis method
In this study, data analysis is performed by using discriminant analysis. The following equation is used for judging corporate financial distress: equation (1) for the earnings model and equation (2) for the cash flows model. 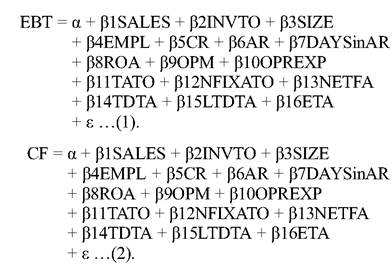
The effect of discriminant analysis on sample analysis is to determine whether the model can be used to predict corporate financial distress. If a model is statistically significant, the model is strong enough to predict corporate financial distress (Atmini & Wuryana 2005). The first step is done by carrying out the classical assumption test.
4 RESULTS AND DISCUSSION
4.1 Classical assumption test
The first test is testing the normality using Kolmogorov-Smirnov test. The result shows that both models are statistically significant at the level of 5 percent. The significance level of earnings model and cash flows model are 0.120 and 0.849, respectively. Thus, it is assumed that error of both models is normally distributed. Therefore, all the used data are normally distributed. The second test is heteroscedasticity testing using Glejser test. The result shows that the if significance values of the earnings model and cash value flows model are more than 5 percent, then there is no heteroscedasticity. The third one is testing Multicollinearity using the correlation coefficient among independent variables. The results found that the R values of any relation among independent variables in both earnings model and cash flows model are less than 0.8. This means that there is no multicollinearity or there is no linear relationship among independent variables. Finally, the fourth test is testing autocorrelation using Durbin Watson test. The output of the regression model for earnings model is 2.445, and for the cash flows model is 1.932. Durbin Watson test with significant level of 5 percent and samples total of 45 was dL =
0. 6915, and dU = 2.5856 was used. The models’ values are between dL and 4-dU. Therefore, there is no autocorrelation.
4.2 Earnings models
Table 1 presents the Wilks’ Lambda of the earnings model. Table 1 shows that the value of discriminant analysis for this model is statistically significant (sig = 0.000) at the level of 1 percent. Thus, earnings model has significant ability to predict corporate financial distress. Besides, Table 2 shows that the earnings model is able to predict corporate financial distress, in terms of whether company reports
Table 1. Earningsmodel.
Wilks’ Lambda
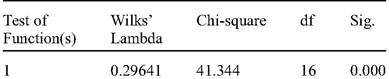
Table 2. Classification results.
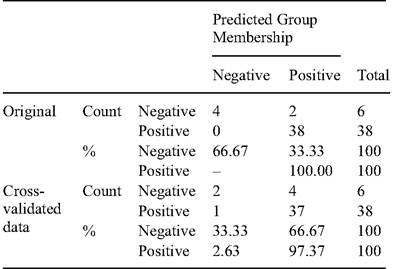
a Cross-validation is done only for those cases in the analysis. In cross-validation, each case is classified by the functions derived from all cases other than that case.
b 95.5% of original grouped cases correctly classified. c 88.6% of cross-validated grouped cases correctly classified.
Table 3. Holdout samples predicted earnings model.
negative earnings or positive earnings, with a total of 95.50 percent for the original grouped cases, and of 88.60 percent for the cross-validated grouped cases accurately.
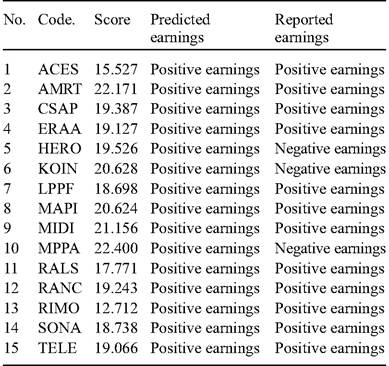
Further, to examine the power of earnings model in predicting corporate financial distress is to perform prediction on the holdout samples. The prediction of earnings model is as follows:
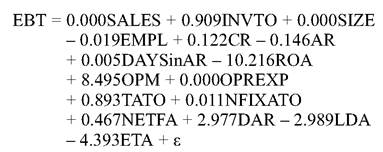
The model is used to determine the Z (EBT) scores of each firm in the holdout samples. Based on discriminant analysis, the centroids group A of firms with positive earnings is 3,788 and centroids group B of firms with negative earnings is 0.598. The optimal cutting score is calculated by basic formula as follows: ZCE = (ZA + ZB)/2, where ZCE = the critical cutting score between groups A and B, ZA = centroid for group A, and ZB = centroid for group B. The cutting score (Z) = (3.788 - 0.598)/2 = 1.595. This means that if a company has a score lower than 1.595, these companies are predicted to report negative earnings. Otherwise, companies would be predicted to report positive earnings when their score is higher than 1.595.
To determine the predictive accuracy of the earning model, we can see Table 3 which demonstrates that the earnings model is able to classify approximately 80 percent of holdout samples or 12 of 15 companies. Therefore, it can be seen that earnings model is powerful enough to predict corporate financial distress, since the number of holdout samples
Table 4. Cash flows model.
test indicates more than 50 percent classification accuracy.
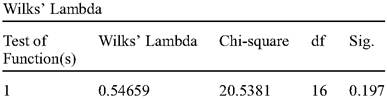
4.3 Cash flows model
Based on the Wilks' Lambda (see Table 4), we found that discriminant analysis for cash flows model is statistically insignificant (sig = 0.197 ≥ 1%) at α level of 0.01. Since the cash flows model is not significant, it cannot be used as a predictor model for corporate financial distress. Thus, there is no further testing of the holdout samples is needed.
5 CONCLUSIONS
The following results were obtained. The earnings model is strong enough to use as a model in predicting corporate financial distress. This model is able to predict correctly corporate financial distress of 95.5 percent for original grouped case by grouping companies into negative earnings and positive earnings. Further, holdout samples indicate that earnings model is able to classify 80 percent accurately, above 50 percent. Therefore, it can be concluded that the earnings model is a strong predictor model.
The cash flows model cannot be used as a predictive model of corporate financial distress, because of statistical insignificance. This model has
a significance level of 0.197 which is more than 1 percent. Thus, there is no further testing of the holdout samples required.
Investors, creditors, fund managers, and stockholders can use earnings model to screen out undesirable investments, and reduce losses by withdrawing investments from unhealthy retail merchandizing enterprises listed in IDX. Government and the market authorities can use earnings model as guideline to increase the transparency of regulatory objectives.
REFERENCES
Adeyemi, B. 2012. Bank failure in Nigeria: A Consequence of Capital Inadequacy, Lack of Transparecy and Non- Performane Loans. Bank and Bank System 6(1): 99-109.
Altman, E.I. 1968. Financial Ratios, Discriminant Analysis and the Prediction of Corporate Bankruptcy. The Journal of Finance 23(9): 589-609.
Atmini, S. & Wuryana, 2005. The Benefit of Earnings and Cash Flows to Predict Financial Distress Condition: Textile Mill Products, Apparel and Other Textile Products Listed in The Jakarta Stock Exchange. Call for Paper Accounting National Symposium VIII: 460-474.
Azis, A. & Lawson. G.H. 1989. Cash Flow Reporting and Financial Distress Models: Testing Hypotheses. Financial Management 19(1): 55-63.
Beaver, W.H. 1966. Financial Ratios as Predictors of Failure. Empirical Research in Accounting: Selected Studies. Journal of Accounting Research 4: 71-111.
Djongkang, F. & Rita, M.R. 2014. The Benefit of Earnings and Cash Flows to Predict Financial Distress Condition. Call for Paper Research Method and Organizational Studies.
Gilberst, L.R. Menon, K. & Schwartz, K.B. 1990. Predicting Bankruptcy for Firms in Financial Distress. Journal of Business Finance:161-171.
Isidro, L. & Marques, A.L. 2008. An Investigation of Thai Listed Firms’ Financial Distress Using Macro and Micro Variables. Multinational Finance Journal 3: 103125.
Lau, A.H. 1987. A Five State Financial Distress Prediction Model. Journal of Accounting Research 25: 127138.
Lie, E. & Lie, H.J. 2002. Multiples Used to Estimate Corporate Value. Financial Analysts Journal 58: 44-54
McCue, M.J. 1991. The Use of Cash Flow to Analyze Financial Distress in California Hospitals. Hospital and Health Service Administration 36: 223-241.
Ross, S.A. 1996. Corporate Finance. 4th edition, McGraw- Hill Companies.
Scherrer, P.S. 2003. Directors’ responsibilities and participation in the strategic decision-making process. Corporate Governance: International Journal of Business in Society 3(1): 86-90.
Sharma, D.S., 2001. The role of cash flow information in predicting corporate failure: the state of the literature. Managerial Finance 27(4): 3-28.
Tam, K.Y. & Kiang, M.Y. 1992. Managerial Applications of the Neural Networks: The Case of Bank Failure Predictions. Management Science: 926-947.
Ward, T.J. & Foster, B.P. 1997. A Note on Selecting a Response Measure for Financial Distress. Journal of Business Finance and Accounting 24(6): 78-869.
Warner, J.B. 1977. Bankrupcy Costs: Some Evidence. Journal of Finance 32: 337-347.
Whitaker, R.B. 1999. The Early Stages of Financial Distress. Journal of Economics and Finance 23: 123-133.
Wruck, K. 1990. Financial Distress, Reorganization, and Organizational Efficiency. Journal of Economics and Finance 23(2): 123-133.
More on the topic The use of earnings and cash flows model in predicting corporate financial distress: Evidence from retail merchandizing enterprises listed in IDX:
- DISCOUNTING CASH FLOWS
- Table of contents
- Abdullah A.G., Widiaty I., Abdullah G.U. (eds.). Global Competitiveness: Business Transformation in the Digital Era. Routledge,2019. — 325 p., 2019
- Lithuania
- Switzerland
- Tanzania
- Predicting the outcome of competition
- Serbia
- Ear Products Listed by Trade Names