Results
The most significant result of the model is the demonstration via computational simulation that an initially egalitarian, homogeneous society can quickly coalesce into a small number of much larger differentiated groups, as shown in Figs.
13.4 and 13.5.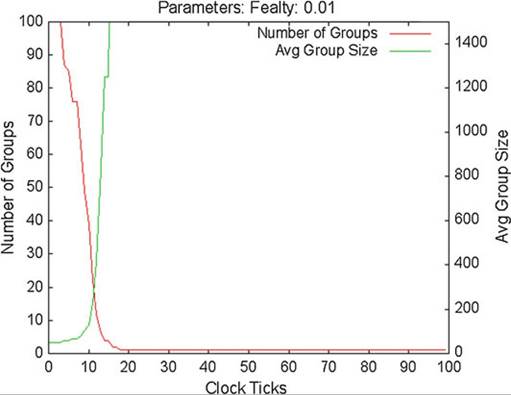
Fig. 13.4 Number of groups (red, scaled on the left) and mean group size (green, scaled on the right) for individual fealty payoff = 0.01
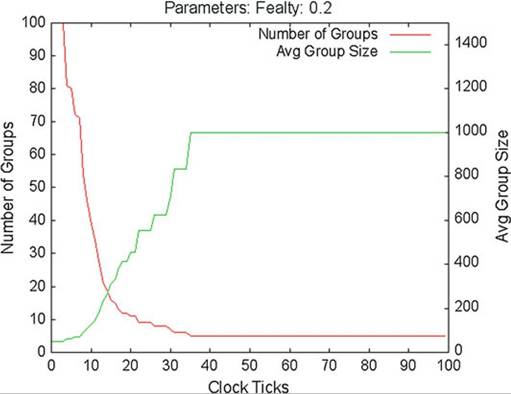
Fig. 13.5 Number of groups (red, scaled on the left) and mean group size (green, scaled on the right) for individual fealty payoff = 0.2
Polity emergence (i.e., politogenesis) occurs within the first 18 to 35 clock ticks of a simulation run. After initialization (100 groups, each with 50 members), society rapidly generates between 1 and 13 groups averaging between 384 and 5,000 members. Agents neither die nor are born in this model, so total population remains constant. The speed with which societal change occurs in the model (organizational phase transitions) varies with different input parameters. Interestingly, leadership scores have a positive linear effect on group size, although only the score of the leader is counted; that is, leadership scores are not additive within a group. Also, as the average number of groups increases, average fealty increases for up to between 5 and 6 groups, and average fealty decreases with increasing number of groups.
Additionally, results include a particular qualitative behavior in the trajectory of average fealty levels during model runs. As mentioned earlier, a fealty value is given to each agent at the start of each run, drawn from a triangular distribution between 0 and 100 with a mode of 50. Our results show that fealty quickly drops to relatively low values, becoming unstable, then recovering to a high value that remains stable for the remaining run time.
An example of this behavior is shown in Fig. 13.7. This phenomenon occurs under different initial conditions (parameter settings) and occurs at different speeds. But one case behaves differently. Here (see Fig. 13.6), average fealty falls as before, rises to the starting level, but then collapses to a very low value (Table 13.1).As groups decrease in number, the leadership score of remaining group leaders increases. (Recall that a leadership value is given to each agent at the start of each run, drawn from a triangular distribution between 0 and 100 with a mode of 10.) Few agents begin with high leadership score, by design. However, successful lead-
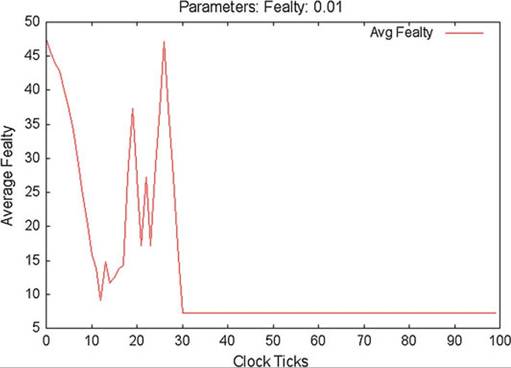
Fig. 13.6 Average group fealty for individual fealty payoff = 0.01
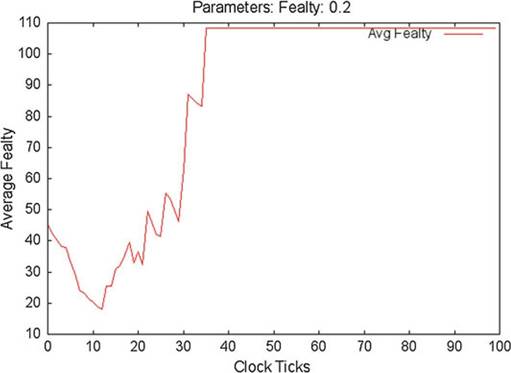
Fig. 13.7 Average group fealty for individual fealty payoff = 0.2
ers end model runs with leadership scores orders of magnitude higher than what they started with, as shown in Figs. 13.8 and 13.9. This result is illustrated by representative graphs of the evolution of leadership in two groups, a successful one (Fig. 13.11) and one that disbanded quickly (Fig. 13.10). These two groups also provide representative examples of change in membership (Figs. 13.12 and 13.13) and group fealty levels (Figs. 13.14 and 13.15).
Table 13.1 Table of model results for representative levels of individual fealty Payoff
| Fealty Payoff | Tick | Numb of groups | Avg size | Avg fealty | Leadership score |
| 0.01 | 18 | 1 | 5000 | 27.285 | 5079.352 |
| 0.1 | 31 | 4 | 1250 | 77.730 | 1281.403 |
| 0.2 | 35 | 5 | 1000 | 108.317 | 1011.797 |
| 0.25 | 33 | 13 | 384 | 64.488 | 396.870 |
| 0.3 | 32 | 12 | 416 | 78.023 | 426.149 |
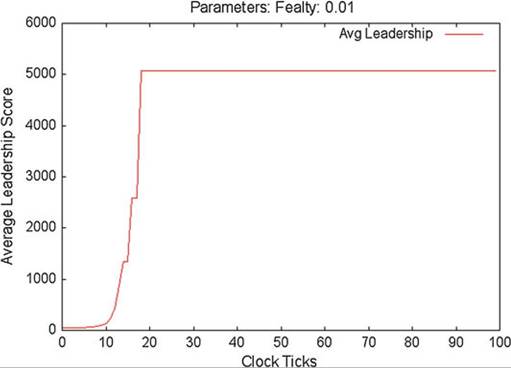
Fig. 13.8 Average leadership score for individual fealty payoff = 0.01
13.4
More on the topic Results:
- What the Test Results Mean
- ANALYSIS AND RESULTS
- RESULTS AND DISCUSSION
- Results and Findings
- Reform and Its Unintended Results
- The Cournede-Denk Results
- RESULTS
- Results
- RESULTS
- RESULTS AND ANALYSES
- ANALYSIS AND RESULTS