Herbivores can alter communities in dramatic ways
Herbivores can have equally large effects. Lesser snow geese (Chen caerulescens caerulescens) migrate from their overwintering grounds in the United States to breed in salt marshes that border Canada's Hudson Bay.
During the summer, the geese graze on marsh grasses and sedges. Historically, although the geese removed considerable plant matter, their presence benefited the marshes by adding nitrogen, which is a limiting resource for plant growth. As they eat, the geese defecate every few minutes, thereby adding nitrogen to the soil (nitrogen moves into the soil from goose feces more rapidly than it does from the decomposing leaves of marsh plants). The plants absorb the added nitrogen, which allows them to grow rapidly after being grazed. Overall, low to intermediate levels of grazing by geese lead to increased plant growth (Jefferies et al. 2003). For example, net primary production (NPP, measured as the amount of new aboveground plant growth) was higher in lightly grazed plots than in ungrazed plots (FIGURE 12.19A).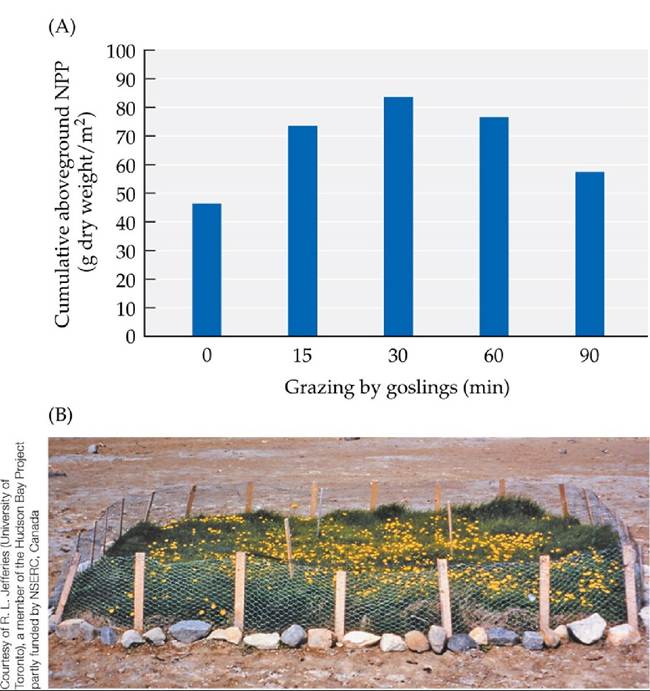
FIGURE 12.19 Snow Geese Can Benefit or Decimate Marshes (A)Whenlightlygrazed (for a single 15- to 90-minute episode) by snow goose goslings, salt marsh plants increased their subsequent cumulative production of new biomass compared with no grazing, because of the nitrogen added by the defecating geese. (B) Heavy grazing by high densities of snow geese can convert salt marshes to mudflats, as seen by comparing this small remnant of marsh (protected from geese) with the surrounding mudflat (a former marsh that was grazed heavily by geese). (A after D. S. Hik and R. L. Jefferies. 1990. JEcol 78: 180-195.) View larger image
About 40 years ago, however, the situation described in the previous paragraph
started to change. Beginning around 1970, lesser snow goose densities increased exponentially.
This increase probably occurred because increased crop production near their overwintering sites provided the geese with a superabundant supply of food. The ensuing high densities of geese no longer benefited marsh plants. The geese completely removed the vegetation, drastically changing the community of marsh plant species (FIGURE 12.19B). Of an original 54,800 hectares (135,400 acres) of intertidal marsh in the Hudson Bay region, geese are estimated to have destroyed 35% (19,200 ha or 47,400 acres). An additional 30% (16,400 ha or 40,500 acres) of the original marsh has been badly damaged by the geese. Controlled hunts (from 1999 on) have slowed goose population growth; this strategy may eventually lead to marsh recovery.In The Origin of Species, Darwin (1859) noted the speed with which Scotch fir trees replaced heaths after regions of heathland were enclosed to prevent grazing by cattle. When he observed heathlands grazed by cattle, “on looking closely between the stems of the heath, I found a multitude of seedlings and little trees, which had been perpetually browsed down by the cattle. In one square yard... I counted thirty-two little trees; and one of them, judging from the rings of growth, had during 26 years tried to raise its head above the stems of the heath, and had failed.” Darwin concluded that seeds dispersed from trees located at the edge of the heath would germinate and overgrow the heath if not for grazing by cattle. Thus, the very existence of the heath community in that area depended on grazing.
Herbivores can also have pronounced effects in aquatic environments. The golden apple snail was introduced into Taiwan from South America in 1980 for local consumption and export. The snail escaped from cultivation and spread rapidly through Southeast Asia (FIGURE 12.20). Its spread caught the attention of researchers and government officials because it proved to be a serious pest of rice. The snail has also been found in Hawaii, the southern United States, and
Australia and is expected to reach Bangladesh and India (Carlsson et al.
2004).
FIGURE 12.20 The Geographic Spread of an Aquatic Herbivore Sinceitsintroductionto Taiwan in 1980, the golden apple snail (Pomacea canaliculata) has spread rapidly across parts of Southeast Asia, threatening rice crops and native plant species. The map shows the regions the snail had occupied by 1985 and by 2002. (After J. O. L. Carlsson et al. 2004. Ecology 85: 1575-1580.) View larger image
Most freshwater snails eat algae, but the golden apple snail prefers to eat aquatic plants, including those that float on the water surface and those that attach themselves to the bottom. However, as mentioned in Concept 12.1, golden apple snails are generalists, and if plants are not available, they can survive on algae and detritus. As a result, these snails are resilient and hard to get rid of.
As a first step toward assessing how the snail had affected natural communities, Nils Carlsson and colleagues surveyed 14 wetlands in Thailand with varying densities of snails. They found that wetland communities with high densities of snails were characterized by few plants, high nutrient concentrations in the water, and a high biomass of algae and other phytoplankton (FIGURE 12.21).
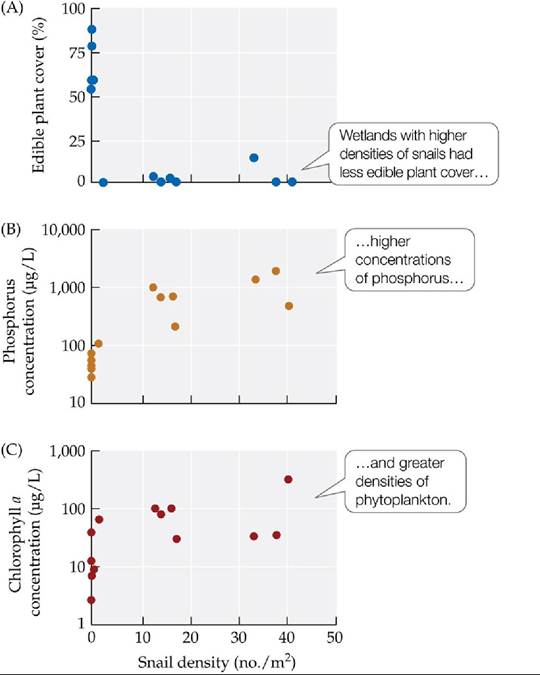
FIGURE 12.21 A Snail Herbivore Alters Aquatic Communities NilsCarlssonand colleagues measured characteristics of 14 natural wetlands in Thailand that differed in their densities of golden apple snails (Pomacea canaliculata). (A) Percentage of the wetlands covered by edible plant species. (B) Concentrations of phosphorus in the water. (C) Chlorophyll a concentrations (an indicator of phytoplankton biomass). Note the log scale in (B) and (C). Experiments conducted separately indicated that all the trends shown here could have been caused by the snail.
In (B), compare the average total phosphorus concentration in wetlands without snails with that in wetlands with snails.
(After J. O. L. Carlsson et al. 2004. Ecology 85: 1571-1580.) View larger image
To test whether the trends observed in their survey could have been caused by the snail, Carlsson et al. (2004) placed 24 1 ? 1 ? 1-m enclosures in a wetland in which snail densities were low. To each enclosure, they added about 420 g of water hyacinth (Eichhornia crassipes), one of the most abundant plant species in many Southeast Asian wetlands. Next, they added 0, 2, 4, or 6 snails to the enclosures; there were six replicates of each of the four snail density treatments. Carlsson and colleagues then measured the effects of the snails on plant biomass and phytoplankton biomass. Water hyacinth biomass increased in the enclosures where no snails were present but decreased in all the other enclosures. At the highest snail density tested (6 snails/m2), phytoplankton biomass increased.
The results of the survey and the experiment concur in suggesting that the golden apple snail can have an enormous effect on wetland communities, causing a shift from a wetland with clear water and many plants to a wetland with turbid water, few plants, high nutrient concentrations, and high phytoplankton biomass. It is likely that this shift occurs because the snails suppress plants directly (by eating them) and because they release the nutrients they obtain from the plants into the water, thus providing improved growth conditions for algae and other phytoplankton.
Climate Change Connection
Climate Change and Species Interactions
Climate affects the physiology of organisms, the distribution and abundance of populations, and the outcome of interactions between species (see Chapter 2). As a result, changes in climate are expected to have wide-ranging effects on species interactions and thus ecological communities (Gilman et al. 2010). For example, in a review of over 600 articles, Tylianakis et al. (2008) found that climate change affected the strength and frequency of a wide range of ecological interactions (FIGURE 12.22).
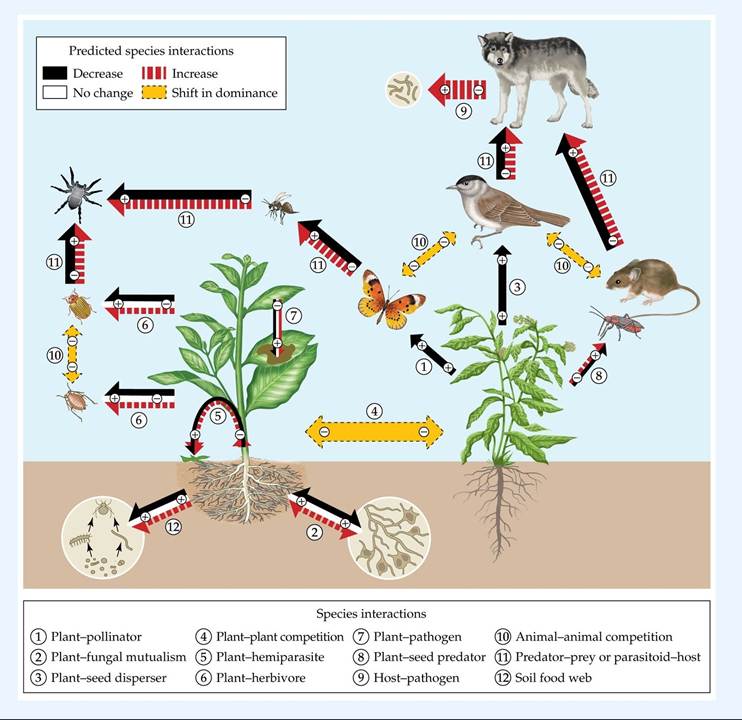
FIGURE 12.22 Climate Change Alters Species Interactions This diagram provides an overview of a literature review of how climate change is predicted to alter species interactions in terrestrial systems, including some with parasites, in studies that tested for the effects of increased temperature, changing rainfall patterns, or increased frequency of extreme weather events. Arrows with solid outlines indicate nutrient and energy flow; double-headed arrows with dotted outlines indicate competition. A + or - symbol within an arrow indicates benefit or cost to each participant. (After J. M. Tylianakis et al. 2008. Ecol Lett 11: 1351-1363.) View larger image
Collectively, these results suggest that species interactions are likely to complicate efforts to predict how climate change will affect predator-prey relationships. For example, although the direct effects of climate on predators or herbivores might suggest that these species would extend their ranges in response to climate change, competition with other species could prevent this from occurring. If competition had this effect, then interactions with other organisms would have caused the actual distribution of a species under climate change to be smaller than its potential distribution (see Figure 4.3). In other circumstances, however, a very different result might be observed. For example, as discussed in Concept 25.2, changes in climate can lead to the formation of new types of communities that contain collections of species that differ from those found in current communities. In such a new community type, a predator might interact with new prey or hosts and hence might expand its geographic range farther than would otherwise be expected. In this case, over time, the actual distribution of the predator would become larger than its (predicted) potential distribution because of changes in community structure that resulted from climate change.
Overall, the results of Tylianakis et al. (2008) and Gilman et al. (2010) indicate that ecological interactions will influence how future climate change will affect predator-prey interactions and many other species associated with these interactions.A Case Study Revisited
Snowshoe Hare Cycles
What is the cause of snowshoe hare population cycles? As we saw in the Case Study, neither the food supply hypothesis nor the predation hypothesis alone can explain these cycles. However, much of the variation in hare densities can be explained when we combine these two hypotheses—and add even more realism with a few new twists.
Charles Krebs and colleagues (1995) performed an experiment designed to determine whether food, predation, or their interaction caused population cycles in hares. The sheer scope of the experiment was impressive: the experimental treatments were performed in seven 1 ? 1-km blocks of forest located in an isolated region of Canadian wilderness. Three blocks were not manipulated and were used as controls. Food for hares was added to two blocks (the “+Food” treatment). In 1987, an electric fence 4 km in length was constructed to exclude predators from one block of forest (the “-Predators” treatment). In the following year, a second 4-km fence was built; in the block of forest enclosed by this fence, food was added and predators were excluded (the “+Food/-Predators” treatment). The two fences (with a total length of 8 km) had to be monitored daily during the winter, when temperatures could plummet to -45°C (-49°F); this monitoring required so much time that the researchers could not replicate either fenced treatment. The survival rates and densities of hares in each block of forest were observed for 8 years.
Compared with the control blocks, hare densities were considerably higher in the +Food, the -Predators, and the +Food/- Predators blocks (FIGURE 12.23). The most pronounced effects were seen in the +Food∕-Predators block, where, on average, hare densities were 11 times those in the control blocks. The strong effect of jointly adding food and removing predators suggests that hare population cycles are influenced by both food supply and predation.
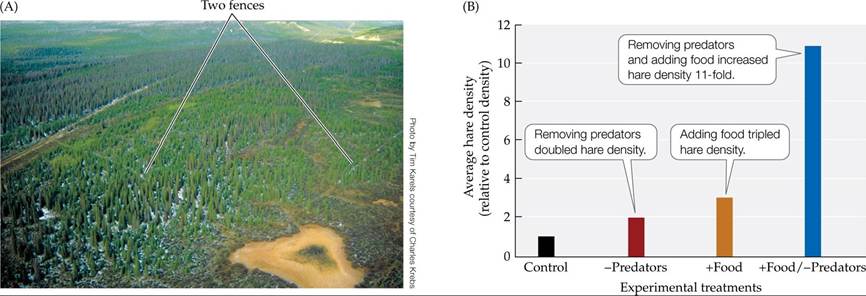
FIGURE 12.23 Both Predators and Food Influence Hare Density (A)Thisaerial photograph shows one of the 1-km2 snowshoe hare study sites described in the text. (B) Average hare densities relative to their densities in control blocks of forest. (B after C. J. Krebs et al. 1995. Science 269: 1112-1115.) View larger image
This conclusion was supported by results from a mathematical model that examined feeding relationships across three levels: vegetation (the hares' food), hares, and predators (King and Schaffer 2001). Field data were used to estimate the model parameters, and the model's predictions were compared with the actual results for Krebs et al.'s four treatments. Although the match was not exact, there was reasonably good agreement between the model and the results, again suggesting that both food and predators influence hare population cycles (FIGURE 12.24).
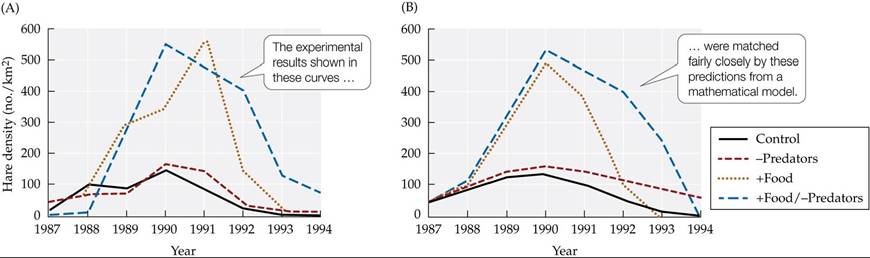
FIGURE 12.24 A Vegetation-Hare-Predator Model Predicts Hare Densities Accurately The model assumes that hare population densities are influenced by feeding relationships across three levels: vegetation (the hares' food), hares, and predators. Parameters for the model were estimated from field data. when the investigators compared the predictions of their model with the experimental results of Krebs et al. (1995), they found a reasonably good match between (A) the experimental results and (B) the model's predictions. (After A. A. King and W. M. Schaffer. 2001. Ecology 82: 814-830.) View larger image
While much progress has been made in the study of snowshoe hare population cycles, some questions remain. We do not yet have a complete understanding of the factors that cause hare populations across broad regions of Canada to cycle in synchrony. Lynx can move from 500 to 1,100 km. If lynx move from areas with scarce prey to areas with abundant prey on a scale of hundreds of kilometers, their movements might be enough to cause geographic synchrony in hare cycles. In addition, large geographic regions in Canada experience a similar climate, and that may also affect the synchrony of hare population cycles.
Finally, the Krebs et al. experiment provided a test of whether the addition of food or the removal of predators (or both) could stop the hare population cycle. Although hare densities declined less in the +FoodZ-Predators block than in the control blocks, they did decline at the usual point in the hare cycle. Why did the +FoodZ- Predators treatment fail to stop the cycle? One possible reason is that the fences excluded lynx and coyotes but did not exclude owls, goshawks, and other birds of prey. Collectively, these bird predators accounted for about 40% of snowshoe hare deaths and thus could have contributed to the onset of the decline phase of the hare cycle in the +FoodZ-Predators block. Next we'll explore another possible explanation: stress caused by fear of predator attack.
(
Connections in Nature
From Fear to Hormones to Population Dynamics
Predators not only affect their prey directly (by killing them) but also influence them indirectly (e.g., by altering their foraging behavior, as described for elk in Concept 8.2). Boonstra et al. (1998) tested snowshoe hares for another possible indirect effect of predators: fear. Their results hint at a fascinating way in which predation might influence the decline phase of the hare cycle.
When humans are in a dangerous situation, we often engage a set of fight-or-flight responses that can produce rapid and sometimes astonishing results (such as the ability to move unusually heavy weights). Snowshoe hares have a similar stress response. A hormone called cortisol stimulates the release of stored glucose into the blood, where it becomes available to the muscles; cortisol also suppresses body functions that are not essential for immediate survival, including growth, reproduction, and immune system function (FIGURE 12.25).
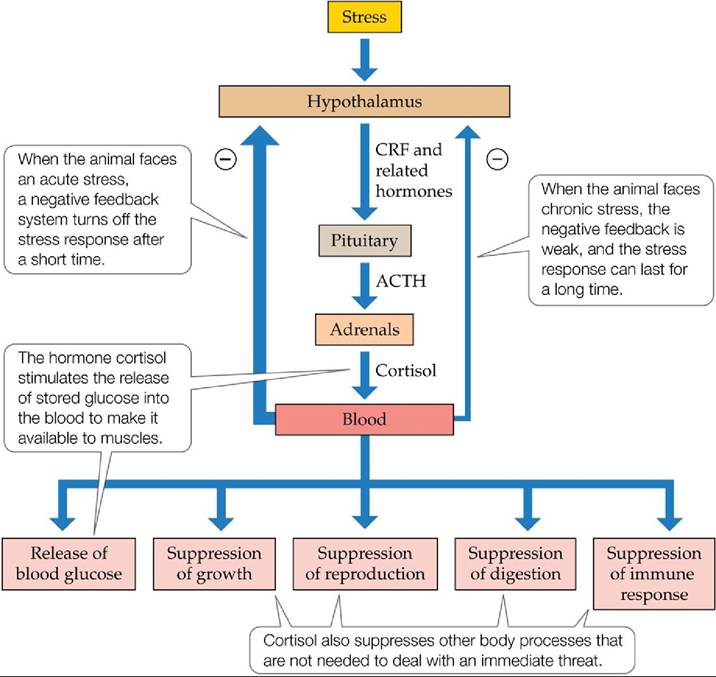
FIGURE 12.25 The Stress Response When an animal is stressed, the hypothalamus releases a hormone called CRF, which stimulates a cascade of reactions that affect a number of body processes. (After R. Boonstra et al. 1998. Ecol Monogr 79: 371394.) View larger image
The stress response works well for immediate, or acute, forms of stress, such as an attack by a predator. Energy is provided to the muscles rapidly to help the animal deal with the threatening situation. Shortly thereafter, the response is shut down by a negative feedback process. The stress response works less well for longterm, or chronic, stress, however. In such cases, the negative feedback signals are weak, and the stress response is maintained for a long time. A failure to “turn off” the stress response can have harmful effects, including decreased growth and reproduction and increased susceptibility to disease. Collectively, such effects can reduce a population’s survival and reproductive rates.
When predators are abundant, as we have seen, they can cause up to 95% of snowshoe hare deaths. At such times, hares are at increased risk of encountering predators; hares would also be likely to see or hear predators killing other hares and to find the remains of hares that had been killed by predators. Reasoning that the fear provoked by such events could trigger chronic stress, Boonstra and colleagues measured the hormonal and immune responses of hares exposed in the field to high versus low numbers of predators. During the decline phase of the hare cycle (when hares are exposed to many predators), cortisol levels increased, blood glucose levels increased, reproductive hormone levels decreased, and overall body condition worsened—as expected for hares experiencing chronic stress (see Figure 12.25). Further experiments showed that a predator-induced increase in cortisol levels led to a drop in the number and size of offspring produced by female snowshoe hares (Sheriff et al. 2009). In addition, female hares with high cortisol levels (caused by exposure to predators) transmitted high cortisol levels to their offspring, who also had reduced reproductive rates (Sheriff et al. 2010).
Overall, chronic stress induced by predation may help to explain some of the puzzling observations mentioned in the Case Study, including the drop in birth rates during the decline phase of the hare cycle and the slow rebound of hare numbers after predator numbers plummet. If future studies confirm the results of Boonstra et al. (1998) and Sheriff et al. (2009, 2010), their work will provide a clear example of how predation risk can alter the physiology of individual prey, thereby changing prey population dynamics and influencing predator-prey cycles.
More on the topic Herbivores can alter communities in dramatic ways:
- Carnivores can alter communities in dramatic ways
- Positive interactions can alter communities and ecosystems
- CONCEPT 13.5 Parasites can alter the outcomes of species interactions, thereby causing communities to change.
- Most herbivores have relatively narrow diets
- Hunting communities Agricultural communities The "Indo-European" influence The Vedic period The ritual system
- CONCEPT 12.1 Most carnivores have broad diets, whereas a majority of herbivores have relatively narrow diets.
- Evolution can alter ecological interactions
- 1 Direction to provide or alter fixed equipment
- Individuals often alter their foraging decisions when predators are present
- Ways of Knowing
- Attempting to Alter the Legal Framework: the Arbitration and Mediation Services (Equality) Bill
- The history of HIV is brief but dense. It is filled with aggressive debates, politics, human tragedy, a rich vein of research in medical science, and a dramatic change in drugs and tests in 1996 that translated immediately into better health and longer life.
- 3.4 MULTIPLE STRATEGIES AND DIVIDED COMMUNITIES
- POSSIBLE WAYS FORWARD