SUMMARY
CONCEPT 12.1 Most carnivores have broad diets, whereas a majority of herbivores have relatively narrow diets.
12.1.1 Understand why carnivores tend to be generalists and have broad animal prey diets.
Most carnivores eat prey in relation to their availability across a broad range of prey species.
When the encounter rate and handling time for prey is low, as is the case for carnivores, they tend to be broad in their prey choices.
12.1.2 Know why herbivores tend to be specialists and have narrow plant prey diets.
Many herbivores specialize on particular plant parts, such as leaves, roots, stems, seeds, or internal fluids, and specialize on one or a few plant species.
Herbivores tend to be specialists because plants are relatively easy to search for but their handling times are longer, thus favoring specialization.
CONCEPT 12.2 Predation results in a wide range of capture and avoidance mechanisms.
12.2.1 Know the search and capture mechanisms of carnivores and the ways animal prey avoid being eaten.
Many predators move about their habitat in search of prey to capture; others remain in one place and attack or trap prey that are within striking distance.
In response to strong selection pressure exerted by carnivores, prey have evolved a rich variety of defensive mechanisms, including physical defenses, toxins, mimicry, or behavioral responses to escape predation.
12.2.2 Describe how plants avoid being eaten and how herbivores can overcome these defenses.
Plants cope with herbivory via masting and other forms of avoidance, compensation (a form of tolerance), and secondary chemicals that deter herbivores.
Although a plant's defensive mechanisms prevent most herbivores from eating it, some herbivores can overcome the plant's defenses by structural, chemical, or behavioral means.
CONCEPT 12.3 Predator populations can cycle with their prey populations.
12.3.1 Know how to model predator and prey population cycling.
Results from mathematical predator-prey models, laboratory experiments, and field observations show that population cycles can be caused by trophic interactions.
The Lotka-Volterra predator-prey model suggests that predator and prey populations have an inherent tendency to cycle because the abundance of one population is dependent on the abundance of the other population.
The relationship between prey and predator populations can be determined by solving for the population growth equation of each species when they reach the zero growth isocline.
12.3.2 Describe the factors that affect whether predator-prey populations cycle.
Whether predators and prey cycle may depend on several factors, including habitat complexity and dispersal rates, spatial refuges, and evolutionary changes.
CONCEPT 12.4 Predation can affect prey distribution and abundance, in some cases causing a shift from one community type to another.
12.4.1 Understand how predators can affect prey distribution and abundance.
Predators can affect the distribution and abundance of their prey by decreasing their growth, reproduction, and/or survival.
12.4.2 Describe how carnivores and herbivores can alter communities in dramatic ways.
Predation can dramatically alter the composition of ecological communities by directly affecting the abundance of dominant or multiple species of prey.
Predators can also indirectly affect communities by controlling the abundance of dominant prey, which interact strongly with other
species.
REVIEW QUESTIONS
1. Compare and contrast the diet breadth of carnivores and herbivores, and hypothesize why these differences exist.
2. Summarize the effects that carnivores and herbivores have on their prey, as well as the effects that prey have on the carnivores and herbivores that eat them. Explain why these effects are pervasive and pronounced.
3. In this chapter, we claim that predation can have strong effects on ecological communities.
a. Provide a logical argument to support this claim.
b. Does the scientific evidence support or contradict this claim? Explain.
HONE YOUR PROBLEM-SOLVING SKILLS
In the Case Study of this chapter, we considered a nearly 100-year record of the Hudson's Bay Company to estimate abundances of snowshoe hares and their Canada lynx predators (Lynx canadensis). Both species exhibited regular population cycles, with abundances peaking about every 10 years and then falling to low levels (see Figure 12.2A). Suppose for the purposes of this problem that you know the following components of the relationship between snowshoe hare and lynx:
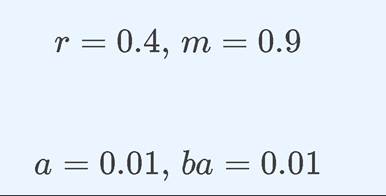
1. Using the values above, calculate the isoclines for prey and predator. Then, graph the isoclines for each species. Label all your axes and isoclines.
2. You are given the following abundance data for prey and predator for two different time periods where the prey or predators cross their respective isoclines:
Time 1: 90 prey, 30 predators
Time 2: 100 prey, 40 predators
Plot the population abundances of both species for Time 1
and Time 2 on your graph. Now, given Lotka-Volterra model assumptions, determine the abundances for Time 3 (predator crosses its isocline) and Time 4 (prey crosses its isocline). Describe, and draw on the graph, what will happen to both populations over time.
3. Now, plot the abundance of both prey and predators over time, starting with Time 1 and ending at Time 5.
4. Suppose the population sizes of prey and predators at Time 1 were those values where the isoclines cross. Plot the abundances of both prey and predators over time starting with Time 1 and ending at Time 5. Describe what will happen to both populations over time.
LIST OF KEY TERMS
Amensalisms carnivory
Commensalism
Compensation
Competition
crypsis facilitations herbivory host induced defense isocline
Lotka-Volterra predator-prey model mimicry mutualisms non-trophic
parasite parasitism
Parasitoids
Predation
predator
prey
secondary compounds symbiosis
trophic
warning
More on the topic SUMMARY:
- Summary
- Summary
- Summary
- Summary
- Summary
- Summary
- Summary
- SUMMARY
- SUMMARY
- SUMMARY
- SUMMARY
- SUMMARY
- SUMMARY
- SUMMARY
- Summary
- Summary