Terrestrial and oceanic NPP are nearly equal
Chris Field and colleagues estimated total planetary NPP to be 105 petagrams (1 Pg = 1015 g) of carbon per year, based on remote sensing data collected over multiple years (Field et al.
1998). They determined that 54% of this carbon is taken up by terrestrial ecosystems, while the remaining 46% is taken up by primary producers in the oceans. Their estimate of oceanic NPP (which comes to 48 Pg C/year) was considerably higher than previous estimates. Despite the similar contributions of land and oceans to total global NPP, the average rate of NPP on the land surface (426 g C∕m2∕year) is higher than that in the oceans (140 g C∕m2∕year). The lower rate in the oceans is compensated for by the greater percentage (70%) of Earth's surface they cover.Most of the surface of both oceans and land is dominated by areas with relatively low NPP (see Figure 20.7). The highest rates of NPP on land are found in the tropics (FIGURE 20.17). This pattern results from latitudinal variation in climate and in the length of the growing season. Higher latitudes have shorter growing seasons and sparse short-statured plants, and low temperatures constrain nutrient supply by lowering decomposition rates, which in turn limits NPP.
Tropical zones have long growing seasons and high rates of precipitation, promoting high rates of NPP. NPP declines to the north and south of the tropics at about 25°, reflecting the increasing aridity associated with the high-pressure zones generated by the descending air of the Hadley cells (see Concept 2.2). Another peak in terrestrial NPP occurs at the northern mid-latitudes, where the temperate forest biome is found. NPP in the mid- to high latitudes shows strong seasonal trends, with peaks in summer and declines in winter. In contrast, seasonal trends in the tropics are often slight and are associated with wet-dry cycles.
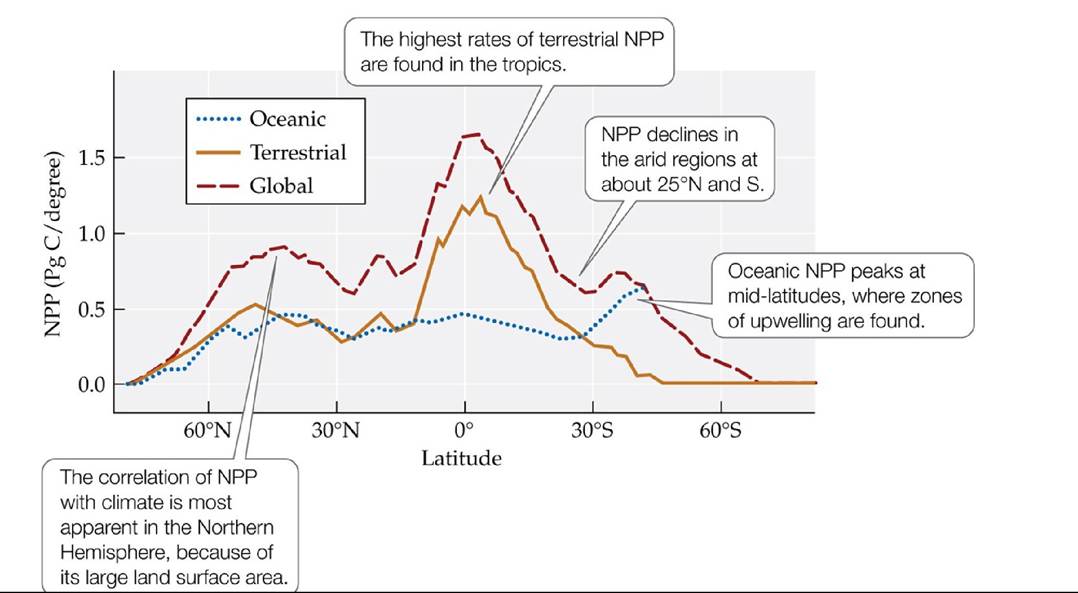
FIGURE 20.17 Latitudinal Variation in NPP These estimates of NPP are based on satellite remote sensing data. Note the strong correlation of the terrestrial pattern with patterns in global average annual temperature (see Figure 2.14) and precipitation (see Figure 2.16). (After C. B. Field et al. 1998. Science 281: 237-240.) View larger image
Oceanic NPP peaks at the mid-latitudes between 40° and 60° (see Figure 20.17).
These peaks are associated with zones of upwelling, areas where ocean currents bring nutrient-rich deep water to the surface (see Concept 2.2). High NPP is also associated with estuaries at these latitudes. Seasonal trends in NPP occur in the oceans, but their magnitude is less than on the land surface.
More on the topic Terrestrial and oceanic NPP are nearly equal:
- NPP changes during ecosystem development
- SUMMARY
- Which biomes and marine biological zones have the highest NPP and, as a consequence, the greatest effect on atmospheric CO2 dynamics?
- Differences among biomes in NPP reflect climate and biotic variation
- Net secondary production is equal to heterotroph growth
- Terrestrial biomes reflect global patterns of precipitation and temperature
- NPP in terrestrial ecosystems is controlled by climate
- NPP can be estimated by a number of methods
- In the course of just 75 years, the Spanish Empire went from being a leading transoceanic political entity to being a second-ranked player.1
- Ecological responses to climate change are occurring