OUTSTANDING ISSUES
This section discusses a number of issues that extend the existing literature on income gaps and income inequality described earlier.
13.4.1 Inequality and Other Outcome Variables
The discussion to date has considered individuals’ relationship to others’ incomes purely in the sense of “do they like it or not,” whether that be revealed by survey information on subjective well-being or behavior in experiments.
At the risk of opening a Pandora’s box of other possible dependent variables, this is far from being the only outcome of interest. A number of other possible outcomes have been investigated across the social sciences. The following is a brief sample of some recent areas of research in this respect.de Vries et al. (2011) tested the hypothesis that income inequality may produce individuals who are more competitive and less friendly toward others. These latter attitudes are captured by the Big Five personality factor of Agreeableness, which now appears in a number of surveys.[867] The regression analysis in de Vries et al. (2011) is based on almost 700,000 observations between 2001 and 2009 from an American web-based survey aimed at measuring personality. Agreeableness scores are significantly negatively correlated with state-level income inequality (as measured by the Gini coefficient on pretax household income matched in from the 2000 Census). This individual-level personality finding can be argued to be consistent with the considerable amount of existing evidence on aggregate inequality and measures of violent behavior. See Daly et al. (2001) for evidence on Canadian provincial-level murder rates and Macours (2011) for the role of district-level income inequality (over a period of income growth) in fueling civil conflict (as measured by mass abductions by Maoist rebels) in Nepal.
Loughnan et al. (2011) analyzed self-enhancement, which is the propensity to see yourself as being better than the average.
They considered the relationship between self-enhancement and income inequality, with the argument that the gain from being better than others will be larger in more unequal societies. They administered a selfenhancement questionnaire to (mainly student) samples across 15 countries. In these questionnaires, respondents were asked about 20 different desirable characteristics. For each characteristic, they said whether they have more, the same, or less of it than the average student (or average person, in the nonstudent samples). They first showed that respondents on average think they have more of the characteristic than the average in 14 out of 15 countries (the exception is Japan). They further demonstrated that selfenhancement is greater in countries with a higher Gini coefficient. This relationship is resistant to the introduction of a range of individual-level psychological variables.In DeBruine et al. (2011), data from almost 5000 women aged 16-40 across 30 developed countries shows that women’s preferences for facial masculinity are negatively correlated with a composite measure of country health: The value of masculinity as a proxy for developmental health is greater in countries where health is on average worse. Brooks et al. (2011) built on this work by noting that facial masculinity may also matter via the spread ofthe benefits that it confers. In the same way that a greater dollar return to higher rank in a golf tournament seems to lead to greater effort by players (Ehrenberg and Bognanno, 1990), any signal predicting competitive success is more valuable when rewards are more spread out. They hence match in data on the national Gini coefficient (from the United Nations Statistics Division) to DeBruine et al.’s original preference data. Their subsequent empirical analysis suggests that national income inequality is a better predictor of female preferences for facial masculinity than is national health.
Van de Werfhorst and Salverda (2012), in their introduction to a special issue of Research in Social Stratification and Mobility, suggested that income inequality at the national level is associated with a number of observable and attitudinal outcome variables.
A number of the papers contained in this special issue go on to examine in detail the negative relationships between income inequality, on the one hand, and all of solidarity toward others, expressed support for democracy, and actual political participation.Rothstein and Uslaner (2005) simultaneously estimated a measure of generalized trust and income inequality (the Gini coefficient). They concluded that inequality does indeed significantly diminish trust, whereas the estimated coefficient on trust in the income inequality equation is negative but insignificant. These findings have recently been critically reevaluated by Steijn and Lancee (2011), who specifically underlined the potential importance ofnon-Western countries with particularly high levels of income inequality and a confounding role of national wealth. Their regressions on Western country data (from the International Social Survey Programme, ISSP, and European Social Survey, ESS) show that the bivariate correlation between income inequality and trust is negative and significant, but that this relationship becomes insignificant in multivariate analysis once wealth is controlled for.
We are not necessarily arguing here that these additional potential attitudinal[868] correlates of income inequality are to be considered separately and in isolation. Rather, we think that they indeed represent some of the channels via which income inequality leads through to overall well-being outcomes (and to those regarding individual health, on which there is a substantial literature that we have not covered here; see Chapter 17).
13.4.2 Other Measures of Different Aspects of the Distribution of Income All our discussion of attitudes toward the distribution of income has been in terms of gaps to others in the reference group, in Section 13.2, and a normalized sum of all the gaps in society, as the Gini coefficient in Section 13.3. We have presumed that these are indeed the salient measures of others’ income.
But we do not know that for sure.[869]Consider two log-normal distributions of income, where one is a horizontal displacement of the other, as in Figure 13.1. Which is the most unequal? If we are not in the income distribution then our (normative) evaluation of the dispersion in these two curves depends on which distribution measure we choose. Some measures of various aspects of the distribution ofincome are identical across the two; this is the case for the absolute Gini coefficient, the variance, the interquartile range, and the percentage of the population in relative poverty (as defined as income below 60% of the median, say). Other measures are
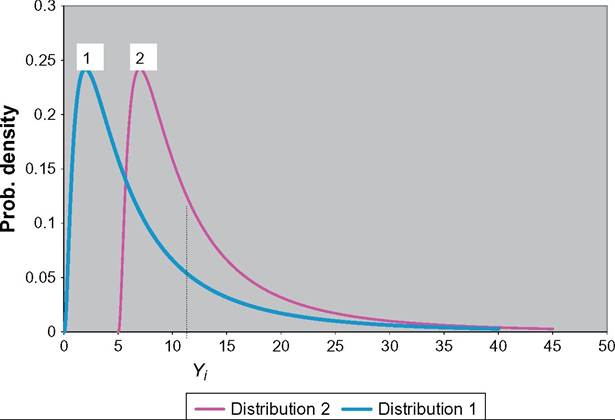
Figure 13.1 Two log-normal income distributions, with the same variance.
not the same in distributions 1 and 2: the percentage in absolute poverty, the relative Gini coefficient, and the D9/D1 or D5/D1 ratios.
If the individual making the evaluation is in the income distribution, then their evaluation will also depend on their own income position; this is the comparative evaluation. At an income of Yi, an individual will feel more deprived in distribution 2 than in distribution 1; their relative deprivation will be higher (more people above them), and their satisfaction will be lower (fewer people beneath them).
We have considered the relationship between objective measures of inequality, such as the Gini, and subjective well-being. But do people actually know what the value ofthe regional or national Gini coefficient is? Individuals’ perceptions ofthe degree ofinequal- ity around them may not be well reflected in the Gini coefficient, and equally they may believe the distribution of income to be different from what is actually measured in statistics.
Macunovich (2011) is an intriguing contribution using the fourth (2005) wave ofthe WVS. She analyzed not only the Gini coefficient, but also two measures of crowding at the bottom of the distribution: the ratio of the number of people who say that they are in the lowest income decile in the country to the number who say that they are in the highest, and the same ratio with respect to self-reported social class.
Although the Gini coefficient continues to exhibit a positive correlation with both happiness and life satisfaction, the estimated coefficients on these two ratios are negative and often significant. This might be thought of as consistent with some of those at the bottom providing a negative signal (as in D’Ambrosio and Frick, 2012), or more generally with some negative externalities in society associated with poverty.O’Connell (2004) used information on (the log of) the income received by the top quintile in a country to that received by the bottom quintile. This is shown to be negatively associated with life satisfaction in an aggregate-level analysis of 15 EU countries in Eurobarometer data over the 1995-1998 period.
Some of the work appearing in Table 13.1 uses a variety of measures of income distributions. Both Tomes (1986) and Brodeur and Fleche (2013) considered the bottom end of the distribution, with the former including the share of income earned by the bottom 40%, and the latter the county-level percentage in poverty according to three separate definitions.
In general, however, very few contributions here have tested different measures against each other in a beauty contest to see which one is the most salient correlate of subjective well-being. Ebert and Welsch (2009) is relatively unusual in this literature in that they did consider a wide class of inequality indices comprising the Atkinson and Gini family as special subclasses (see Ebert, 1988) and evaluated their effects on individual reported life satisfaction in 20 years of Eurobarometer data. As the self-reported income data in the Eurobarometer is not sufficiently good to allow detailed measures to be computed from within the data set, these latter are matched in from the Luxembourg Income Study (LIS), which somewhat reduces the number of countries that can be used in the empirical analysis.[870] [871] Ebert and Welsch started by considering the Gini, Atkinson 0.5, and Atkinson 1.0 indices. A last point with respect to the question of “which measure of others’ income” is that existing work has very much concentrated on cardinal measures of comparisons, as picked up by income gaps and Gini coefficients. Although there is likely some role for such comparisons, it also seems probable that individuals are rank-sensitive. Some previous work has considered the role of income rank in determining well-being. In Brown et al. (2008), income rank is shown to outperform average reference group income in three satisfaction equations (influence over the job, achievement, and supervisor’s respect): see also Clark et al. (2009a) for economic satisfaction and Boyce et al. (2010) for life satisfaction. In the field experiment in Card et al. (2012), information on the individual’s revealed rank in the income distribution was more important in determining their satisfaction than was the relative wage level. Clark et al. (2010) appeal to both survey and experimental evidence on the role of relative income in determining the level of effort that workers supply. In both types of data, the individual’s rank in the income distribution is a more powerful determinant of their effort decision (as measured by the log-likelihood) than is the relation of the individual’s own income to mean income in the reference group. Mujcic and Frijters (2013) came to the same conclusion in the analysis of hypothetical choice data from a sample of just over 1000 Australian students. Finally, Clark and Senik (2014) appealed to Chinese panel data from Guizhou province, in which all households in the village were interviewed. This complete data allows household rank in the village income distribution to be determined. Being at the top (top decile) or bottom (lowest 25%) of the income distribution seems to matter disproportionately for satisfaction with income. It may also be the case that not all ranks are of equal importance, so that the correlation between income rank and subjective well-being is nonlinear. The experimental and survey results in Kuziemko et al. (2014) underline the importance of the aversion to being last in the distribution. Experimental subjects accept gambles, which may move them out of last place that they reject if anywhere else in the distribution. Equally, subjects randomly placed in second-to-last place in modified-dictator games are the most likely to give money to the person one rank above them instead of the person one rank below. One implication is that the relatively poor may oppose redistribution if it is especially targeted at those who are just beneath them in the income distribution. Survey data does indeed show that respondents who earn just above the minimum wage are those who are the most likely to oppose any rise in the minimum wage. These kinds of rank comparisons are of great interest. They do imply a role for inequality in the determination of individual well-being in that, given own income, a mean-preserving spread of income in the reference group implies lower individual rank. However, at the societal level this will not matter. By construction, rank is zero-sum: My loss must be offset by others’ gains. Unless we have heterogeneity in the taste for rank (as in Frank, 1985), the degree of inequality will here not affect the way in which income comparisons affect overall well-being. 13.4.3 Fairness and Preferences for Redistribution The measures of income distribution used in the preceding literature have been objective: They measure what others in the society actually earn. This is of course not necessarily what individuals believe that others earn, and it may well be this latter, and its relation to what it is believed that others should earn, that is the most important for determining individual attitudes toward inequality. Almost no one in our societies thinks that everyone should receive the same income. Incomes differ often for very good reasons, such as number of hours of work for example. In general, we can think of the causes of income distribution as being partitioned into factors for which the individual is responsible and those for which she is not (see Fleurbaey, 1995). These are respectively referred to as effort and circumstances in the literature on the equality of opportunity (see Chapter 4 of this volume for a survey in great detail).[872] Almas et al. (2011) proposed the measurement of a “responsibility-sensitive” fair income distribution. This is applied to 1986-2005 Norwegian data. They show that although the Gini index fell over this period, unfair income inequality actually rose. Further, the pretax unfair income Gini rose less than the posttax unfair income Gini, so that the tax system has become less profair. An alternative approach to fairness, which does not require the explicit distinction of responsibility and nonresponsibility factors, is to explicitly ask individuals about how much they think others should earn. For example, the cross-country ISSP surveys have asked direct questions a number of times about perceived and fair distributions of incomes. Each year the ISSP survey administers a number of core questions, as well as rotating modules on specific topics. These modules in 1987, 1992, 1999, and 2009 were on Social Inequality. Individuals were asked directly how much they thought that individuals in certain job types earned. For example, in the 1987 wave, variable v26 refers to the answer to the following question: We would like to know what you think people in these jobs actually earn. Please write in how much you think they usually earn each year, before taxes. (Many people are not exactly sure about this, but your best guess will be close enough. This may be difficult, but it is important, so please try.). First, about how much do you think a bricklayer earns? Variable v27 refers to the answer to the same question, but now with respect to a doctor in general practice. The following nine questions then cover the income of a bank clerk, an owner of a small shop, the chairman of a large national company, a skilled worker in a factory, a farm worker, a secretary, a city bus driver, an unskilled factory worker, and a cabinet minister in a national government. Last, individuals are asked a series of 11 questions covering the same occupations, but this time are asked to indicate what they think that these individuals should earn each year before taxes, regardless of what they do actually receive. The same types of questions are repeated across the different Social Inequality modules, although by 2009 the questions only covered the five occupations of a doctor in general practice, the chairman of a large national company, a shop assistant, an unskilled factory worker, and a cabinet minister in a national government. Similar kinds of questions have appeared in a number of other surveys, including the 2005 wave of the SOEP. It is also possible to ask these questions about actual and just rewards with respect to the individual herself, or regarding a hypothetical third person with a given set of demographic characteristics (see Jasso, 2007). One application of the answers to these questions is to consider the responses that are given for occupations at the top and bottom end of the income distribution; for example, in the preceding ISSP questions, the incomes of the chairman of a large national company and an unskilled factory worker. The ratio of these two gives an indication of the income inequality that the respondent perceives. Along the same lines, a fairness index can be calculated as the ratio of the incomes that the individual believes that these two occupations should earn. The comparison of these two ratios gives an indication of how much of the gap in earnings that the individual perceives is considered to be fair. An empirical application of this kind of approach can be found in Schneider (2012), who used German data from the 2006 wave of International Social Justice Project to consider the relationship between subjective well-being and income inequality. Instead of calculating a Gini coefficient from within the data set, or matching it in at some level from an external data source, she calculated a direct measure of the individual’s perception of the fairness of the income distribution. Using the responses to the questions about the perceived incomes (PI) and just incomes (JI) of a managing director (MD) and an unskilled worker, she calculated a measure of the overall legitimacy of income inequality as follows: legitimate inequality = ln [(PIMD/PIunskffled) / CjiMD /^unskilled)] #8729; Someone who believes that the current income distribution is just has a value of legitimate inequality of zero. Those who believe that the income gaps should be wider will have a negative value, whereas those who perceive some inequality of reward will have a positive value. This measure of legitimate inequality varies at the individual level, therefore providing far more potential explanatory power than the aggregate-level measures of income inequality that have been discussed so far.[873] In her 2006 data, Schneider reported an average value of the first term in the square brackets, PIMD/PIunskiUed of around 644, with the average value ofJIMD/JIunskilled being slightly over 300. This yields a value of legitimate inequality of around 0.75. The individual level of the perception of inequality is shown to be negatively correlated with life satisfaction. This correlation is stronger for the higher than for the lower income groups. Osberg and Smeeding (2006) appealed to these questions in the 1999 ISSP survey. However, instead of looking at the gaps with respect to the top and bottom occupations in the list, they considered the entire set of responses regarding perceived and just incomes. By assuming that there are equal numbers of individuals in each of the nine occupations, they could calculate Gini coefficients, both with respect to the income that the individual actually believes is earned and a “just” Gini coefficient for the income that she believed should pertain. They then calculated the ratio of these two Gini coefficients: a value of less than one implies that the individual believes that there should be less inequality than that which she believes exists.[874] Most people are in favor of some leveling of incomes, whereas very few believe that all incomes should be the same. The average value of the ratio of the Gini coefficients is less than one in all of the 27 countries that appear in the 1999 ISSP. The average figure across all countries is 0.75. In some countries, such as the United States and Japan, this figure is around 0.8; in others such as Spain and Sweden, it is under 0.7. As well as crosscountry differences in this measure of the desire to redistribute, there are systematic differences by individual characteristics. In particular, Osberg and Smeeding underlined the importance of age, education, and family income in this respect. A more direct approach to perceived income inequality, and its relation to subjective well-being, was taken by Smyth and Qian (2008), who used Chinese data from a 2002 survey of 31 cities. In this data, individuals were asked directly about their perceptions of inequality of the income distribution, on a 1-5 ordered scale. These perceptions are shown to be correlated with individual happiness scores.[875] The sign of this correlation depends on the individual’s own position in the income distribution. In particular, perceived inequality is negatively correlated with happiness for individuals who are in the bottom quintile of the income distribution, whereas this correlation is positive for those who are in the top quintile. The importance of inputs and income inequality has also appeared in the experimental literature: It matters where income comes from. Abeler et al. (2010) found, in a gift-exchange game, that equal wages lead to systematically lower levels of effort being furnished by workers than when the firm can decide to pay workers differently. Their explanation is that workers do not want their wage-effort ratio to be lower than that of their coworkers, and they consequently work less hard. Clark et al. (2010) also found that the wages offered to other experimental participants in a gift-exchange game are negatively correlated with the effort furnished by the worker. Krawczyk (2010) found in experimental work that the equality of opportunity moderates the desire to redistribute. Perhaps the most direct evidence of attitudes toward inequality comes from asking individuals whether they want to see less of it, by redistributing from the richer to the poorer. There is a considerable literature on the desire to redistribute (see Forster and Toth, 2014). One ofthe first contributions is Persson and Tabellini (1994), who both proposed a theoretical model and presented some empirical results with respect to the median-voter theorem. The individuals here are purely concerned with their own self-interest and have no social preferences as such. The median here refers to the distribution of some variable, for example, income or skills (as measured by education). The individual’s voting preferences will then depend on their own position in that distribution. A second well-known contribution is Piketty (1995), who developed a theoretical model to explain why, in the long run, left-wing dynasties in the lower class are more supportive of redistributive policies, whereas right-wing dynasties in the upper-middle classes are less so. As in Persson and Tabellini (1994), individual income is here related to political opinion: those with higher incomes are more right-wing and less favorable to redistributive policies, whereas those with lower incomes are more likely to vote for left-wing parties and to be in favor of redistribution.[876] It is not only the individual’s situation today that counts, but also where she thinks she might end up tomorrow. The “prospect of upward mobility” (POUM) literature explicitly appeals to individuals’ future prospects of social mobility. As such, own current income is not a sufficient statistic to know the individual’s current preferences over redistribution. The currently poor may oppose redistribution if they expect their own income to improve in the future (Benabou and Ok, 2001, provide theoretical and empirical evidence that the POUM hypothesis works to limit the extent of redistribution in democracies). There is an obvious parallel between the POUM hypothesis and what we referred to as the signal effect of others’ incomes in Section 13.2.1. A number of pieces of empirical work have correspondingly underlined the importance of both current and future income. Along these lines, Ravallion and Lokshin (2000), using Russian microdata, were the first to show that self-assessed expected own social mobility, or the belief of being on a rising income trajectory, leads to lower demand for redistribution. Alesina and La Ferrara (2005) showed that preferences for redistribution are sensitive to the objectively measured future gains and losses that would result from it (again, this is consistent with pure self-interest). They also stressed the importance of mobility as an objective measure of the future expected gains and losses resulting from redistribution. In particular, there is a negative relationship between upward mobility (defined as the individual’s own job prestige being higher than that of their father) and preferences for redistribution.[877] A subjective measure of whether the respondent says that he and his family “have a good chance of improving their standard of living” is very strongly negatively correlated with support for redistribution. Cojocaru (2014b) analyzed data from the second wave of the LiTS survey (the data are from 2010), and showed that preferences for redistribution are indeed linked to future upward mobility. The demand for redistribution is lower among those who are poor today but expect to be rich[878] in 4 years’ time than for those who expect to be poor at both points in time. In line with the original POUM hypothesis, this finding only holds for those with lower levels of risk aversion (from a question on whether the individual would sell their car to buy insurance against a catastrophic drought). Guillaud (2013) used 2006 ISSP data covering 33 countries to show that income and occupation are both important predictors of redistributive preferences. Equally, downward social mobility (having a lower position on the social scale now relative to 10 years ago) increases the demand for redistribution, whereas upward social mobility reduces it. There is some evidence that the downward mobility coefficient is larger in size than that on upward mobility, as if individuals were loss-averse with respect to status. Clark and D’Angelo (2013) analyzed 18 waves of BHPS data. They showed that higher social status is associated with less favorable attitudes to redistribution and the public sector, as is commonly found. However, they also found that upward mobility (relative to one’s parents) is associated with more left-wing attitudes, which are shown to be translated into actual reported voting behavior. As noted in Section 13.3.1, Alesina et al. (2004) showed that the effect of inequality on happiness is larger in value in Europe than in the United States. The explanation proposed in Alesina et al. is in terms of greater perceived social mobility in the United States than in Europe. Measures of the demand for redistribution have also been shown to be correlated with the individual’s view of the fairness of the income distribution (Corneo and Gruner, 2002; Luttens and Valfort, 2012). The former test the importance of fairness in determining preferences for redistribution via the answer to the ISSP question “How important is hard work for getting ahead in life?” with responses “essential,” “very important,” “fairly important,” “not very important,” and “not important at all.” They show that there is a self-interested component, in that those who state that they would personally benefit from lower inequality are indeed in favor of redistribution, whereas those with higher incomes are against distribution. The estimated coefficient on their fairness variable, “hard work is key” (defined as providing one of the first three responses given earlier), is shown to be negative and significant in a preferences for redistribution regression. Luttens and Valfort (2012) appealed to data from the WVS and the ESS. They showed that both own income and the individual’s perception of fairness determine redistribution preferences. It is of interest to note that individuals in the United States seem to more sensitive to fairness considerations in determining redistribution than are European respondents. Toth and Keller (2011) considered data from the 2009 Poverty and Social Exclusion module of the Eurobarometer. They calculated a Redistributive Preferences Index (RPI) using Principal Component Analysis of five questions on redistribution. The values of this index were then correlated with both individual and country-level variables. The latter include estimates of the distribution of income matched in from LIS data. They showed that the RPI is higher for those with lower material status, those who expect the situation to deteriorate over the next 12 months, and those who do not think that the poor are lazy. They also considered a number of percentile distribution measures (P95/P5, P95/P50, and P50/P5), as well as the Gini coefficient. All of the three percentile ratio measures attract positive significant estimated coefficients, so that the desire to redistribute rises with inequality. Inequality at the top and bottom of the distribution seems to play an equal role here. Yamamura (2012) also showed that the prefecture-level Gini coefficient is positively associated with redistributive preferences in 7 years of Japanese GSS data, although with a significant effect only for the richer. One perhaps salient point here is that the questions used to establish preferences for redistribution are very different from one survey to another, which hampers the comparability of the existing results. Attitudes to income inequality are measured as follows in the BHPS: “People have different views about the way governments work. The government should place an upper limit on the amount of money that any one person can make.” Answers to this question are on a 1—5 scale, where 1 represents complete disagreement and 5 complete agreement. This is not a question about redistribution in general, but about pulling the top of the distribution down. In the ISSP, respondents are asked “On the whole, do you think it should or should not be the government’s responsibility to reduce income differences between the rich and the poor?” with answers on a 1-4 scale. The relevant question in the WVS asks individuals to indicate, on a 1-10 scale, which of the two extremes they most agree with: “People should take more responsibility to provide for themselves” versus “The government should take more responsibility to ensure that everyone is provided for.” As Luttens and Valfort (2012) noted, this does mix up concerns for the income distribution with perceptions of government efficiency. Last, the question in the ESS is similar to that in the WVS, asking individuals to choose between “Government should decrease taxes a lot and spend much less on social benefits and services” and “Government should increase taxes a lot and spend much more on social benefits and services.” As well as individuals’ stated preferences for redistribution, a recent paper has provided intriguing evidence that the actual observed progressivity of the tax system is positively correlated with average national well-being. Oishi et al. (2012) used data from 54 countries in the 2007 Gallup World Poll. Respondents here reported three different kinds of well-being measures: Cantril’s ladder of the worst to best possible life, and positive and negative daily experiences. The country averages of these scores were correlated with the progressivity of the national tax system from Worldwide-Tax.com (calculated as the highest minus the lowest marginal tax rates, or the difference in the tax rates of those earning 67% and 167% of the country mean income). Tax progression is positively correlated with subjective well-being (see their Figure 1). This is not a simple revenue effect, as both the overall tax rate and government spending are significant in the well-being regressions. 13.4.4 OnlySelf-Interest? The view of others in the comparative view of the reference group is arguably rather a depressing one. Other people are a negative externality in that Yi gt; Yj brings relative satisfaction and Yi lt; Yj relative deprivation for individual i. However certain others may be relevant for the individual, but not viewed in this comparative way. Rather, as intimated in the Introduction, there may well be a sentiment of extended sympathy toward some groups. In a parallel to the comparative reference group, the individuals toward whom one behaves altruistically will be chosen by the individual and may well exclude certain groups in society. This leads us to the discussion of altruistic behavior, whereby transferring one’s own money to others not only increases the recipient’s well-being but also that of the donor. Although it is commonplace that generous people record higher well-being scores, showing causality from the former to the latter is more difficult.[879] Luckily there are a number of pieces of research that have suggested such a causal link. One way of establishing causality is to use experiments. There has been something of a cottage industry in using randomized allocations or natural experiments to look at the relationship between own income and subjective well-being. Dunn et al. (2008) built on the observed positive correlation between prosocial spending and subjective wellbeing by considering a randomized experiment in which some individuals are forced to be generous. In particular, experimental participants first reported their happiness. They are then given an envelope with either $5 or $20 to spend that day. Half are told to spend the money on themselves, and the other half on someone else. Happiness recorded later that same evening showed a significant subjective well-being margin in favor of those who spent on others. Importantly, when surveyed regarding what they thought would make them happy, a separate sample of respondents thought that spending on themselves would make them happier than spending on others; as such, individuals are not necessarily aware of the happiness benefits of altruism ex ante. Aknin et al. (2013) made the same point more broadly. They first reported a positive correlation between prosocial spending and happiness in 136 countries from the Gallup World Poll. They also appealed to experimental analysis. In Canada and Uganda, individuals asked to recall a past instance of prosocial spending reported higher happiness scores than did those who were asked to recall a past instance of personal spending; equally, in India individuals asked to recall a past instance of prosocial spending reported higher happiness scores than did those who were not asked to recall past spending. Last, along the same lines as Dunn et al. (2008), participants in Canada and South Africa who were randomly assigned to buy items for charity reported greater positive affect than those who were assigned to purchase the same items for personal use. Boehm and Lyubomirsky (2009) showed that individuals in a treatment group who were told to perform three extra acts of kindness a day experienced a sustained rise in happiness compared to a control group. 28 It is a small step from monetary donations to others to volunteering in general, and Carpenter and Myers (2010) showed that the two are indeed correlated. Meier and Stutzer (2008) analyzed survey data around the time of German reunification, which led to a sharp reduction in volunteering opportunities in East Germany. Meier and Stutzer showed that the drop in subjective well-being was larger for those who had previously volunteered than for those who had not: A natural conclusion is then that volunteering caused well-being. A vibrant research area of interest in this respect covers charitable giving. Individuals may give to charity either because they care about the recipients of their largesse or because they derive some process utility from the act of giving that is independent of the use to which their gift is put (which is what Andreoni, 1989, calls “impure altruism”).[880] Konow (2010) appeals to a series of carefully designed experiments to show that giving to others cannot be only explained by the “warm glow” of the process utility, and that the student subjects are systematically more generous toward charities than toward fellow students. This latter holds even when the charities are not known to the subjects, avoiding any role for familiarity. Konow suggested an overarching role for contextdependent norms in the determination of giving to others, which he identified as equity and need in his experiments. Useful relevant symposia on charitable donations can be found in the June 2011 special issue of the Journalof PublicEconomics on Charitable Giving and Fundraising and the forthcoming book edited by Fack and Landais (2014). As noted by Clotfelter (2014), charitable giving is a more important phenomenon in the United States than in other G7 countries. However, it does remain unclear whether such giving is always redistributional, in the sense of being aimed at the less well-off. A first point is that some charitable donations, especially among the richer, go to the arts or education. Perhaps even more saliently, charitable donations in the United States are regressive in terms of the percentage of income donated (see http://philanthropy.com/ article/Interactive-How-America-Gives/133709/). Section 13.2.1 described a number of pieces of research in the vein of the comparative reference group, whereby higher incomes among relevant others were associated with lower levels of subjective well-being. This correlation is not always found to be negative, however. A variety of contributions have found that satisfaction and the income of close neighbors are actually positively correlated. This is the case in survey data in Canada (Barrington-Leigh and Helliwell, 2008), China (Kingdon and Knight, 2007), and Denmark (Clark et al., 2009a). Although the nonexperimental protocol here makes interpretation more difficult (there are any number of reasons why people might be happier with richer neighbors, including tunnel effects or the provision of local public goods), these findings are consistent with empathy with respect to close neighbors. 29 Kranton et al. (2013) also underlined that individuals can be altruistic toward some individuals, but comparative with respect to others. Individuals in their experiment make a series of choices regarding income allocations between two subjects. These subjects can be the individual, a member of her own group, or a member of another group. These groups are determined either by political persuasion, or as “minimal groups” depending on a preference over two nearly identical lines of poetry, landscape images, and abstract paintings. The authors found considerable heterogeneity in social preferences and showed that individuals are less generous (or even downright destructive, as in Zizzo and Oswald, 2001), toward individuals outside their group, even when groups are essentially randomly formed. The theoretical implications of altruism in terms of redistribution are analyzed in Hochman and Rogers (1969). In this case, some redistribution can make everyone better off. Hochman and Rogers considered transfers only from richer to poorer and that do not change the income ranking. Transfers are costless; there is no leaky bucket. One of the central aims of their analysis is to establish how the amount transferred depends on the income gap between the rich and the poor. They distinguished two salient cases, which depend on the “transfer elasticity.” When this elasticity is zero, the same fixed sum is always transferred; when it equals one, then the amount transferred is proportional to the income gap between the rich and the poor. A calibration suggests that actual U.S. income tax rates are more consistent with the elasticity being one than zero. 13.5.
More on the topic OUTSTANDING ISSUES:
- Issuing gilts
- Bond Market Development
- Salient Themes in the Literature
- Article 3.10 EM bonds: are you nuts? Investors are buying bonds with ever less discrimination
- Malta
- The Contemporary Scene in Soviet Ukraine
- Article 15.8 Moody's risk alert sparks covered bond dispute
- Article 7.3 Sub-Saharan market: high yields fire appetite for African Eurobonds
- Introduction
- Financial institutions and markets