KEY DIAGRAM 4
National saving and investment in a small open economy
This open-economy version of the savinginvestment diagram shows the determination of national saving, investment, and the current account balance in a small open economy that takes the world real interest rate as given.
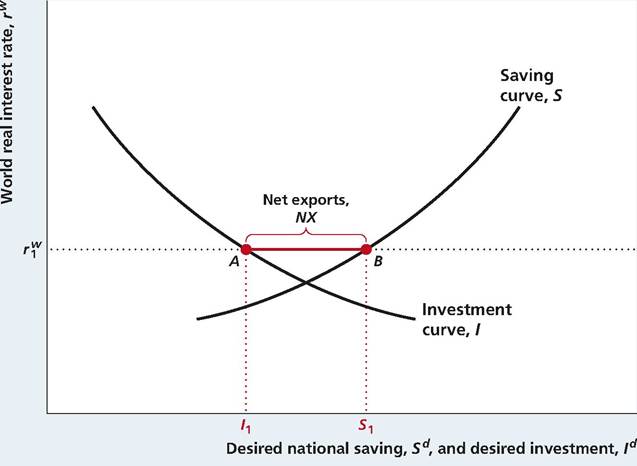
Diagram Elements
■ The world real interest rate is measured on the vertical axis, and the small open economy's desired national saving, Sd, and desired investment, Id, are measured on the horizontal axis.
■ The world real interest rate, rw, is fixed, as indicated by the horizontal line.
■ The saving curve, S, and the investment curve, I, are the same as in the closed-economy saving-investment diagram, Key Diagram 3.
Analysis
■ Goods market equilibrium in a small open economy requires that desired national saving equal desired investment plus net exports (Eq. 5.4). In the diagram when the world real interest rate is r1w, desired national saving is S1 and desired investment is 11. The country's net exports, NX, and current account balance, CA, or
1 1, is distance AB. Equivalently, distance AB, the
excess of desired national saving over desired investment, is the amount that the small open economy is lending abroad, or its financial account deficit, -FA.
Factors That Shift the Curves
■ Anything that increases desired national saving in the small open economy, for a fixed value of the world real interest rate, shifts the saving curve to the right. Factors that shift the saving curve to the right (see Summary table 5 in Chapter 4) include an increase in current output, Y, a decrease in expected future output, a decrease in wealth,
a decrease in current government purchases, G, and (if Ricardian equivalence doesn't hold and taxes affect saving) an increase in current taxes, T.
■ Anything that increases desired investment at the prevailing real interest rate shifts the investment curve to the right. Factors that shift the investment curve to the right (see Summary table 6) include an increase in the expected future marginal product of capital, MPKf, and a decrease in the effective tax rate on capital.
■ An increase in desired national saving shifts the saving curve to the right and raises net exports and the current account balance, CA. Equivalently, an increase in desired national saving raises the country's net foreign lending, which equals its financial account deficit, -FA. Similarly, an increase in desired investment shifts the investment curve to the right and lowers net exports, the current account balance, net foreign lending, and the financial account deficit.
■ An increase in the world real interest rate, rw, raises the horizontal line in the diagram. Because an increase in the world real interest rate increases national saving and reduces investment, it raises net foreign lending, net exports, the current account surplus, and the financial account deficit.
►
More on the topic KEY DIAGRAM 4:
- KEY DIAGRAM 5
- Abel A.B., Bernanke B., Croushore D.. Macroeconomics. 10th Edition, Global Edition. — Pearson,2021. — 690 pp., 2021
- The /S Curve: Equilibrium in the Goods Market
- KEY DIAGRAM 2
- FENCING
- 3M Participatory Evaluation: Introducing the Methodology
- ITEMIZING
- EVALUATING EXTENDED ARGUMENTS
- E Big Data: What Is It?
- D Kinds of Science: Hypothesis-Based Versus Non-Hypothesis-Based