Ecologists estimate abundance using a variety of methods
As just mentioned, many ecological studies require an estimate of a population's actual abundance, or absolute population size. For example, with species that are threatened or endangered, it is ideal to estimate their absolute population sizes in order to keep track of possible further declines.
In other cases, it may be sufficient to estimate the relative population size, the number of individuals in one time interval or place relative to the number in another. Estimates of relative population size are based on data that are presumed to be correlated with absolute population size but do not assess the actual number of individuals in the population. Examples of such data include the number of cougar tracks found in an area, the number of fish caught per unit of effort (e.g., per number of hooks trolled each day), or the number of birds observed while the observer walks a standard distance (or remains in one place for a standard time interval).Relative population size estimates are usually easier and less expensive to obtain than are absolute estimates. While useful, estimates of relative population size must be interpreted carefully. The number of cougar tracks observed, for example, depends not only on cougar population density, but also on animal activity. Thus, if twice as many tracks were found in area A as in area B, we could not be confident that area A had twice as many cougars—there could be more or fewer than that, depending on whether cougars moved more frequently in one area than in another.
Methods for estimating abundance fall into three general categories: (1) areabased counts in which the number of individuals in a given area or volume are counted, (2) distance methods in which the distances of individuals from a line or a point are measured and then converted into estimates of the number of individuals per unit of area, and (3) mark-recapture studies, which involve releasing marked individuals and then recapturing them at a later time to estimate the total population size.
You can learn more about these methods in ECOLOGICAL TOOLKIT 9.1, where we describe these approaches in more detail and provide examples.ECOLOGICAL TOOLKIT 9.1
Estimating Abundance
Methods for estimating abundance fall into three general categories: area-based counts, distance methods, and mark-recapture studies. Many variations on these approaches have been developed, and a wide range of statistical techniques are available for analyzing abundance estimates obtained using each of them (Krebs 1999; Williams et al. 2002).
A Area-Based Counts
In an area-based count, as its name suggests, the number of individuals in a given area or volume are counted. Area-based counts are often used to estimate absolute population sizes of organisms that are sessile (e.g., plants) or can move only short distances during the time it takes to count the individuals in a quadrat (e.g., sea urchins). Area-based counts can also be used to estimate the abundances of more mobile organisms, as when large mammals are observed in aerial surveys. Area-based counts of highly mobile organisms can provide estimates of relative population sizes; further information (such as the probability that an organism will be present but not seen when surveyed by air) may be required before such counts can be used to estimate absolute population sizes.
Often area-based counts make use of a quadrat (FIGURE A), which is a sampling area (or volume) of any size or shape, such as a 0.25 ? 0.25-m2 square plot used to count small plants, a 0.1-ha plot used to count trees, or a soil core of a certain diameter and depth used to count soil organisms. The counts from multiple quadrats are then summed and averaged to estimate the number of individuals per unit of area (or volume), which can then be used to estimate the total population size. Suppose, for example, that an entomologist wants to estimate the population of chinch bugs in a 400-ha (ca.
1,000-acre) field of corn. If they counted chinch bugs in five 10 ? 10cm quadrats (i.e., five 0.01-m2 quadrats), and their counts were 40, 10, 70, 80, and 50 chinch bugs, they would estimate that there were, on average,

FIGURE A AnUnderwaterQuadrat A marine biologist uses a square quadrat to count the numbers of individuals of different coral species found on a reef off the Caroline Islands, Micronesia.
View larger image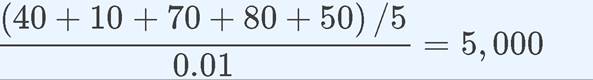
(9.1) chinch bugs per square meter. Thus, there would be an estimated 20 billion chinch bugs in the population (5,000 bugs/m2 ? 10,000 m2∕ha ? 400 ha = 20,000,000,000).
Area-based methods work well if individuals can be counted accurately within the quadrats, and if the quadrats provide a good representation of the entire area covered by the population. To help ensure that the latter condition is met, ecologists use as many quadrats as is feasible, and they often place those quadrats at locations selected at random from the entire area covered by the population. Quadrats can also be placed in a variety of other ways, such as at evenly spaced locations along a transect line or rectangular grid.
B Distance Methods
In distance methods, an observer measures the distances of individuals seen from a line or a point; these distances are then converted into estimates of the number of individuals per unit of area. In the line transect approach, an observer travels along a transect line. Each individual that the observer can see from the line is counted, and its perpendicular distance from the line is recorded (d1, d2, and d3 in FIGURE B). The distances can then be used to estimate the absolute abundance; this conversion requires a detection function, which accounts for the probability of an individual at varying distances away from the transect. Other distance methods include point sampling techniques, in which the distance to the nearest (visible) individual is measured from a series of locations or “points”; as with line transect data, a detection function is used to convert these distances into estimates of the absolute population size (see Krebs 1999; Schwarz and Seber 1999).
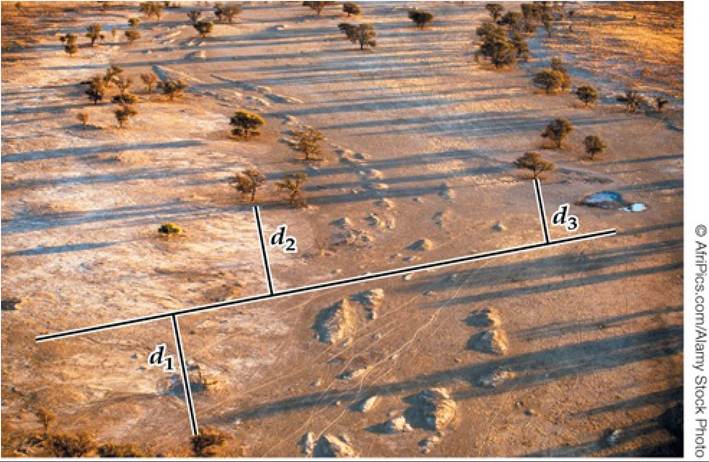
FIGURE B Counting Trees from a Line Transect The density of these camelthorn trees (Acacia erioloba) in Kgalagadi Transfrontier Park, South Africa, could be estimated using a line transect, as shown here.
View larger imageC Mark-Recapture Studies
Mark-recapture studies are used to estimate the absolute population size of mobile organisms; they are also used to obtain data on the survival or movement of individuals. With this method, a subset of the individuals in a population is captured, marked (as with a tag or dot of paint) so that they can be recognized at a later time, and released. After the marked individuals have been given enough time to recover and move throughout the population, individuals are captured a second time, and the proportion of marked individuals found in the second capture is used to estimate the total population size.
Imagine, for example, that we capture 23 butterflies from a meadow, which we then mark and release (FIGURE C). A day later, we sample the meadow again, this time catching 15 butterflies, of which 4 are marked. In our first sample, we caught and marked M1 = 23 butterflies from a total population of unknown size (N); thus, we initially caught a proportion M1∕N of the butterflies in the field. The second time butterflies were sampled, we caught M2 = 15 butterflies, of which 4 were marked and hence were recaptured (R = 4).
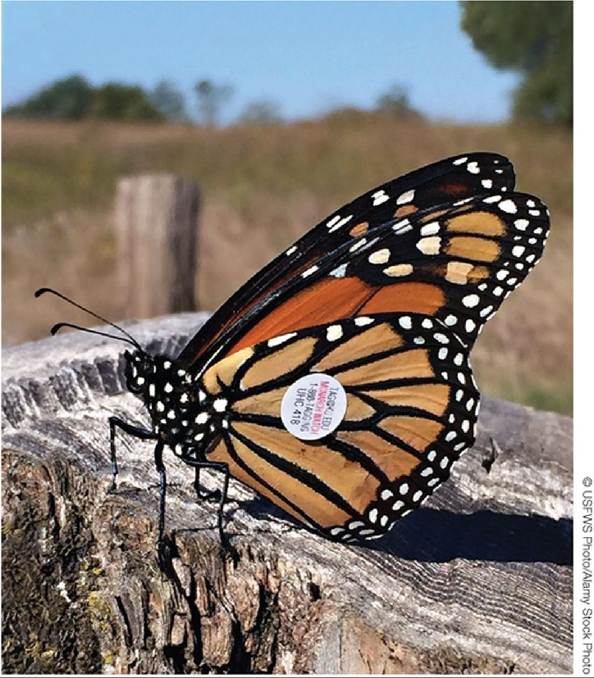
FIGURE C Release of Marked Butterfly To obtain mark-recapture estimates of butterfly abundance, ecologists tag and then release them back into their habitat (note tag on the left wing). View larger image
Assuming that no butterfly births, deaths, or movements into or out of the meadow have occurred since our first sample, the proportion of marked individuals captured in our second sample (R∕M2) should
equal the original proportion we caught, M1∕N. Thus, we have the equation

(9.2)
We can rearrange Equation 9.2 to estimate the total number of butterflies in the meadow as

(9.3)
which in this case would equal (23 ? 15)/4 = 86.
Equation 9.3 assumes that (1) the population size does not change during the sampling period (no births, deaths, immigration, or emigration), (2) each individual has an equal chance of being caught, (3) marking does not harm individuals or alter their behavior (such as by making them harder to recapture), and (4) marks are not lost over time. A wide range of other mark-recapture methods have been developed to address cases in which one or more of these assumptions are violated (Krebs 1999; Schwarz and Seber 1999; Williams et al. 2002).
More on the topic Ecologists estimate abundance using a variety of methods:
- When ecologists perform experiments, they often take the three additional steps described in ECOLOGICAL TOOLKIT 1.1: they replicate each treatment, they assign treatments at random, and they analyze the results using statistical methods.
- In the previous chapters we have taken a look at the variety of circumstances in which claims of freedom of expression might be invoked and at the variety of interests that government might be pursuing through the allegedly infringing law or governmental action.
- AN ANCIENT ESTIMATE OF THE SPEED OF LIGHT
- Methods
- Ecologists often delineate communities by their physical or biological characteristics
- Habitat suitability determines distribution and abundance
- Ecologists use experiments, observations, and models to answer ecological questions
- Marx and Engels: Prometheans or Pioneering Ecologists?
- Ecologists may use subsets of species to define communities
- Growth with expanding variety
- As indicated above, ecologists have long thought that competition between species was important in communities.
- Distribution and Abundance Patterns
- 9 Population Distribution and Abundance
- Comparison of Culture Methods
- Processes Important to Distribution and Abundance
- METHODS
- Methods
- METHODS