Snowshoe Hare Cycles: A Case Study
In 1899, a fur trader in northern Ontario reported to the Hudson's Bay Company that “Indians are bringing poor hunts. They have been starving all spring. Rabbits being scarce” (Winterhalder 1980).
The “hunts” referred to were pelts of beavers and other fur-bearing animals trapped by members of the Ojibwa tribe, and the “rabbits” were actually snowshoe hares (Lepus americanus; FIGURE 12.1). Collectively, 200 years of such reports show that hare populations increased and decreased regularly. When hares were abundant, the Ojibwa had enough food to spend time trapping for pelts, which they then traded to the Hudson's Bay Company. But when hares were scarce, tribal members concentrated on gathering food, rather than trapping animals that provided pelts, but little meat.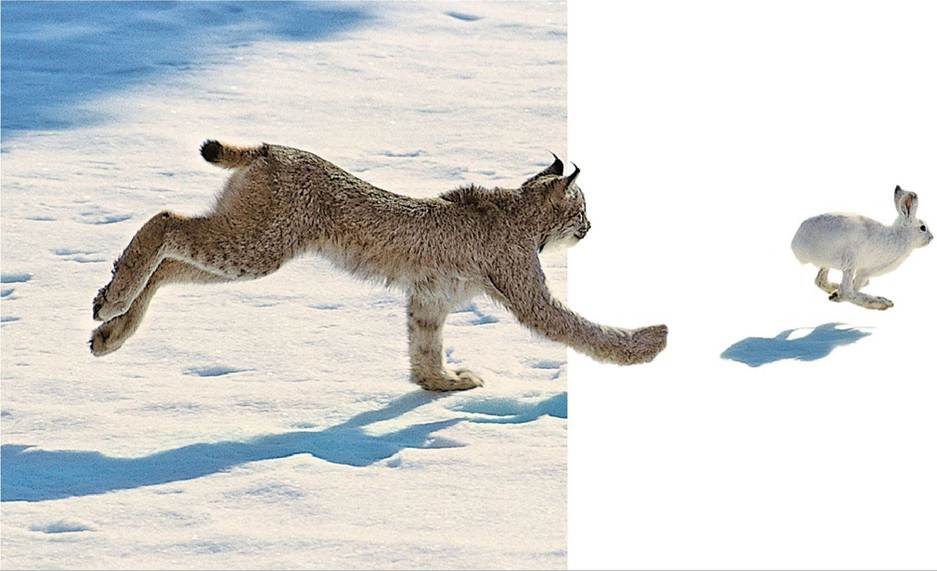
FIGURE 12.1 Predator and Prey A snowshoe hare (Lepus americanus) flees from its specialist predator, the Canada lynx (Lynx canadensis). © Tom Brakefield/Digital Vision View larger image
Beginning in the early 1900s, wildlife biologists used the careful records of the Hudson's Bay Company to estimate abundances of snowshoe hares and their Canada lynx predators (Lynx canadensis). Both species exhibited regular population cycles, with abundances peaking about every 10 years and then falling to low levels (FIGURE 12.2A). Snowshoe hares constitute a major portion of the lynx diet, so it was not surprising that numbers of lynx should rise and fall with numbers of hares. But what drove the cyclic fluctuations in the hare population? Adding to the mystery, hare population sizes rose and fell in synchrony across broad regions of the Canadian forest, so explanations of hare cycles had to account for the large-scale synchrony as well.
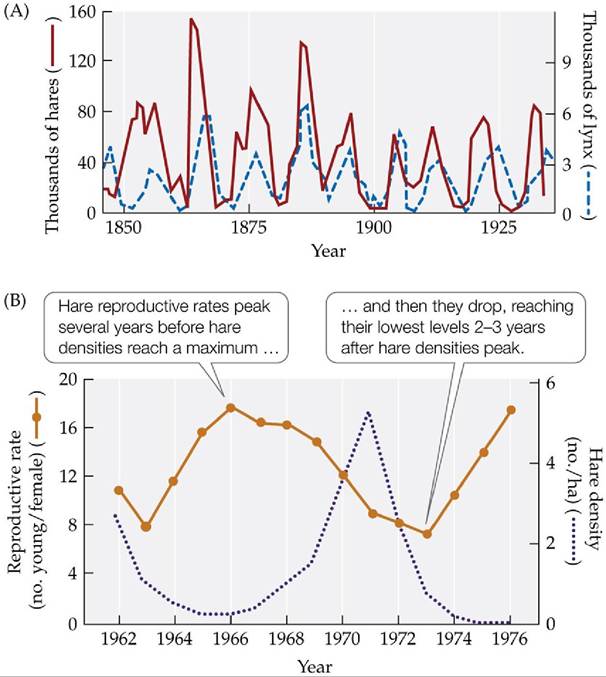
FIGURE 12.2 Hare Population Cycles and Reproductive Rates (A)Historicaltrapping data from the Hudson's Bay Company indicate that numbers of both hares and lynx fluctuated in a 10-year cycle.
(B) The highest hare reproductive rates do not coincide with the highest hare densities.In (A), does the peak abundance of one species typically occur after the peak abundance of the other species? Describe the observed pattern and hypothesize why it might occur.
(A after D. A. MacLulich. 1936. J R Astron Soc Can 30: 233-246; B after J. R. Cary and L. B. Keith. 1979. Can J Zooi 57: 375-390.) View larger image
One approach to finding the factors important to hare population cycles is to document the changes in birth, death, and dispersal rates that are associated with increasing or declining numbers of hares. Dispersal plays a relatively small role: it may alter local population sizes, but hares do not move far enough to account for the simultaneous changes in their abundance seen across broad geographic regions. In contrast, consistent patterns of birth and death rates have been found across different regions of Canada. Snowshoe hares can raise up to three or four litters over the summer, with an average of five young per litter. Hare reproductive rates reach their highest levels (ca. 18 young per female) several years before hare density reaches a maximum. Reproductive rates then begin to fall, reaching their lowest levels 2-3 years after hare density peaks (FIGURE 12.2B). Hare survival rates show a similar pattern: they are highest several years before hare density peaks; then they fall and do not rise again until several years after hare density peaks.
Together, the changes over time in hare birth and survival rates drive the hare population cycle. But what causes these rates to change? Several hypotheses have been proposed, one of which focuses on food supplies. Large numbers of hares consume prodigious amounts of vegetation, and studies have shown that food can be limiting at peak hare densities (up to 2,300 hares/km2). Two observations, however, indicate that food alone does not drive the hare cycle: first, some declining hare populations do not lack food, and second, the experimental addition of high-quality food does not prevent hare populations from cycling.
A second hypothesis focuses on predation. Many hares (up to 95% of those that die) are killed by predators such as lynx, coyotes, and birds of prey. In addition, lynx and coyotes kill more hares per day during the peak and decline phases of the hare cycle than during the increase phase. But questions remain. The killing of hares by predators explains the drop in survival rates as hare numbers decline, but by itself it does not explain (1) why hare birth rates drop during the decline phase of the cycle or (2) why hare numbers sometimes rebound slowly after predator numbers plummet. Nor does it explain other observations, such as why the physical condition of hares worsens as hares decrease in numbers. What other factors are at work?
More on the topic Snowshoe Hare Cycles: A Case Study:
- Case Study: Darug Clan, Australia
- Case study
- Case study contributors
- The First Farmers: A Case Study
- A Case Study of Solomon islands
- A Case Study of the Idu Mishmi
- “Killer Algae!”: A Case Study
- Enslaver Parasites: A Case Study
- A Sea in Trouble: A Case Study
- Nemo Grows Up: A Case Study