Species diversity estimates vary with sampling effort and scale
Let's imagine that you are sampling your backyard for insect species. It makes sense that the more samples you collect, the more species you are likely to find. However, eventually you reach a point in your sampling effort at which any additional sampling will reveal so few new species that you could stop sampling and still have a good idea of the species richness of your backyard.
That point of “no significant return” for your effort can be determined using a species accumulation curve (FIGURE 16.9). These curves are calculated by plotting species richness as a function of sampling effort. In other words, each data point on a species accumulation curve represents the total number of species and the sampling effort up to that point. The more samples taken, the more individuals will be added, and the more species will be found. In theory, one could imagine, a threshold could be reached at which no new species would be added by additional sampling. In reality, this never occurs in natural systems, because new species are constantly being found.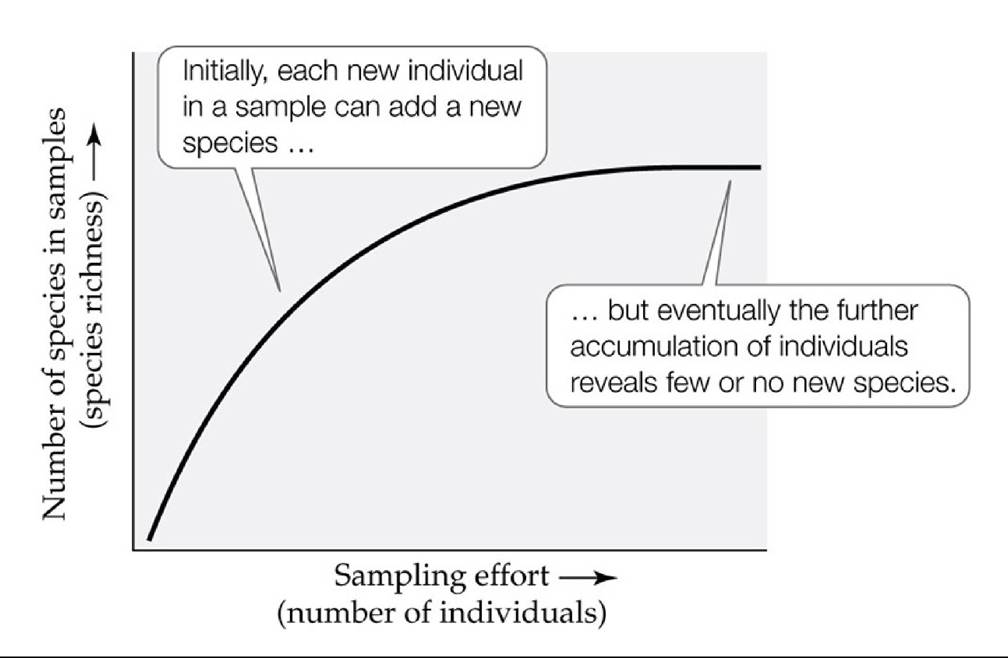
FIGURE 16.9 When Are All the Species Sampled? Speciesaccumulationcurvescanhelp us determine when most or all of the species in a community have been observed. In this hypothetical example, the number of new species observed in each sample decreases after about half the individuals in the samples have accumulated. View larger image
Jennifer Hughes and colleagues (2001) used species accumulation curves to ask how communities differ in the relationship between species richness and sampling effort. Are there some very diverse communities in which we are unable to estimate species richness accurately despite intensive sampling? Hughes and colleagues calculated species accumulation curves for five different communities: a temperate forest plant community in Michigan, a tropical bird community in Costa Rica, a tropical moth community in Costa Rica, a bacterial community from the human mouth, and a bacterial community from tropical soils in the eastern Amazon (FIGURE 16.10).
To compare the curves properly, given that the communities differed substantially in organismal abundance and species richness, the data sets were standardized by calculating for each data point the proportions of the total number of individuals and species that had been sampled up to that point. The results showed that the species richnesses of the Michigan forest plant and Costa Rican bird communities were adequately represented well before half the individuals were sampled. Human oral bacteria and Costa Rican moth communities had species accumulation curves that never completely leveled off, suggesting that their species richness was high and that additional sampling would be required to achieve an approximation of that richness. Finally, the eastern Amazon soil bacterial community had a linear species accumulation curve, demonstrating that each new sample resulted in the observation of many new bacterial species. Based on this analysis, it is clear that the sampling effort for tropical bacteria was well below that needed to adequately estimate species richness in these hyperdiverse communities.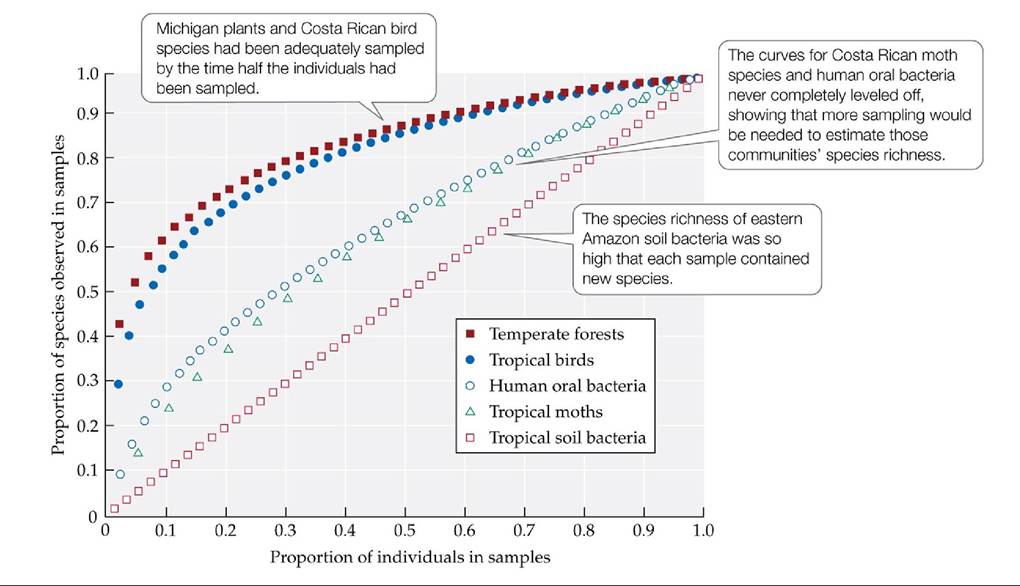
FIGURE 16.10 Communities Differ in Their Species Accumulation Curves Hughesand colleagues found that communities of five different types varied greatly in the sampling effort that would be needed to estimate their species richness. The data sets were standardized by calculating for each data point the proportions of the total number of individuals and species that
had been sampled up to that point.
Based on the graph, which of these communities would require more sampling to adequately estimate their species richness? Which would require very little additional sampling?
(After J. B. Hughes et al. 2001. Appl Environ Microbiol 67: 4399-4406.) View larger image
A comparison of species accumulation curves not only provides valuable insight into the differences in species richness among communities, but also demonstrates the influence of the spatial scale at which sampling is carried out. For example, if we were to sample the richness of bacteria in tropical soils at the same scale at which we sampled Costa Rican moths, the bacterial richness would be immense in comparison. But such comparisons do suggest that our ability to sample all the bacteria in the human mouth is roughly equivalent to our ability to sample all the moth species in a few hundred square kilometers of tropical forest. The work of Hughes et al. also reminds us how little we know about the community structural characteristics of rarely sampled assemblages, such as microbial communities.
More on the topic Species diversity estimates vary with sampling effort and scale:
- CONCEPT 18.1 Patterns of species diversity and distribution vary at global, regional, and local spatial scales.
- In the Case Study at the opening of this chapter, we saw lower hantavirus prevalence in small-mammal communities with higher species diversity than in those with lower species diversity (see Figure 19.2).
- CONCEPT 19.1 Species diversity differs among communities as a consequence of regional species pools, abiotic conditions, and species interactions.
- CONCEPT 16.2 Species diversity and species composition are important descriptors of community structure.
- Species interactions vary greatly in strength and direction
- Patterns of species diversity at different spatial scales are interconnected
- Species diversity varies with latitude
- The geographic ranges of species vary in size
- The geographic ranges of species vary in patchiness
- Species diversity is an important measure of community structure
- Scale & Efficiency versus Diversity & Safety
- Some relationships between species diversity and community function are positive
- The intermediate disturbance hypothesis considers species diversity under variable conditions
- CONCEPT 7.1 Life history patterns vary within and among species.
- CONCEPT 9.2 Species vary in their distribution and abundance across their geographic range.
- 19 Species Diversity in Communities
- Resource Mediation and Species Diversity